Hengshi Documentation
Advanced Dashboard
Creating an Advanced Dashboard
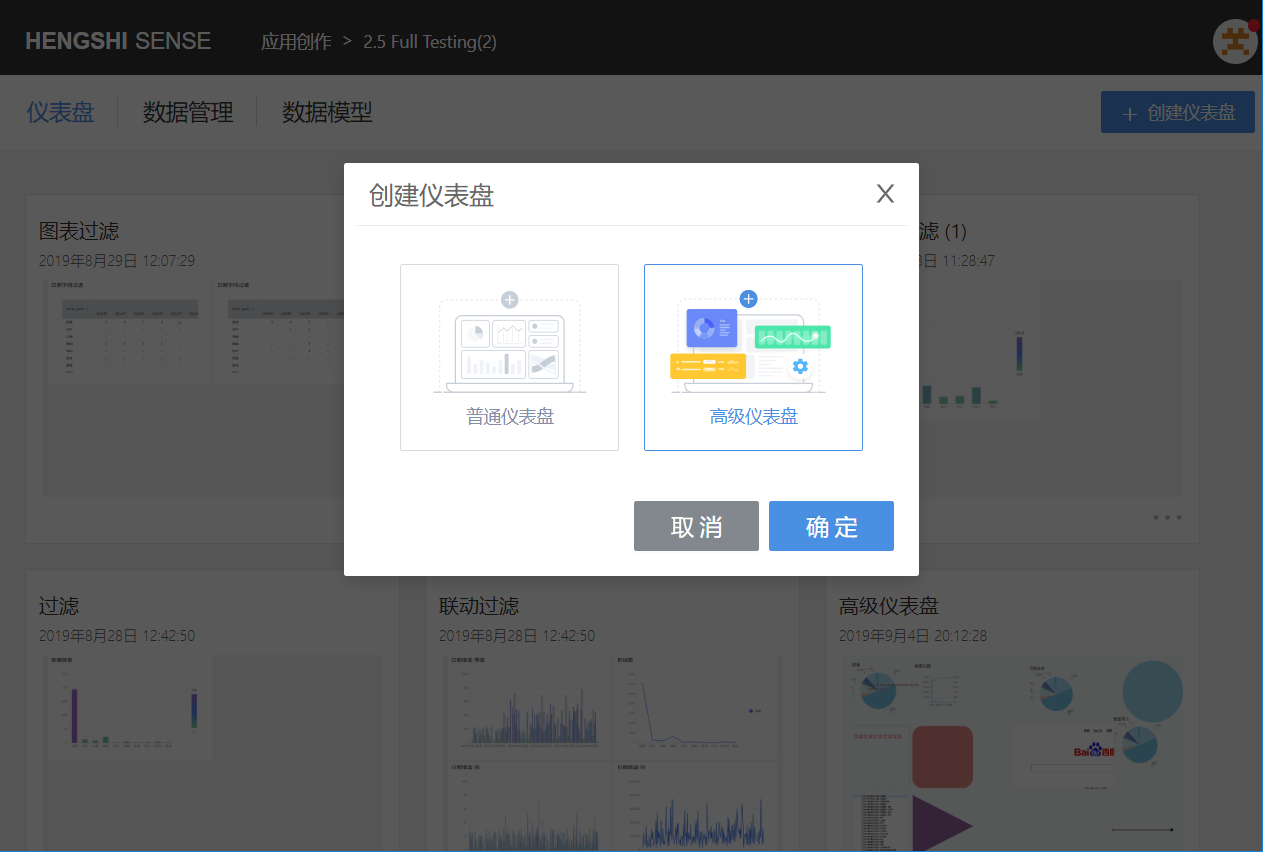
Go to the Application -> Dashboard page, click on "Create Dashboard" in the top right corner, in the popup window that opens, select "Advanced Dashboard", and click "OK".
Advanced Dashboard Settings
Title
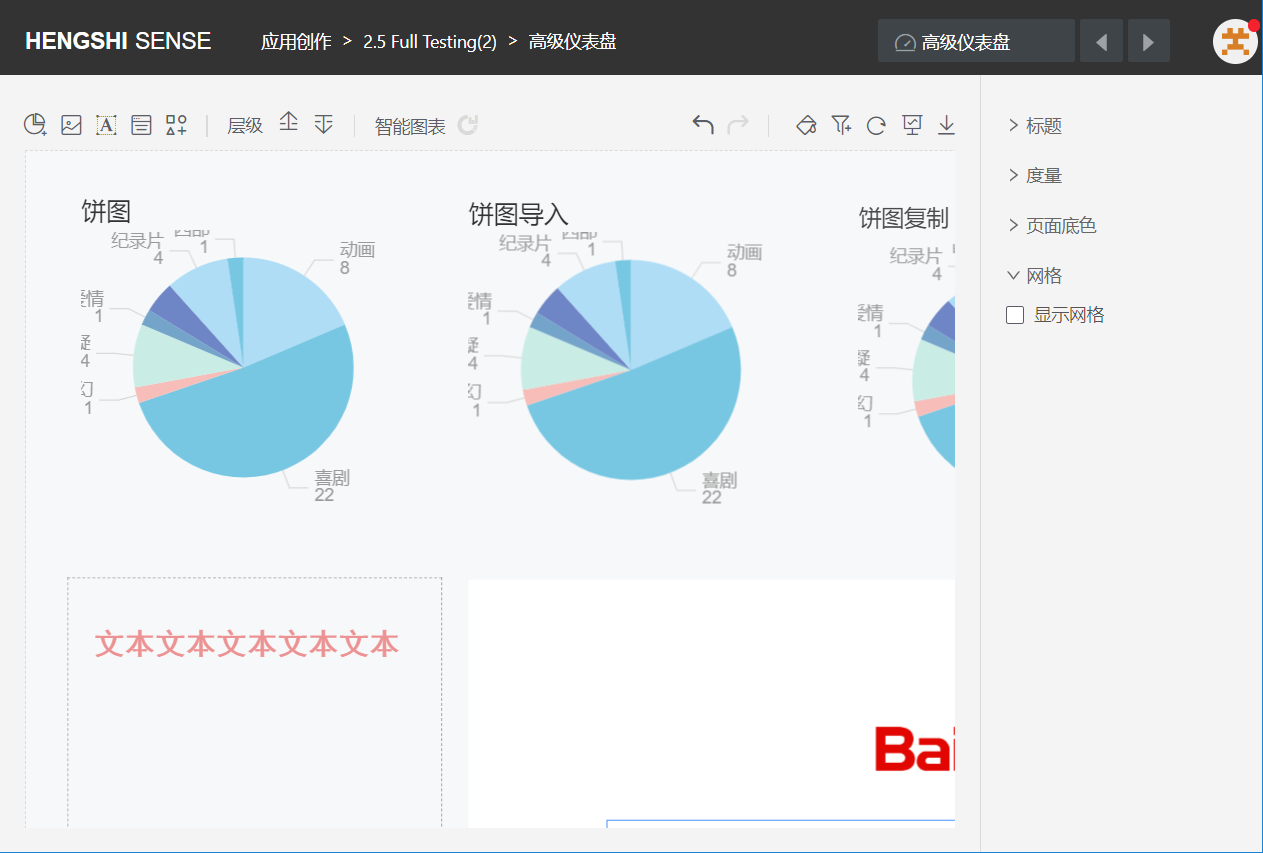
After creating an advanced dashboard, you will enter the advanced dashboard editing page. Under "Title" in the right-side menu, enter a new name to modify the title.
Metrics
In the "Metrics" area, you can set the size of the dashboard and its padding.
Page Background Color
You can choose a background color, as shown above.
Grid
You can choose whether to display the grid for precise control over the layout of dashboard elements.
Top Left Menu
The top-left menu is as follows:

Create Chart
![]()
Click the "Create Chart" icon in the top left corner, choose how to create a chart: create a new chart or import a chart.
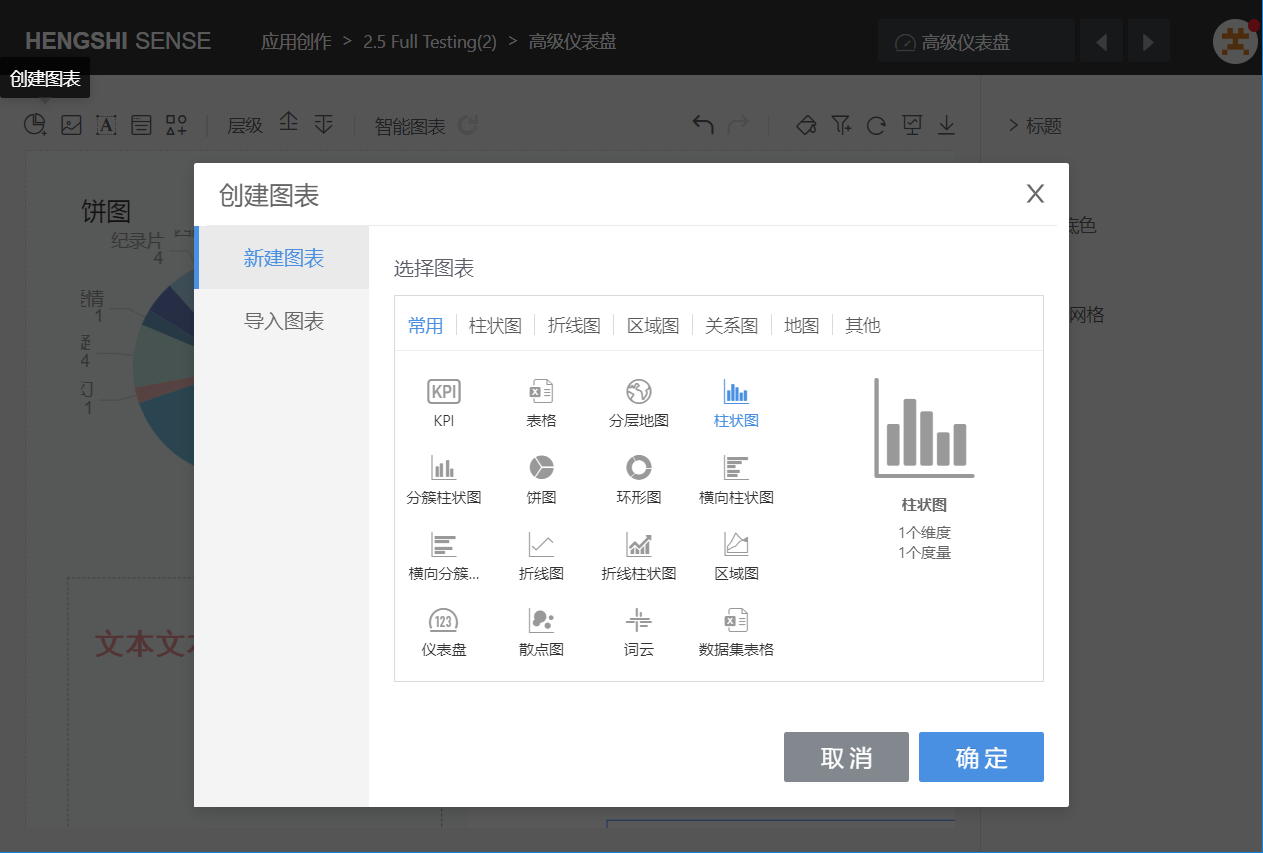
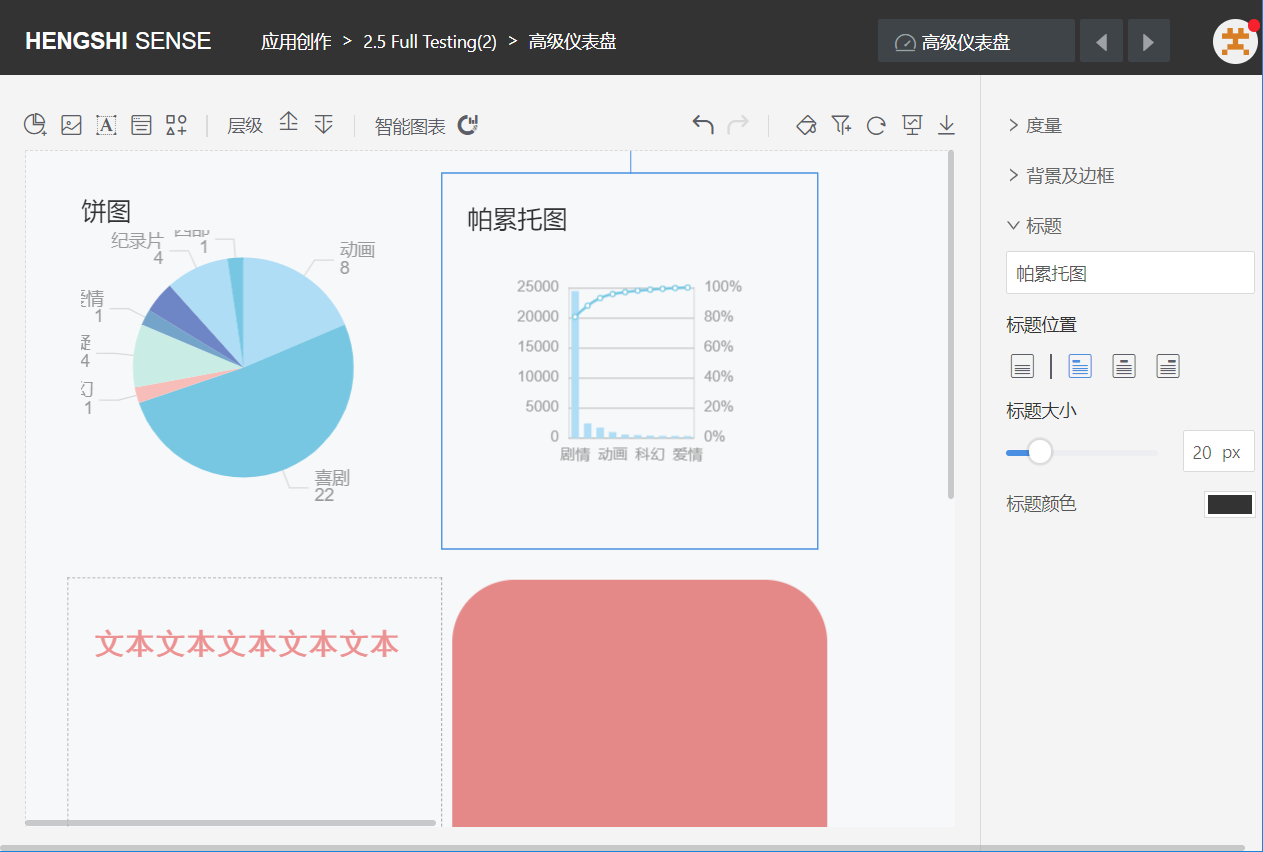
Click the chart, and a chart setting area will appear on the right side where you can make the following settings:
- Metrics
- Background and Border
- Title
Add Image
![]()
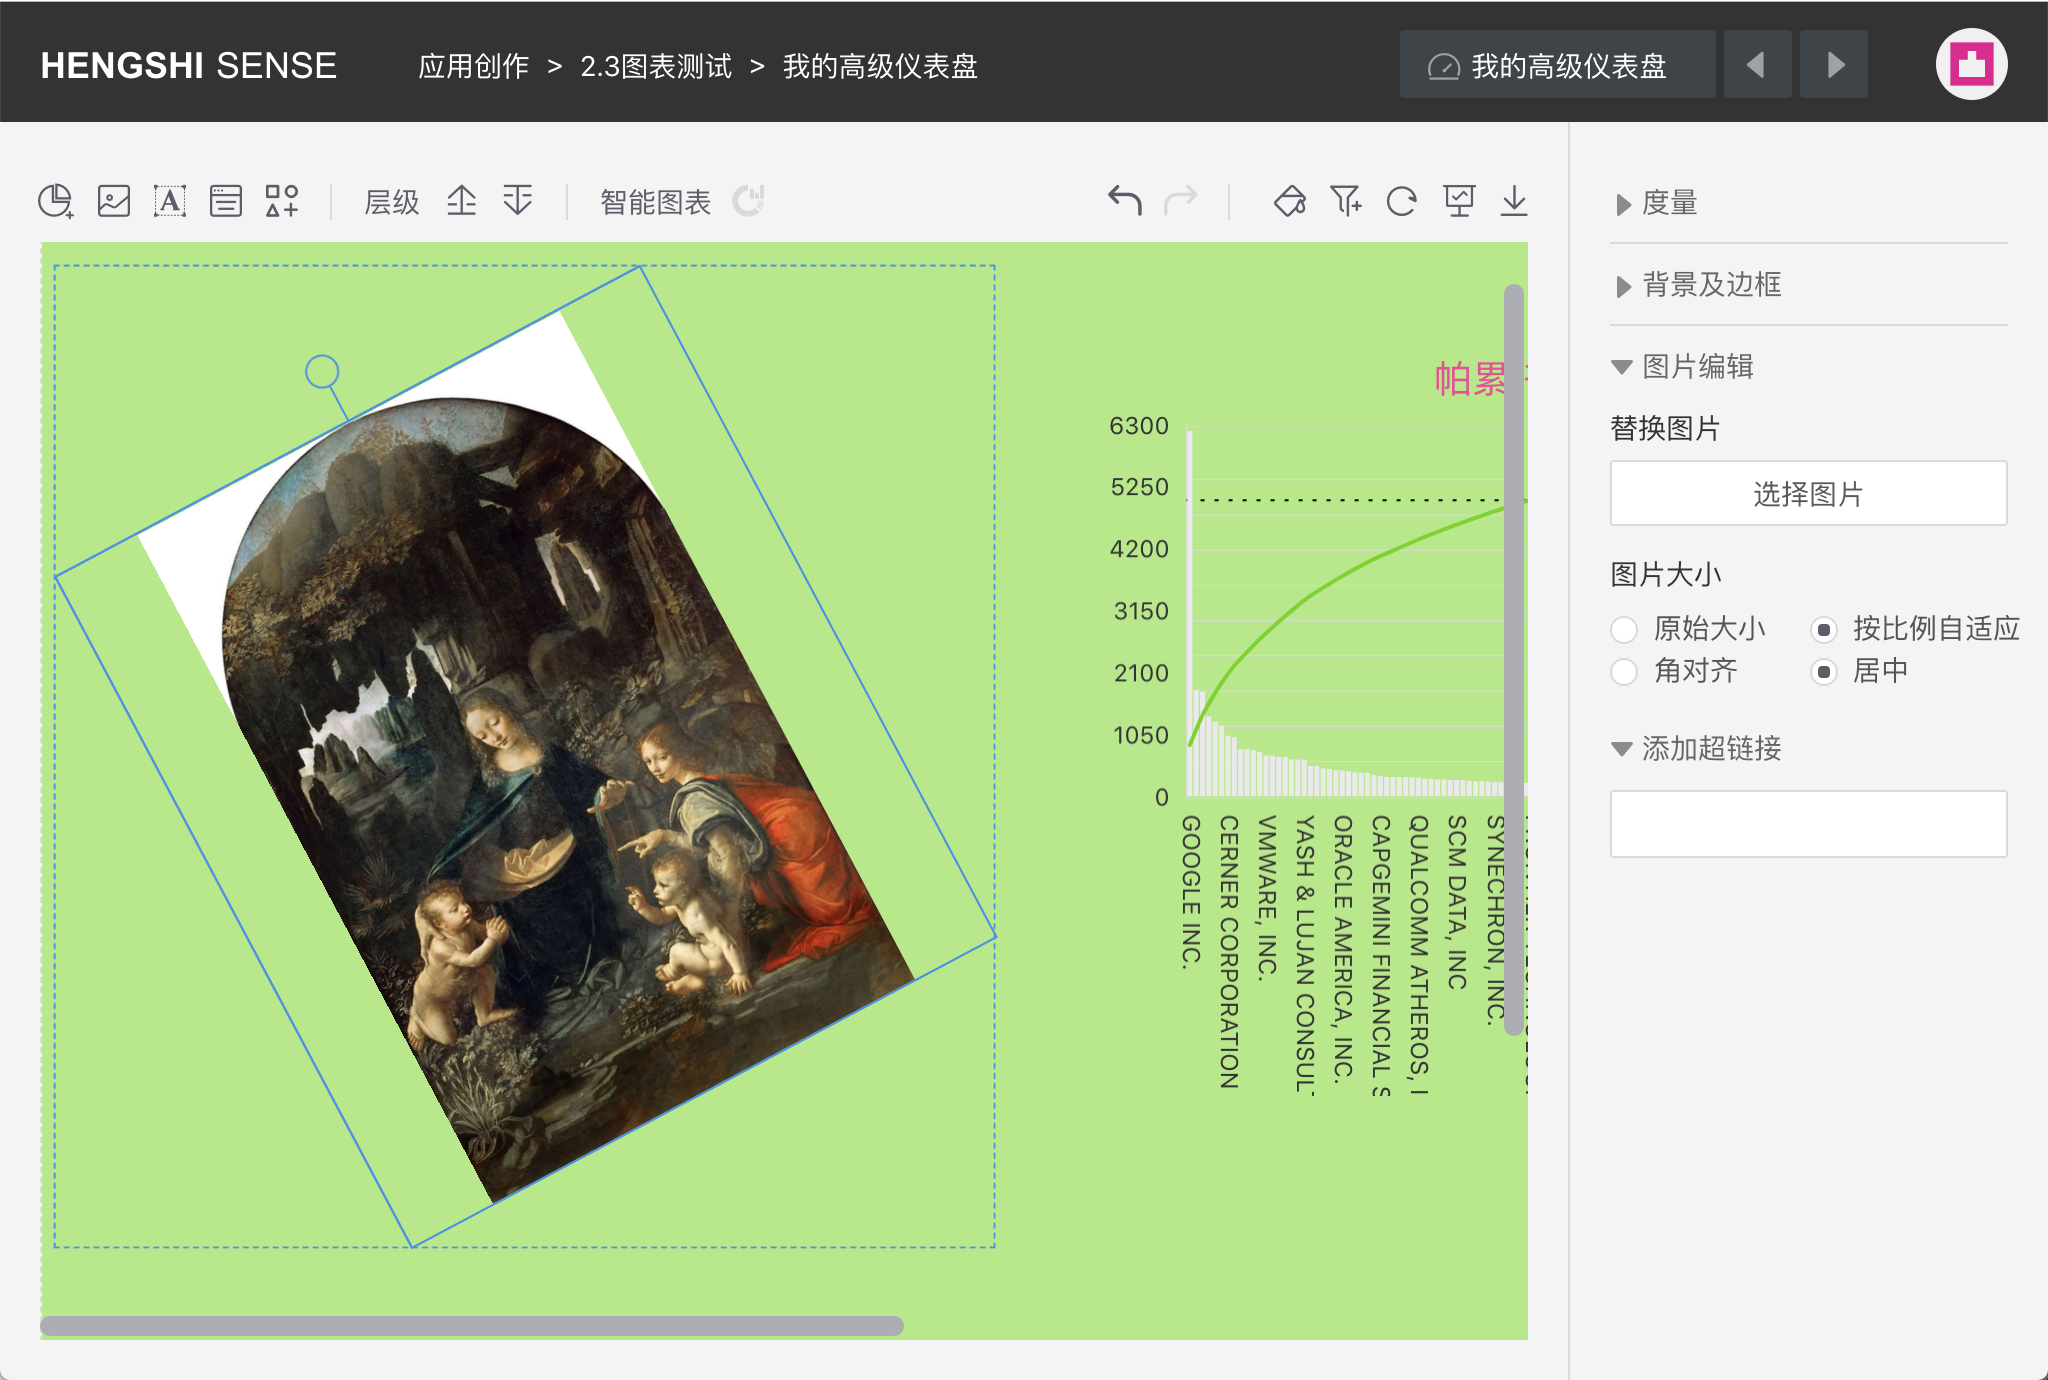
Click the "Add Image" icon, select an image from your local machine to upload. After uploading, you can manually drag to change the size and orientation. You can also configure it via the menu bar on the right, as shown:
Add Text
![]()
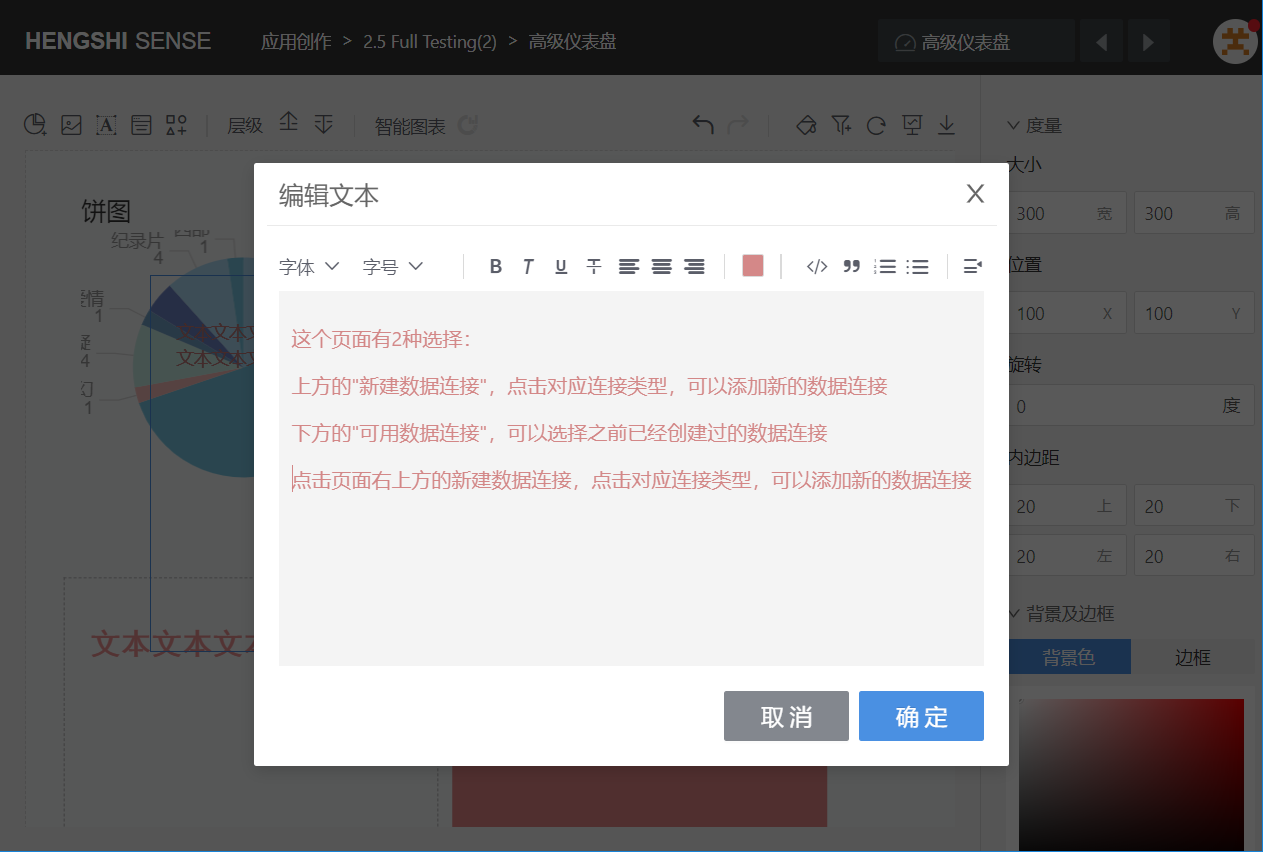
Click the "Add Text" icon, and a text setting window will pop up, as shown below:
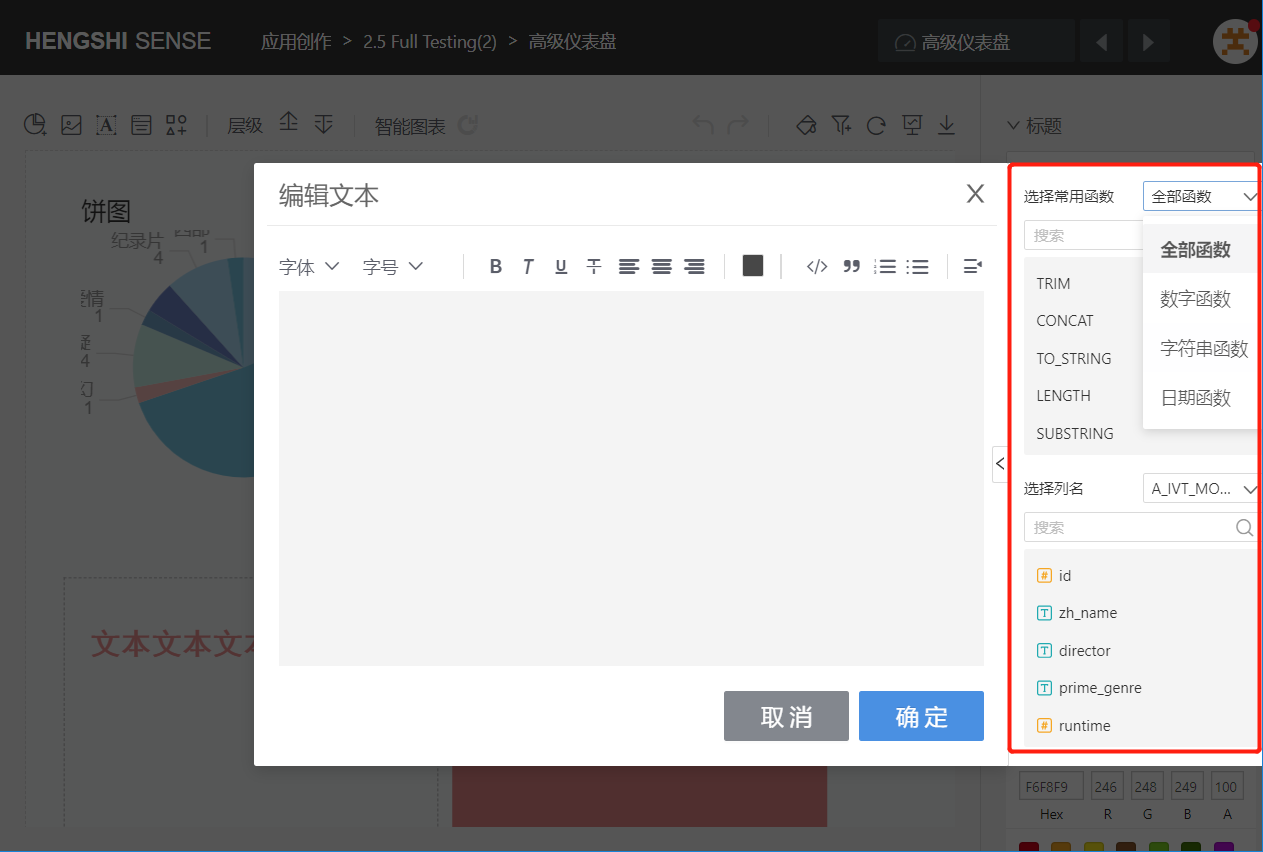
Click the icon on the far right of the text setting window to pop up a new window. In this window, you can select functions (numbers, strings, date functions), choose a dataset, and add text with fields from the dataset.
![]()
Add Webpage
![]()
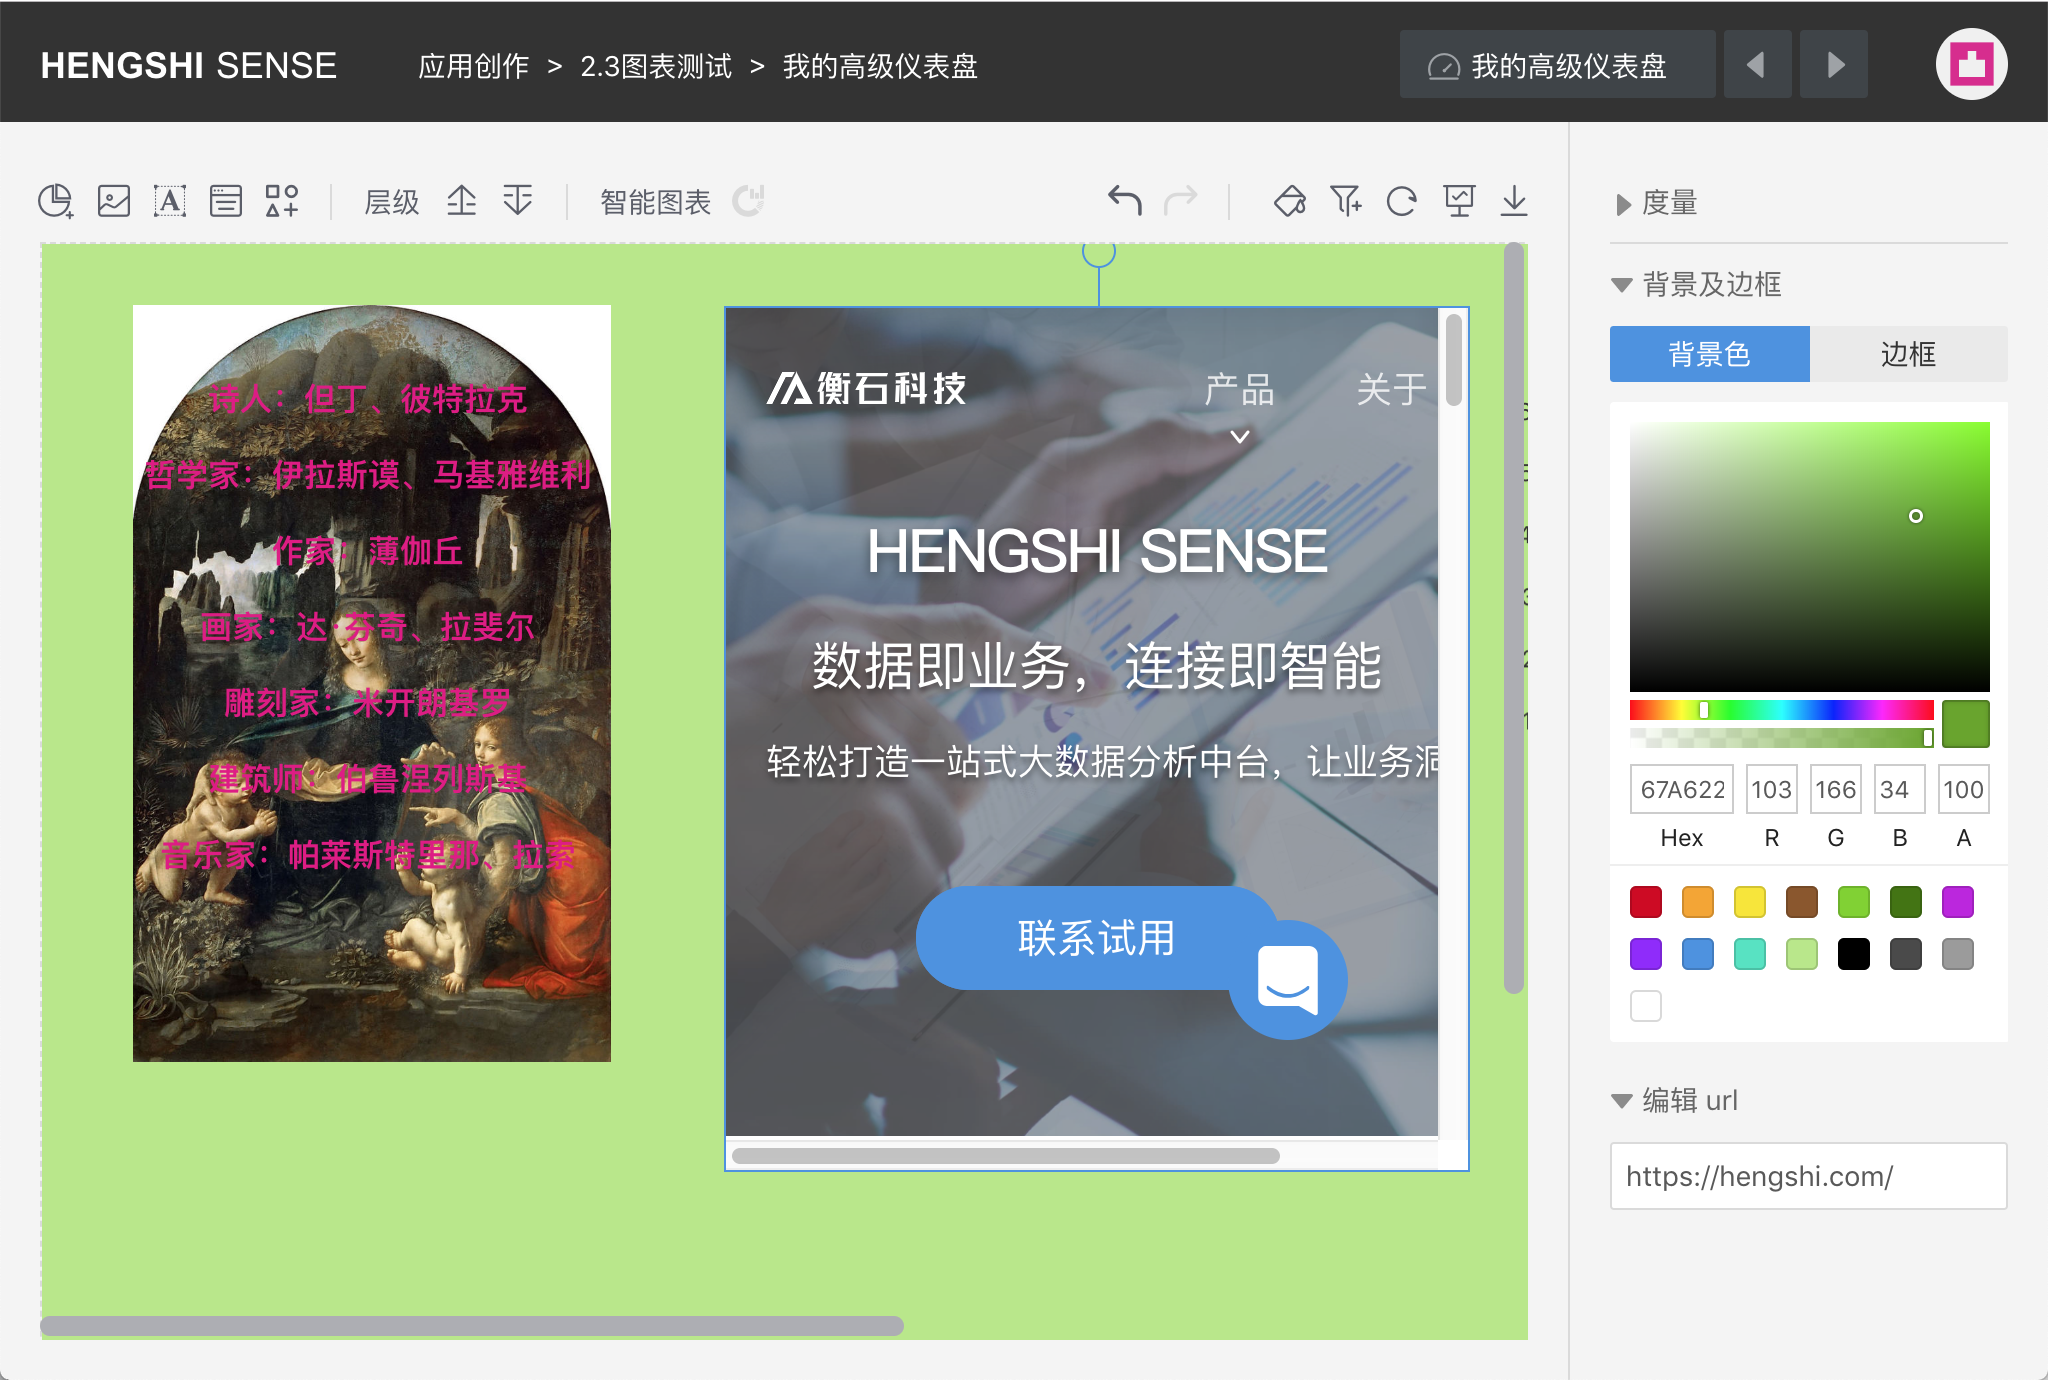
Click the "Add Webpage" icon, a URL setting window will pop up. After entering the URL, the webpage will be displayed on the dashboard, click the webpage, and a webpage setting menu appears on the right, as shown below.
Add Shape
![]()
Click the "Add Shape" icon, and a dropdown list of selectable shapes will appear, from which you can choose:
- Rectangle
- Triangle
- Arrow
- Circle
All shapes can be dragged and rotated, and hyperlinks can be added.
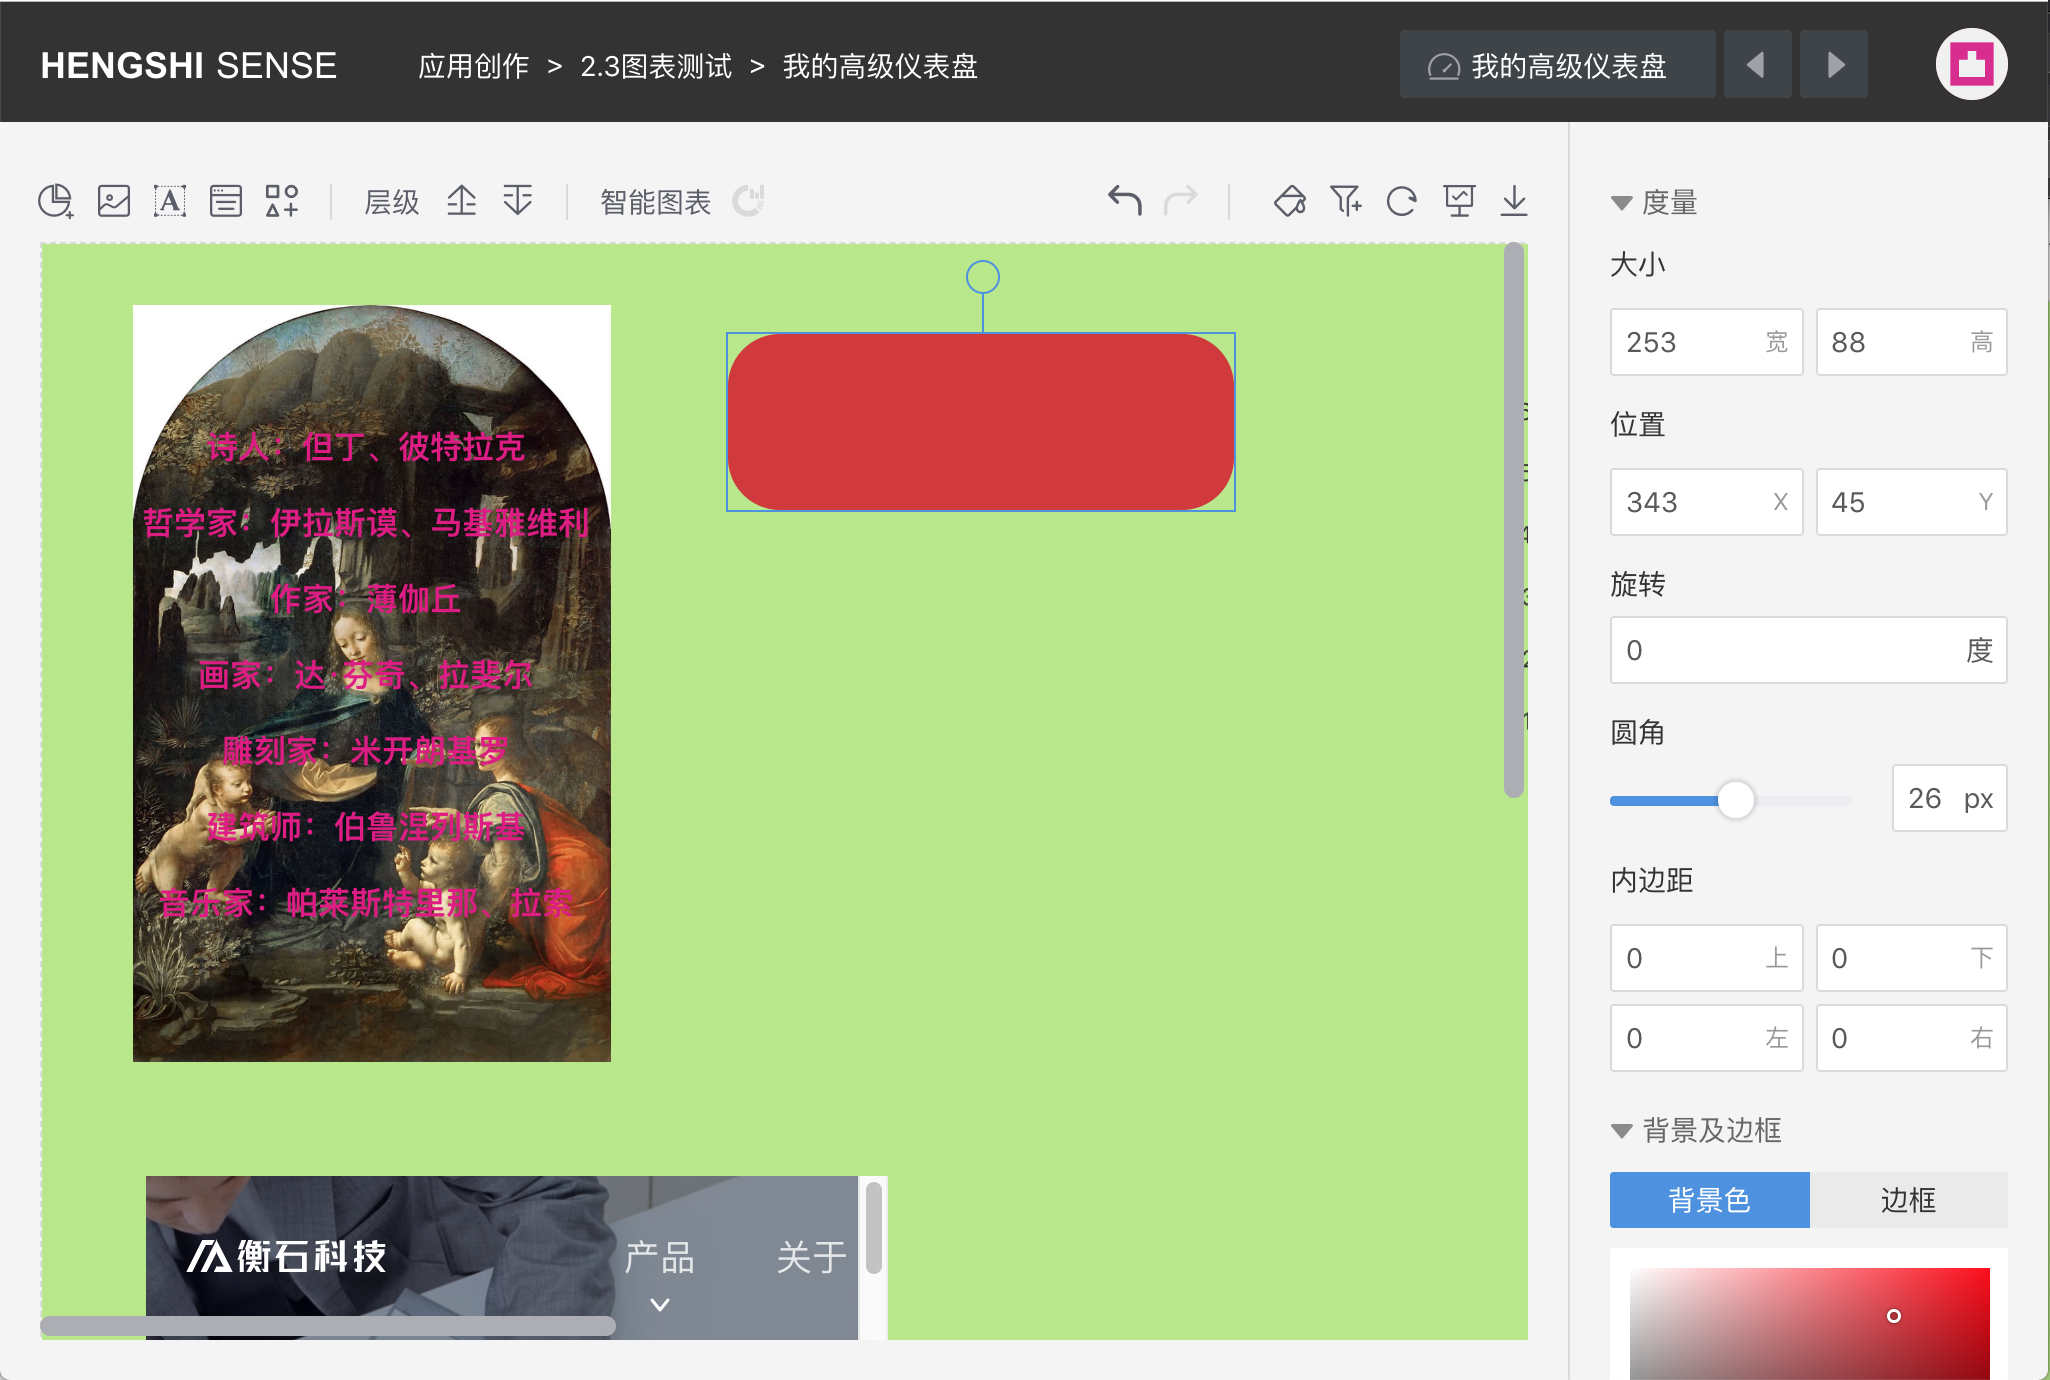
Rectangle
You can set rounded corners for the rectangle.
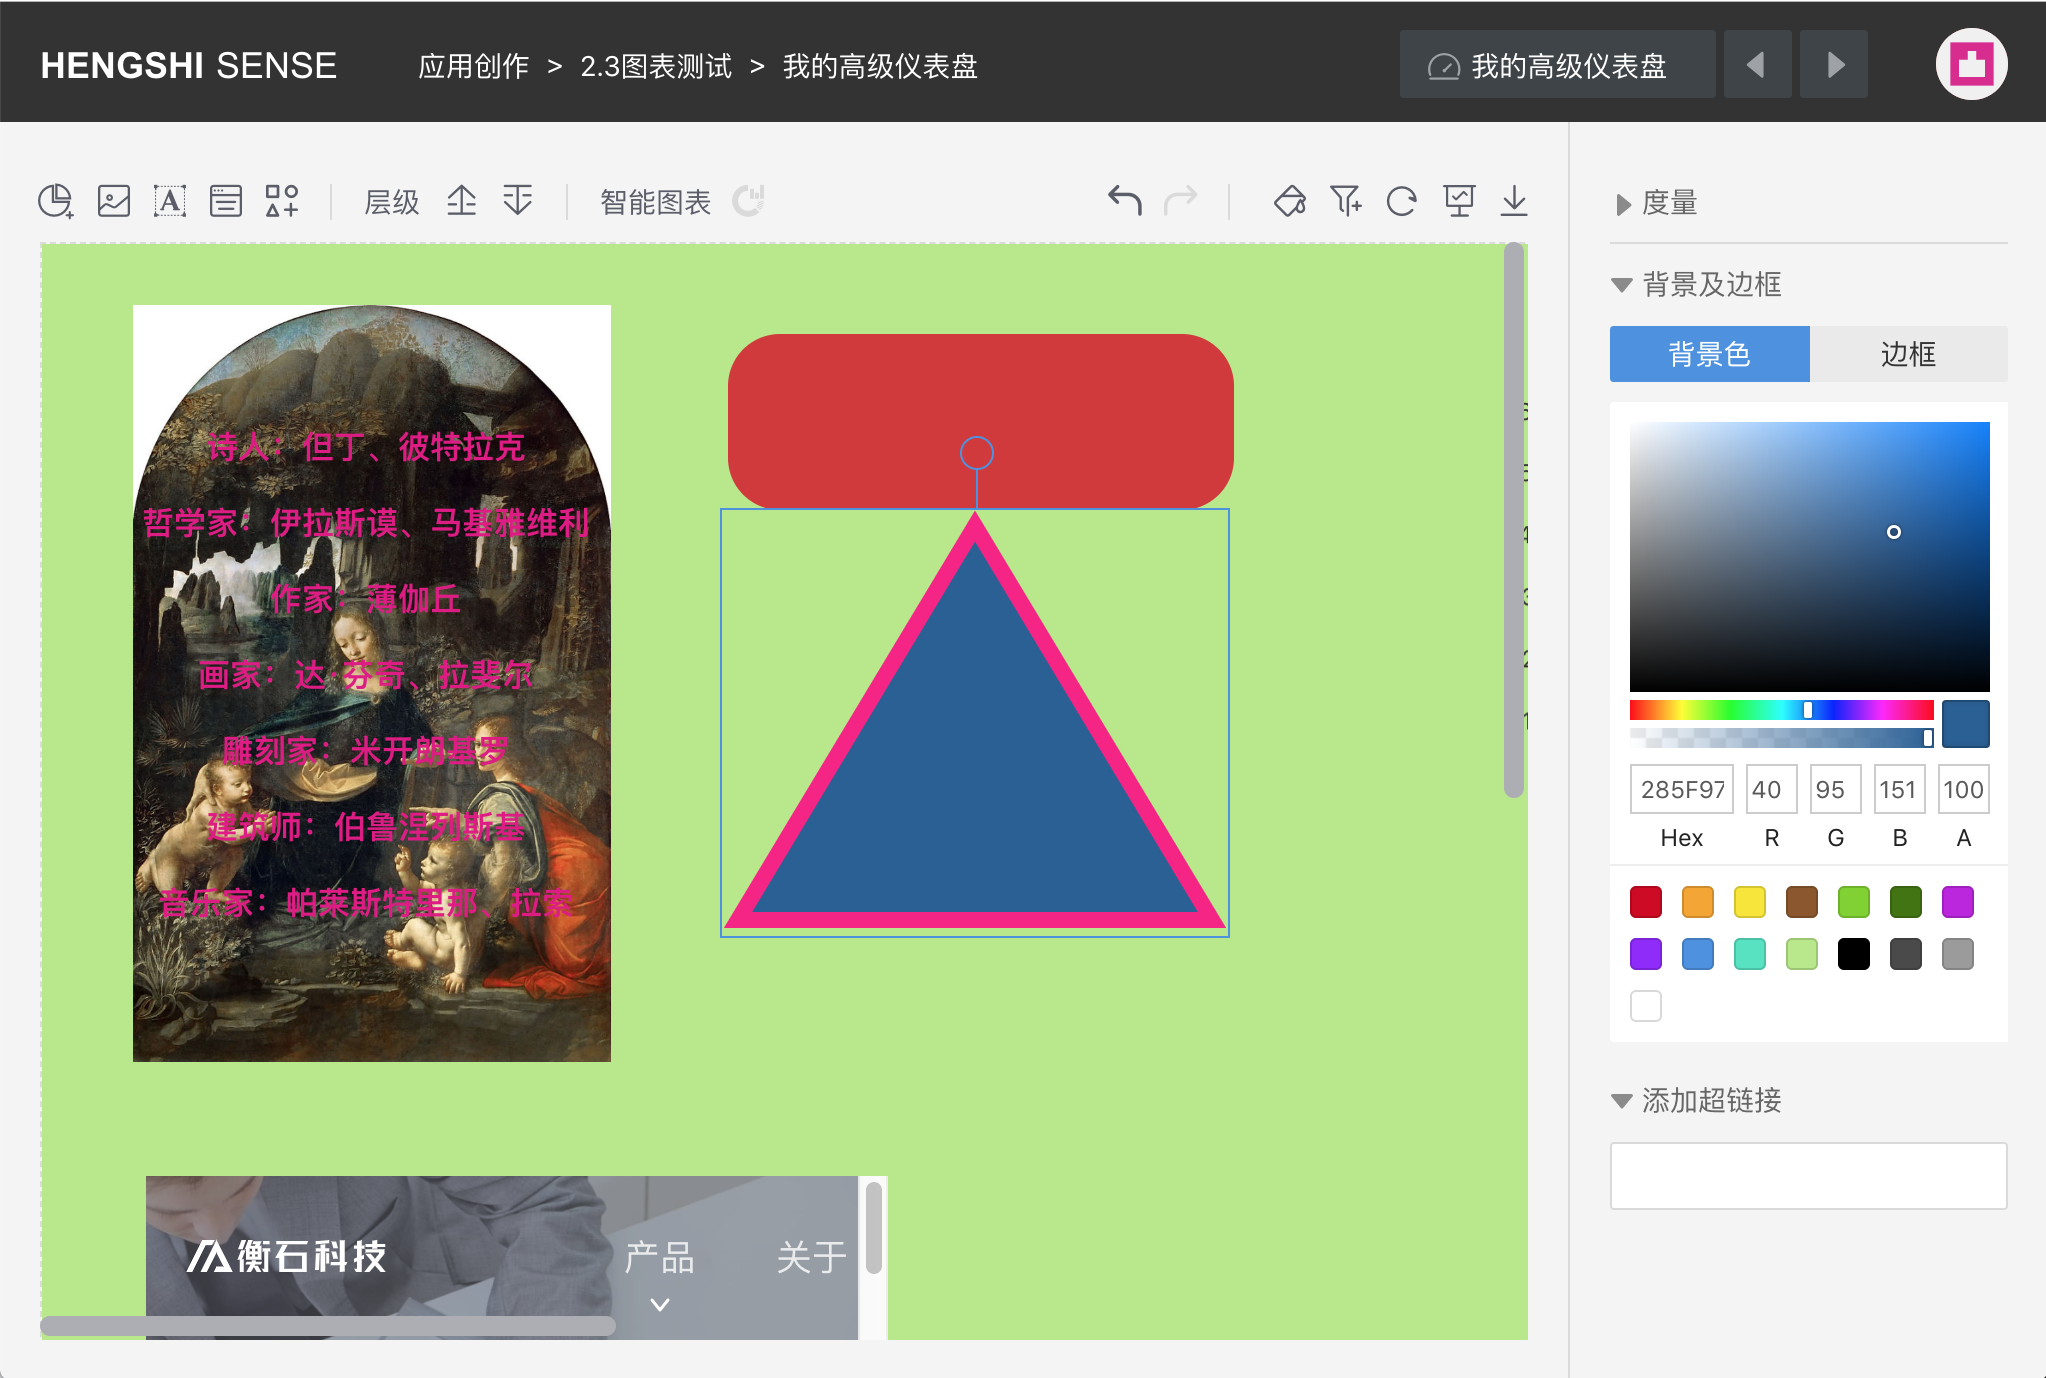
Triangle
Arrow
You can choose the shapes of the start and end points of the arrow.
![]()
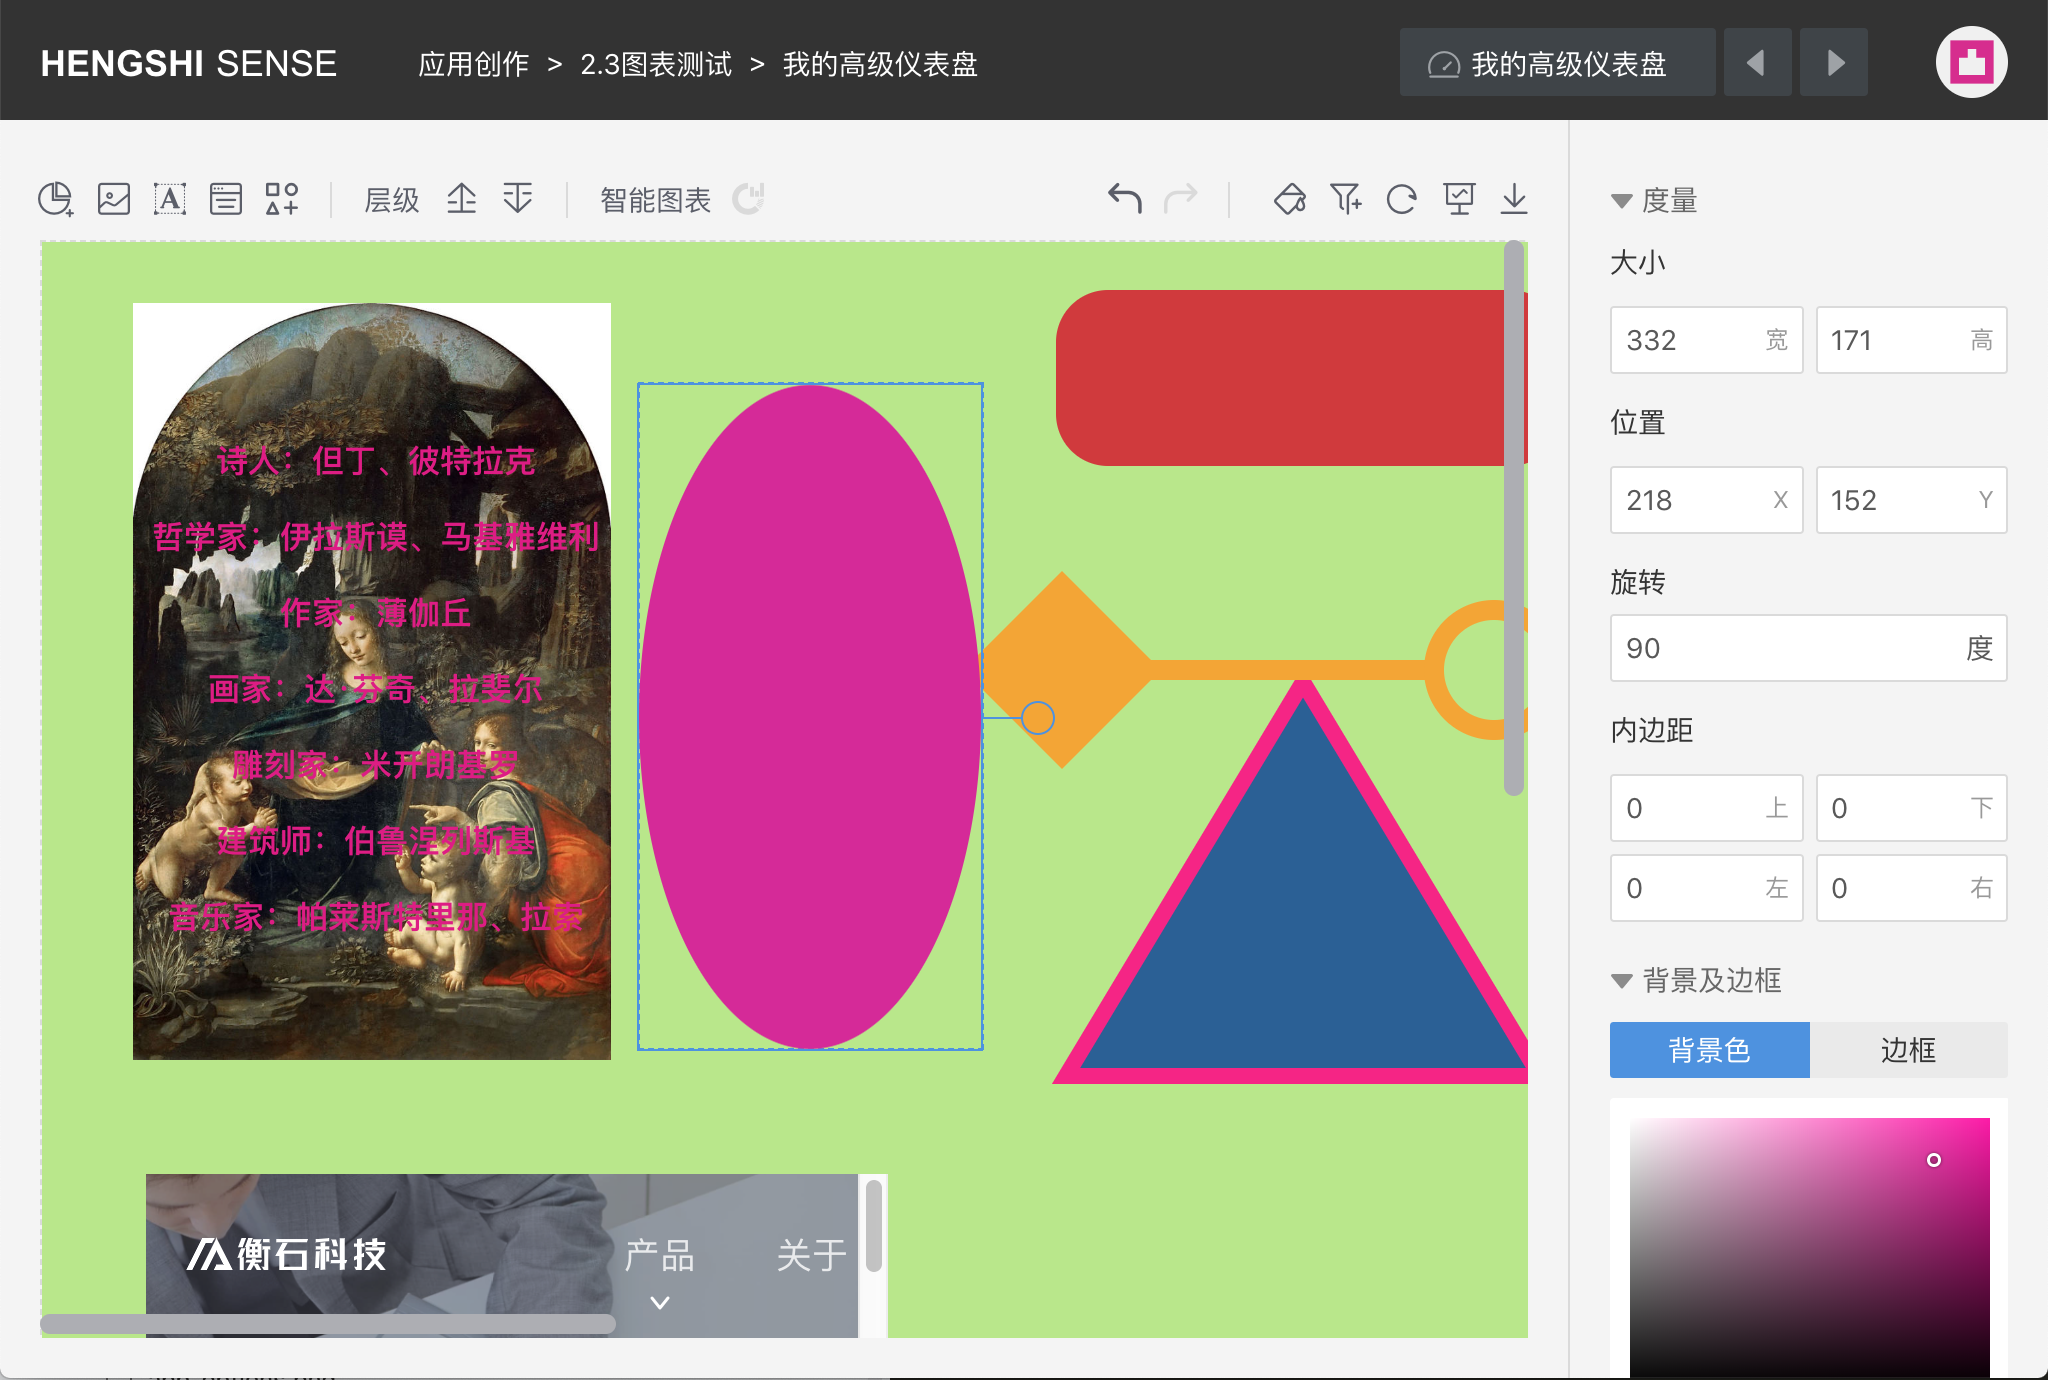
Circle
You can drag to make it an ellipse.
Layer Forward/Backward
![]()
Select an element and click forward or backward to place the layer above or below other elements.
Smart Chart
![]()
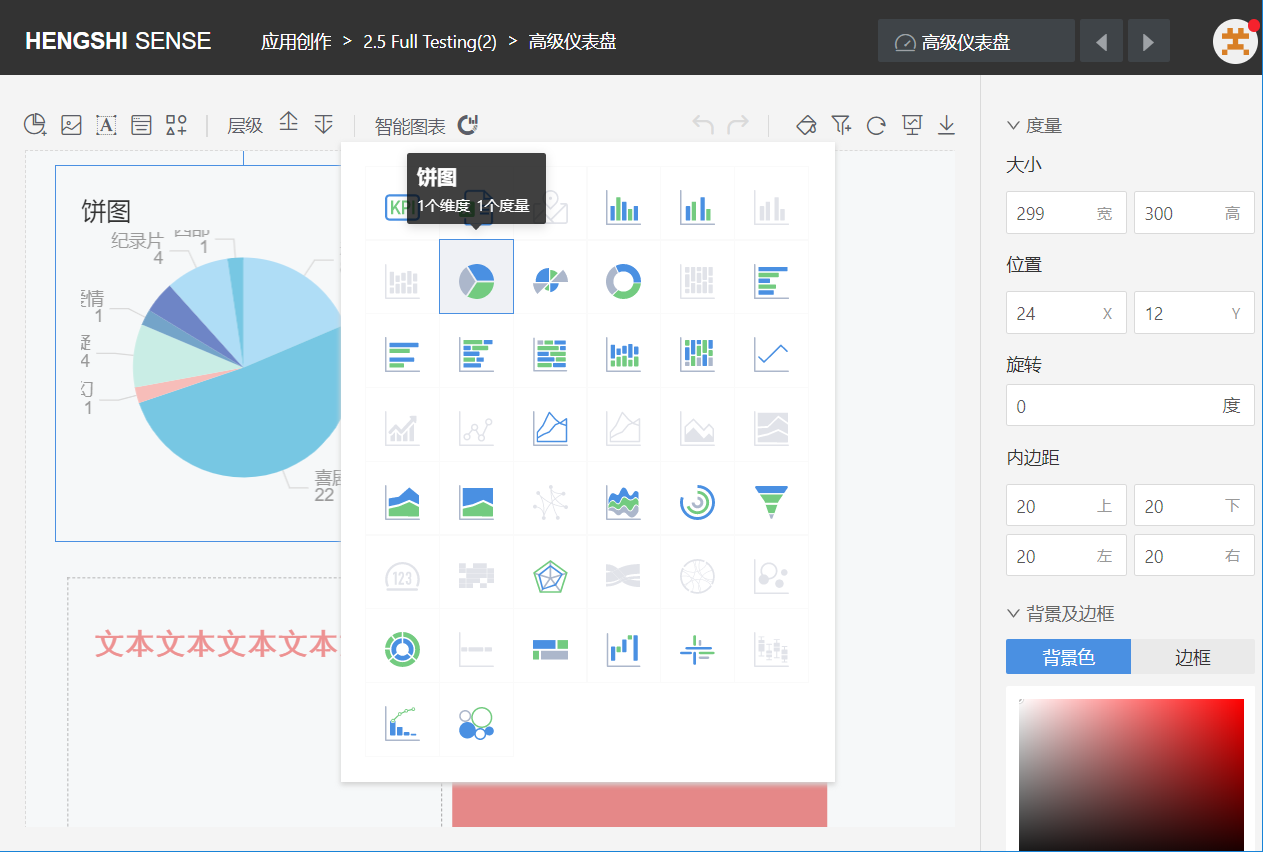
Select a chart, then click the "Smart Chart" icon. A popup will display all chart icons; those which can be switched to are enabled, and those which cannot be switched to are disabled. Hovering over an icon will tip you about the number of dimensions and metrics required for that chart. Select one of the switchable chart icons, and the chart below will change accordingly.
Top Right Menu
Undo/Redo
![]()
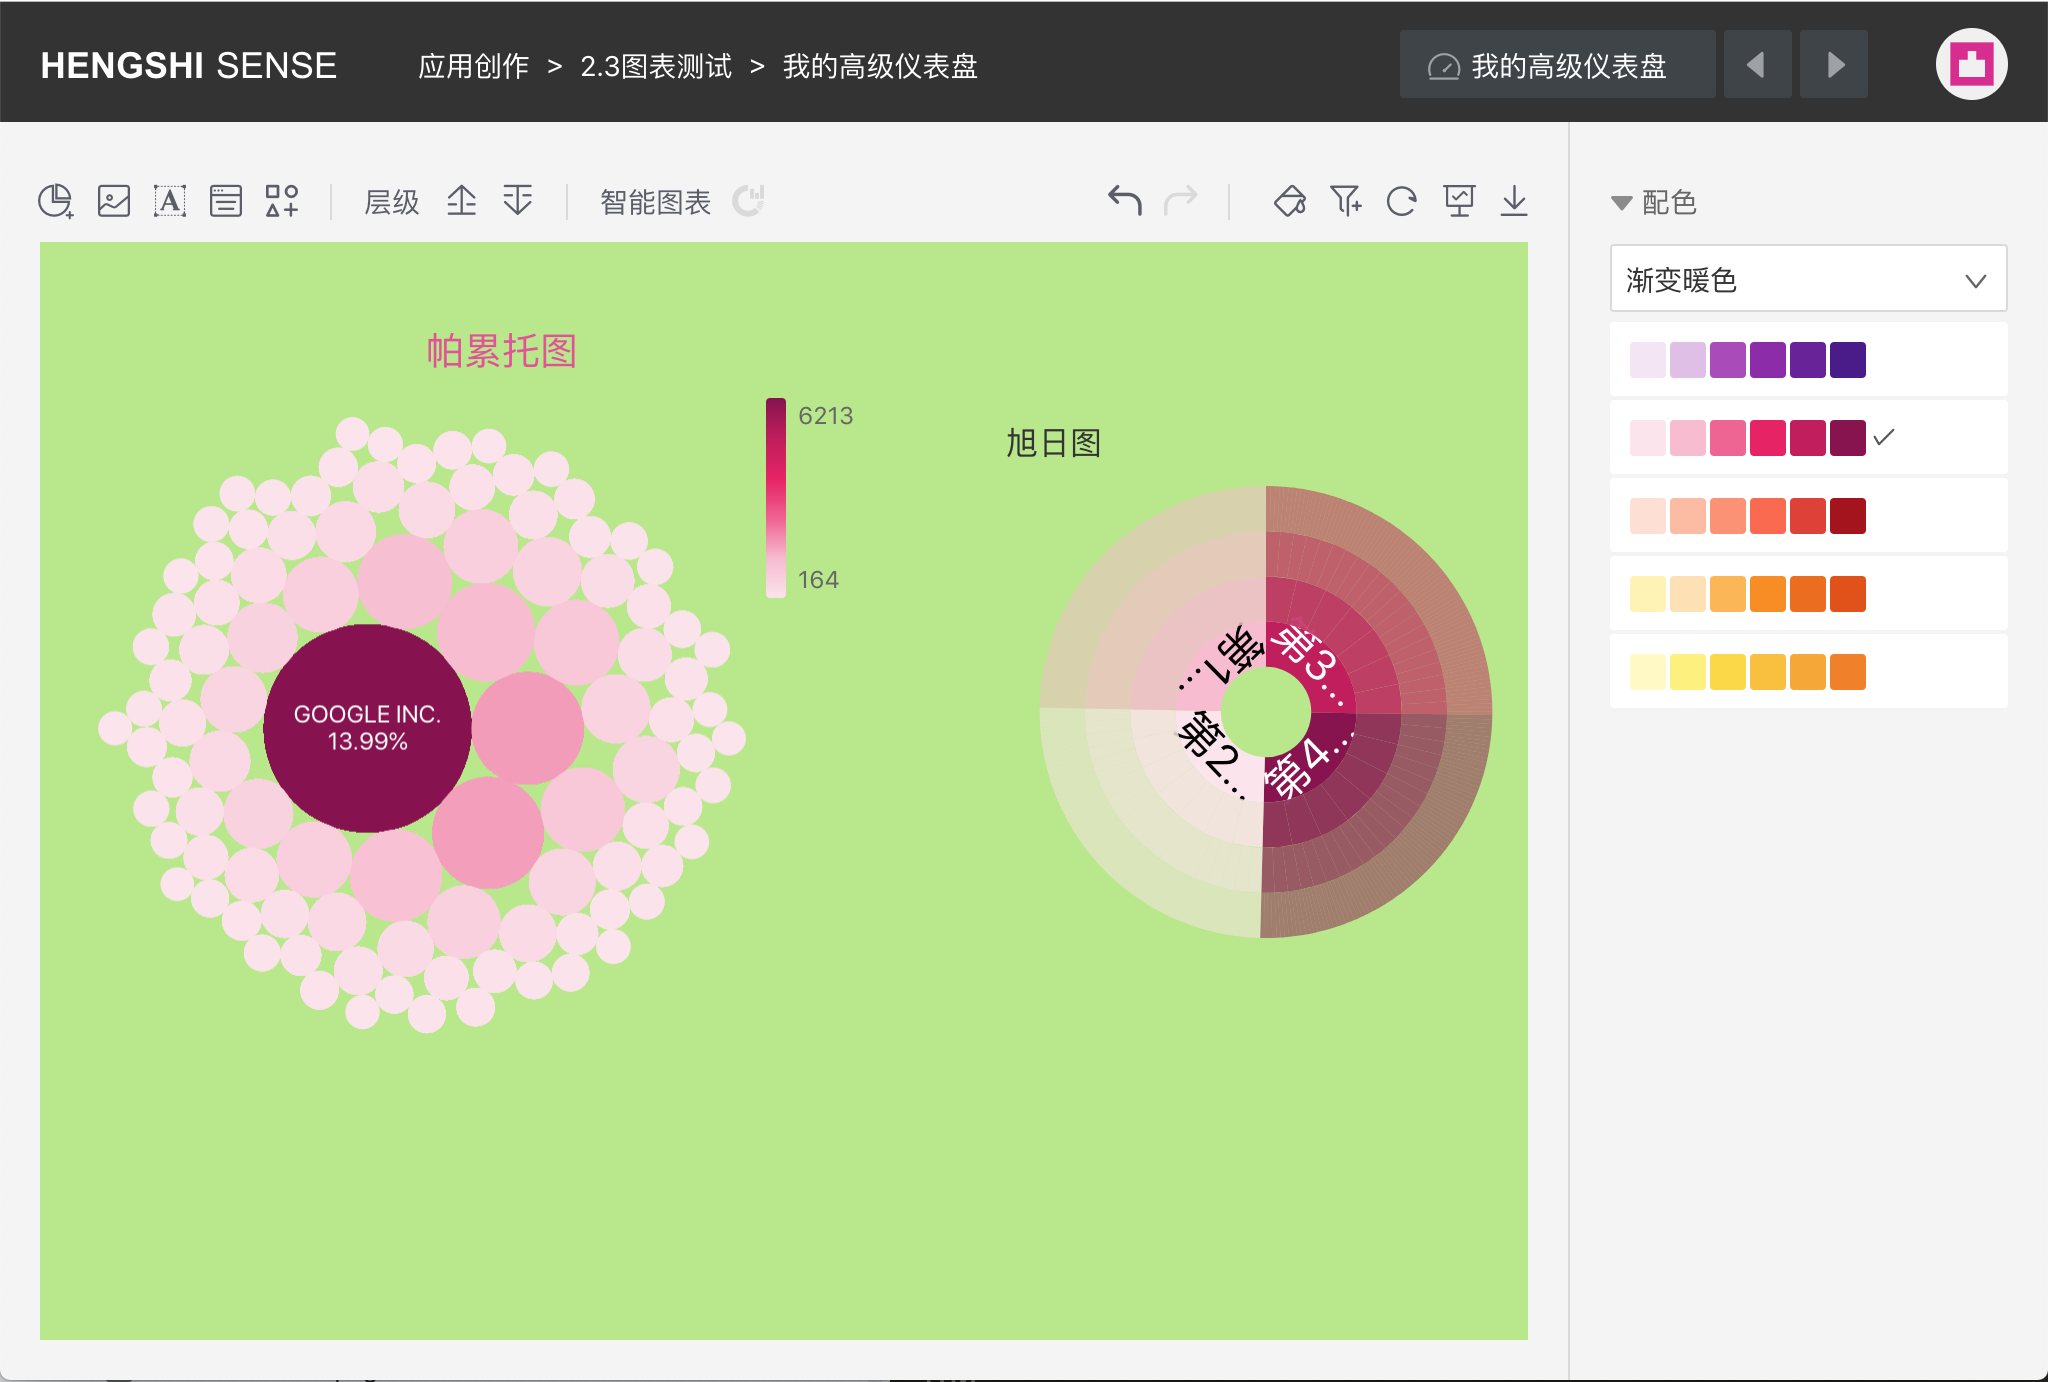
Coloring
![]()
Click the "Coloring" icon, and a coloring configuration area will appear on the right. You can choose from a variety of colors from various color schemes.

Add Filter
![]()
The filters added here are the same as those in standard dashboards.
Refresh
![]()
Refresh dashboard chart data.
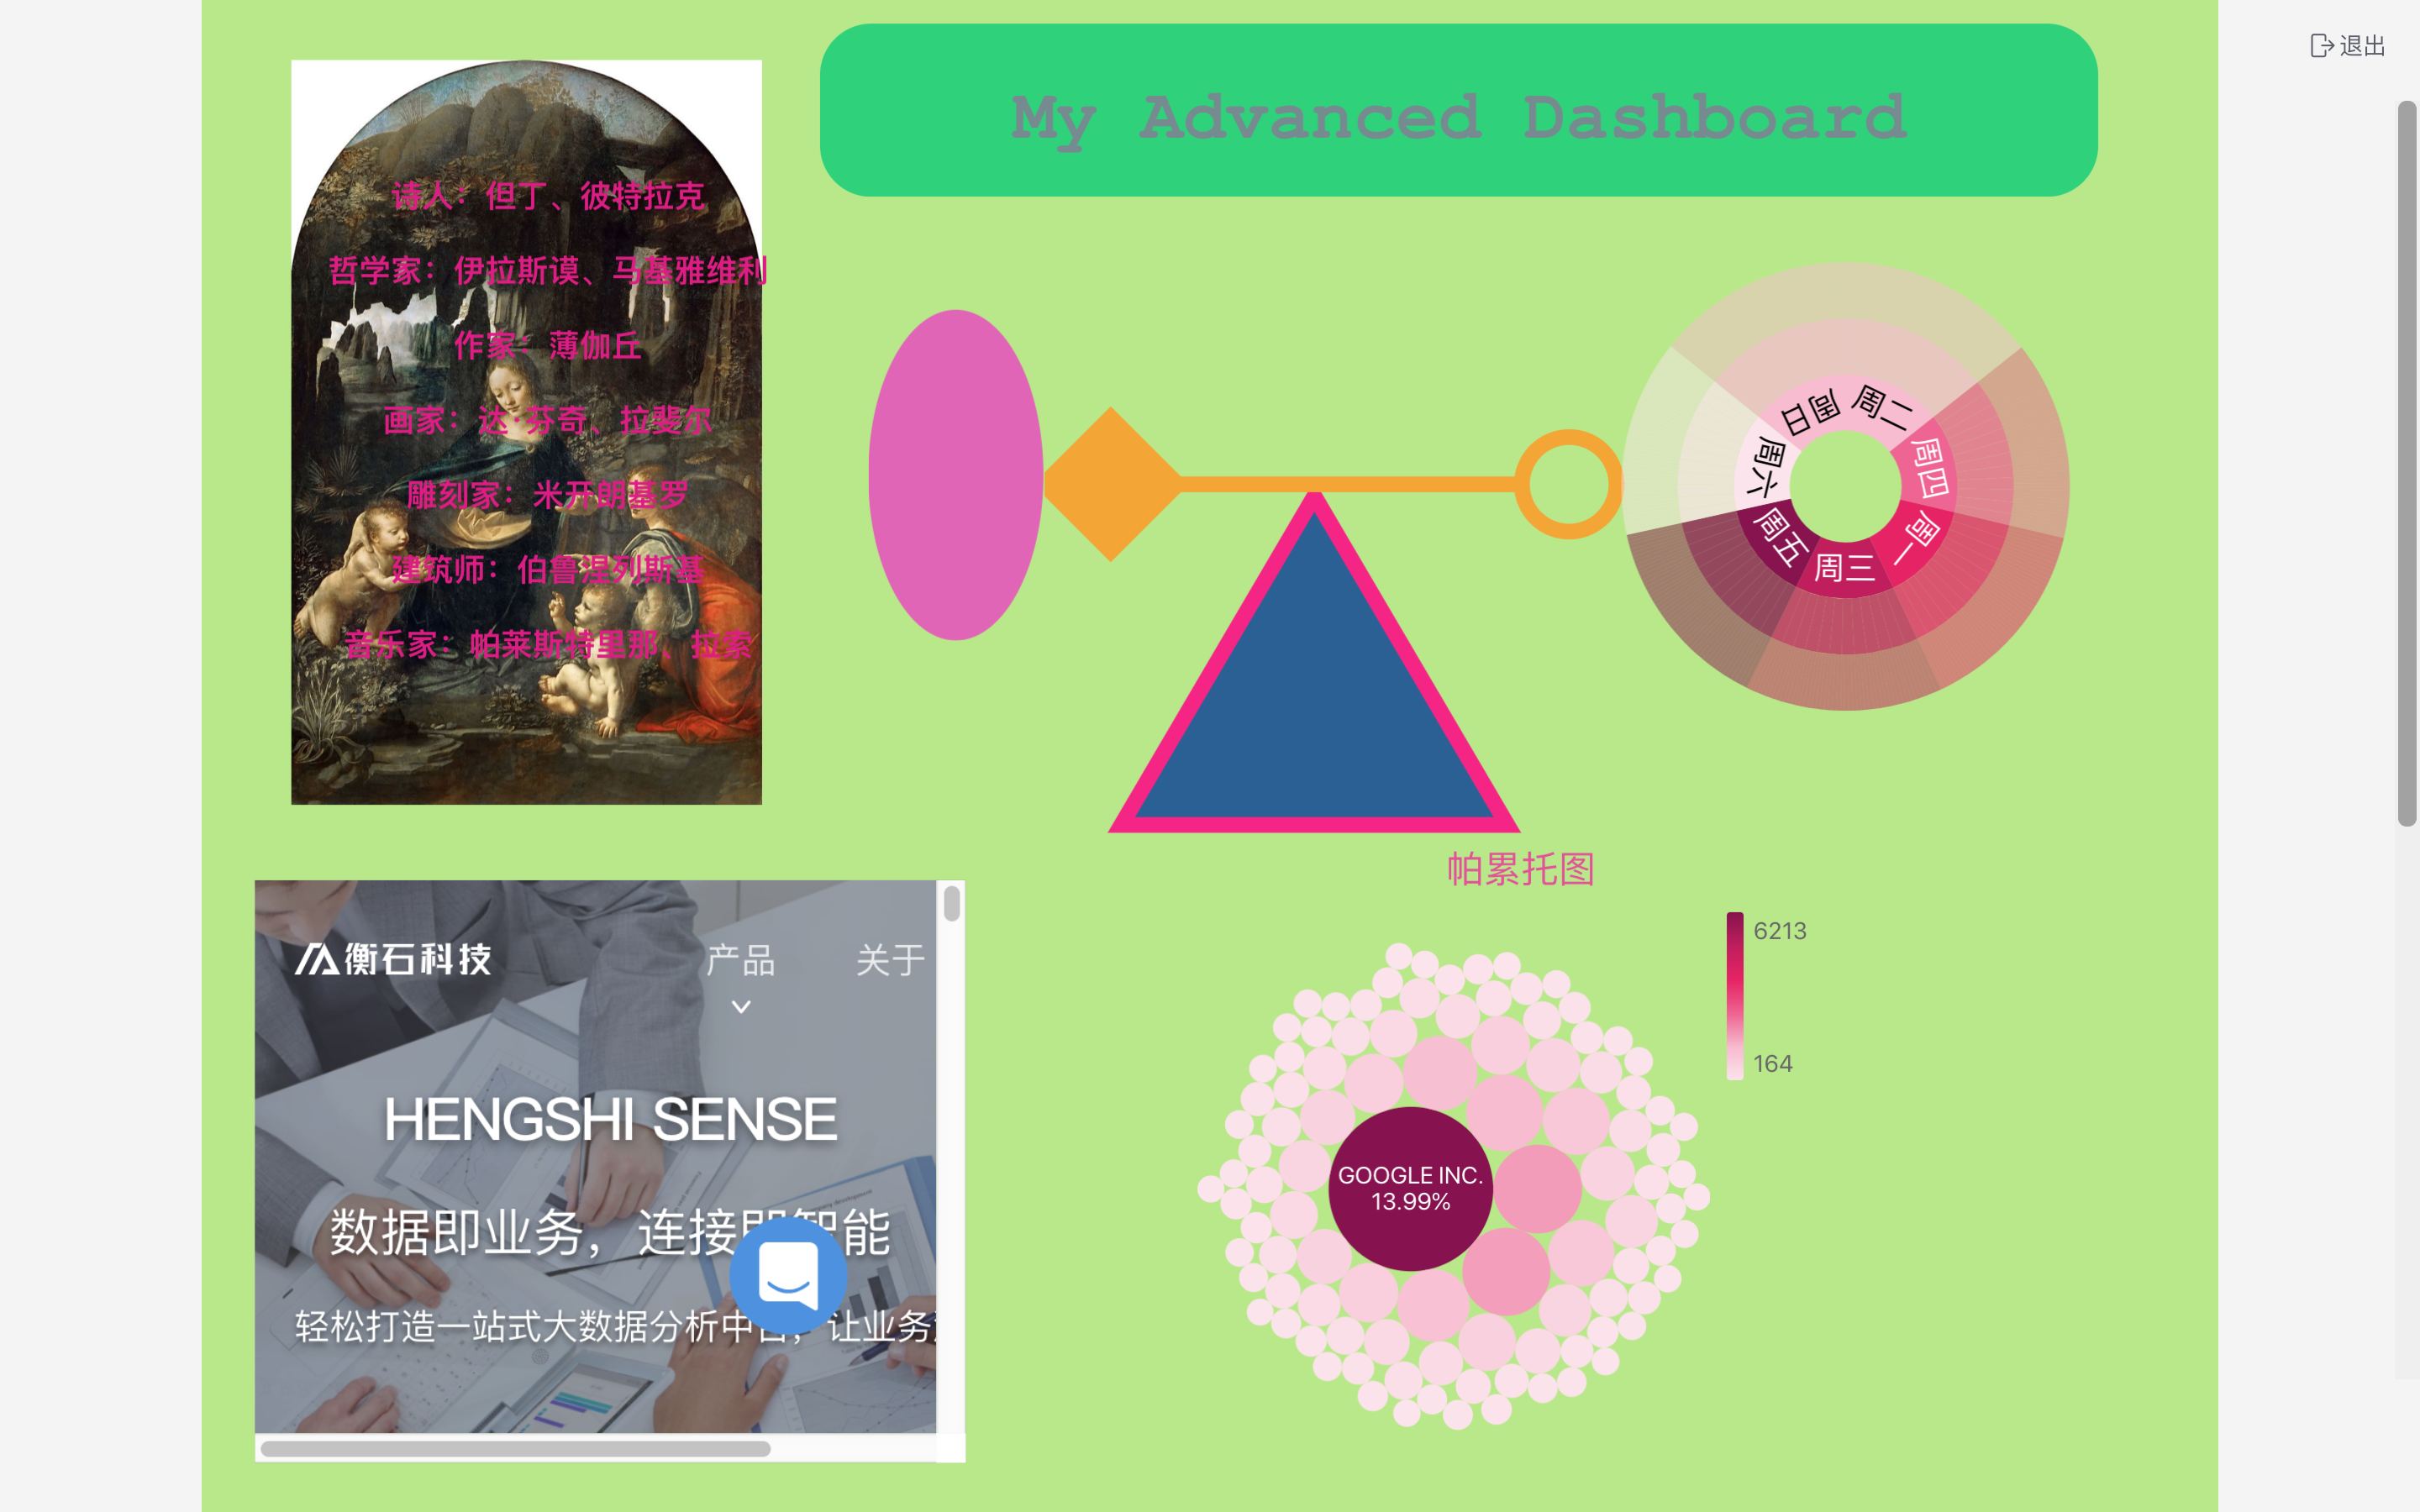
Preview
![]()
Click "Preview" to enter full-screen preview mode. Clicking on a shape with a URL added will jump to the corresponding webpage.
Press Esc or click "Exit" to exit full-screen mode.
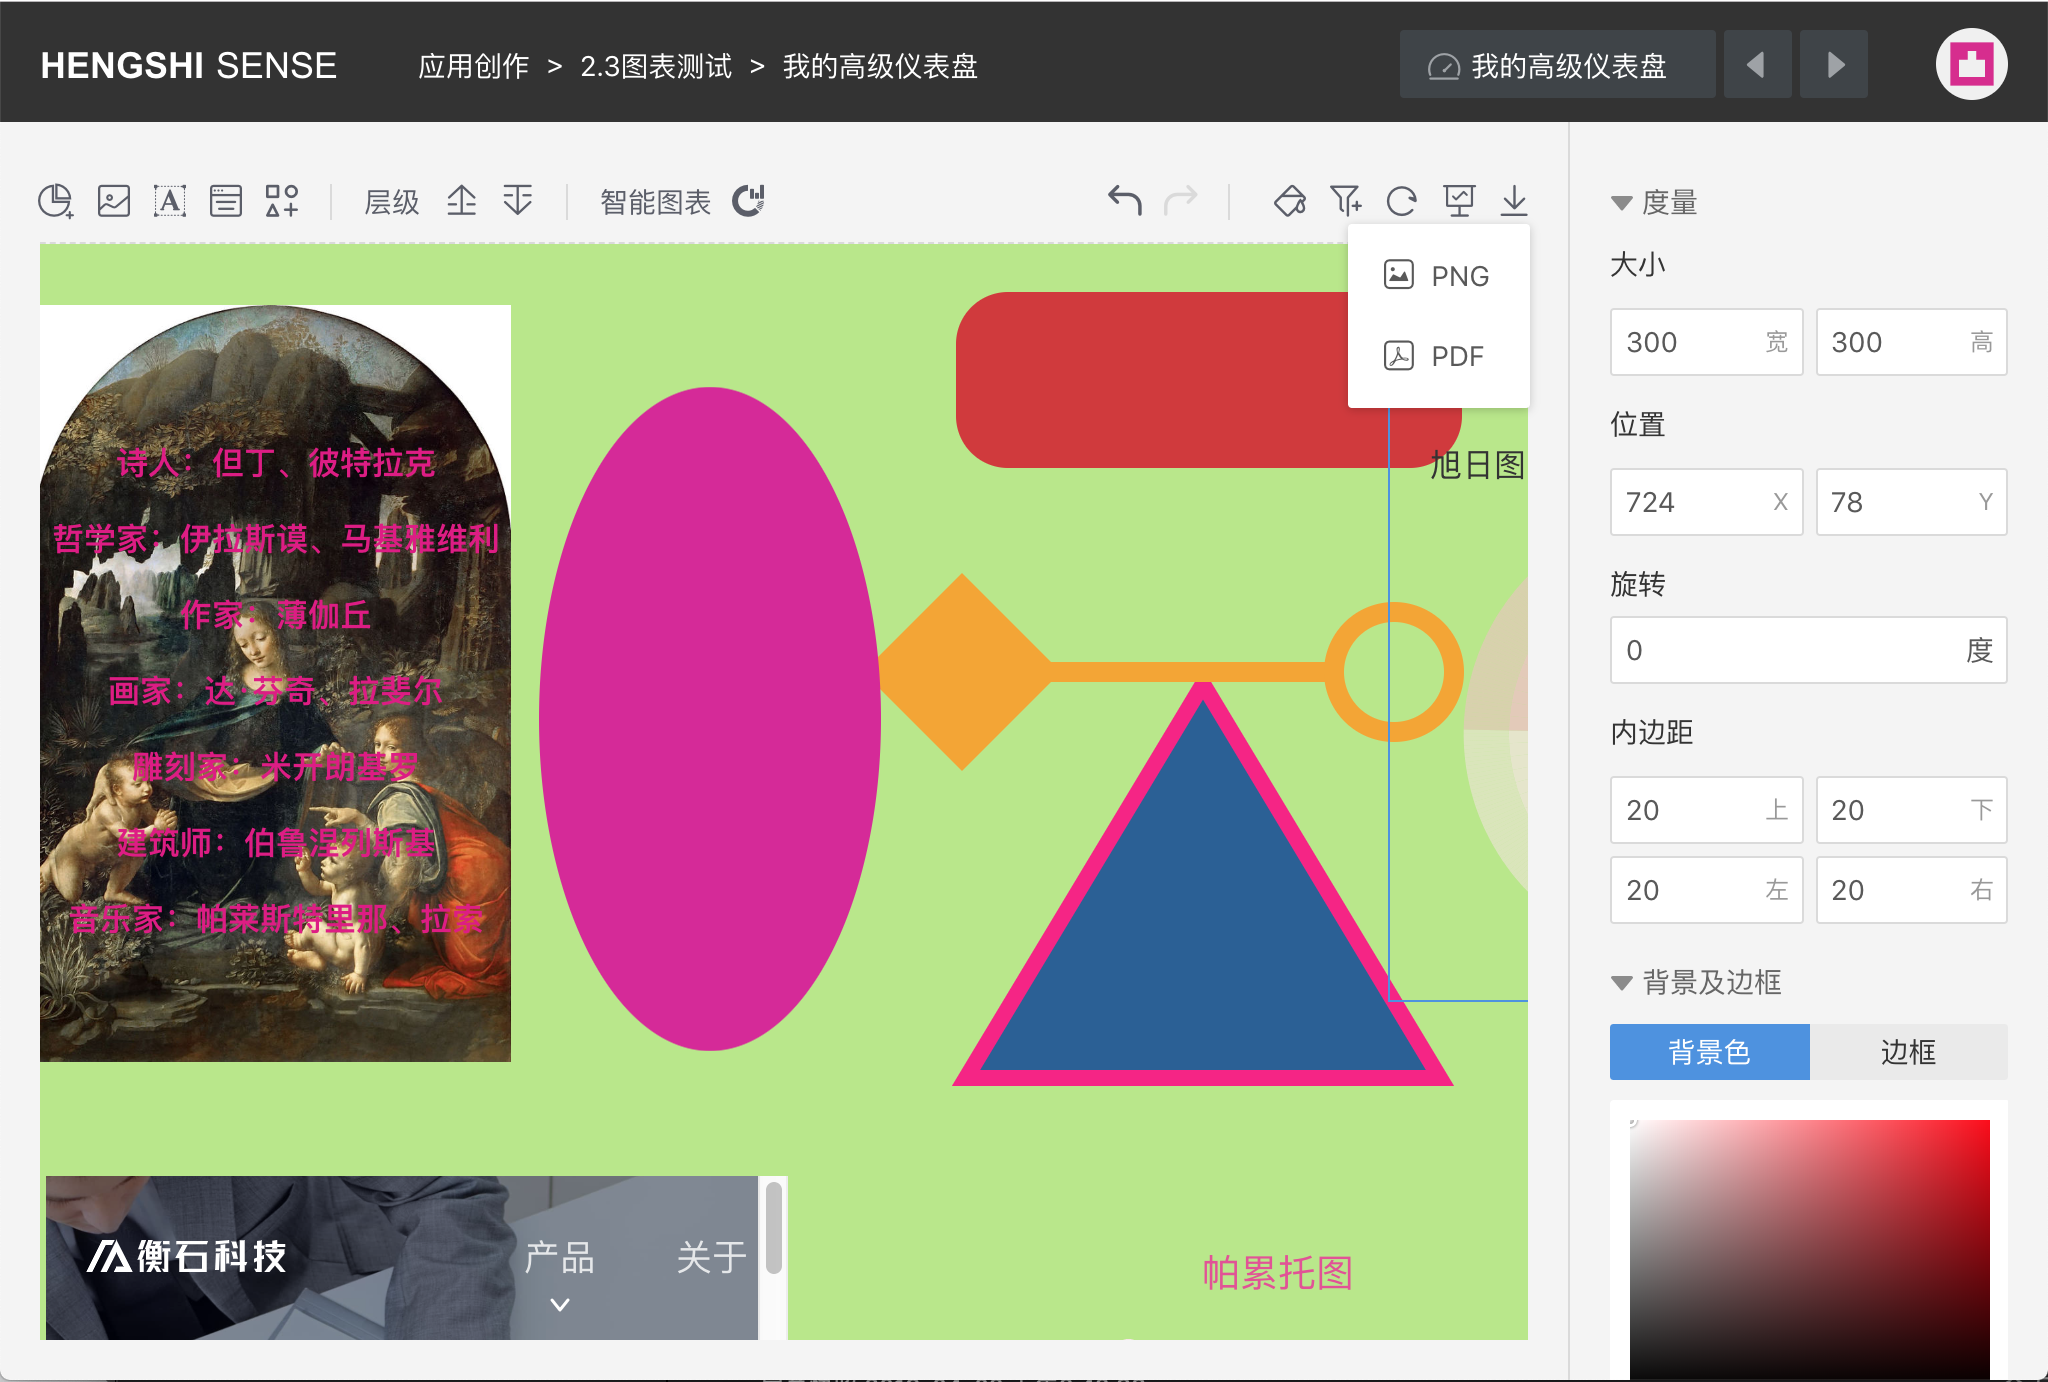
Export Dashboard
![]()
Click "Export" to export the dashboard as PDF or PNG.
Set Element Styles
Click to select each element, and the setting menu for that element will appear on the right side of the window.
You can also drag each element to adjust the layout, shape, size, and orientation.
Shortcuts
- Command(⌘)/Ctrl + Shift + j/k/l/i/m/b: Aligns selected multiple elements as a group based on the canvas.
- Alt/Options + j/k/l/i/m/b: Aligns selected multiple elements as a group based on the group.
- Supports copying and pasting selected multiple elements. Charts do not support cross-application, cross-domain copy and paste, images do not support cross-domain copy, other types of elements support cross-application, cross-domain copying.
- Supports direct pasting of images and text.
- Supports deleting selected multiple elements, but chart elements need to be deleted separately.
Windows
| Action | Shortcut |
|---|---|
| Redo | Ctrl + y |
| Delete | Backspace |
| Undo | Ctrl + z |
| Save | Ctrl + s |
| Copy | Ctrl + c |
| Paste | Ctrl + v |
| Left Align | Ctrl + j |
| Center Horizontally | Ctrl + k |
| Right Align | Ctrl + l |
| Top Align | Ctrl + i |
| Center Vertically | Ctrl + m |
| Bottom Align | Ctrl + b |
| Move Element 1px | Arrow keys (Up, Down, Left, Right) |
| Move Element 10px | Shift + Arrow keys (Up, Down, Left, Right) |
Mac
| Action | Shortcut |
|---|---|
| Redo | Command(⌘) + y |
| Delete | Delete |
| Undo | Command(⌘) + z |
| Save | Command(⌘) + s |
| Copy | Command(⌘) + c |
| Paste | Command(⌘) + v |
| Left Align | Command(⌘) + j |
| Center Horizontally | Command(⌘) + k |
| Right Align | Command(⌘) + l |
| Top Align | Command(⌘) + i |
| Center Vertically | Command(⌘) + m |
| Bottom Align | Command(⌘) + b |
| Move Element 1px | Arrow keys (Up, Down, Left, Right) |
| Move Element 10px | Shift + Arrow keys (Up, Down, Left, Right) |
| Full Screen | Command(⌘) + Ctrl + f |