Hengshi Documentation
Table of Contents generated with DocToc
Data Model
A data model, or an associative relationship model, allows the creation of join or union relationships between data sets, and incorporates these relationships during chart creation. Compared with creating a fusion data set to establish a wide table, the data model has the following advantages:
- The ability to edit the associative relationships within the model at any time, with new model relationships immediately impacting analytical results
- The retention of detailed original data set information, avoiding loss of original data due to joins
- No redundant data storage
HENGSHI SENSE 3.2 has enhanced data models in several ways, including:
- Support for data set appending, like adding new sales data every month
- Support for data set reuse: In one data model, a data set can be dragged in multiple times to establish different associative relationships, enabling data set self-association and the extension of a single dictionary table into a hierarchical structure
- Support for creating metrics across data sets: Model tables can use associated data sets to create metrics
- Association conditions support expressions: Users are allowed to freely write association conditions, such as fuzzy matching, etc.
At the same time, new concepts are introduced:
- Model table: Select a data set and build various relationships around it; this data set is called the model table.
- Associated table: The data set that establishes an associative relationship with the model table in the data model.
When a data set participates in the associative relationships of other model tables, its identity is "associated table," and within its own data model, its identity is "model table." When selecting a data set for charting, the entire data model with that data set as the model table is brought in.
Only supports building a data model with data sets under the same connection from the same source.
A chart can only use one data model and cannot chart across data models.
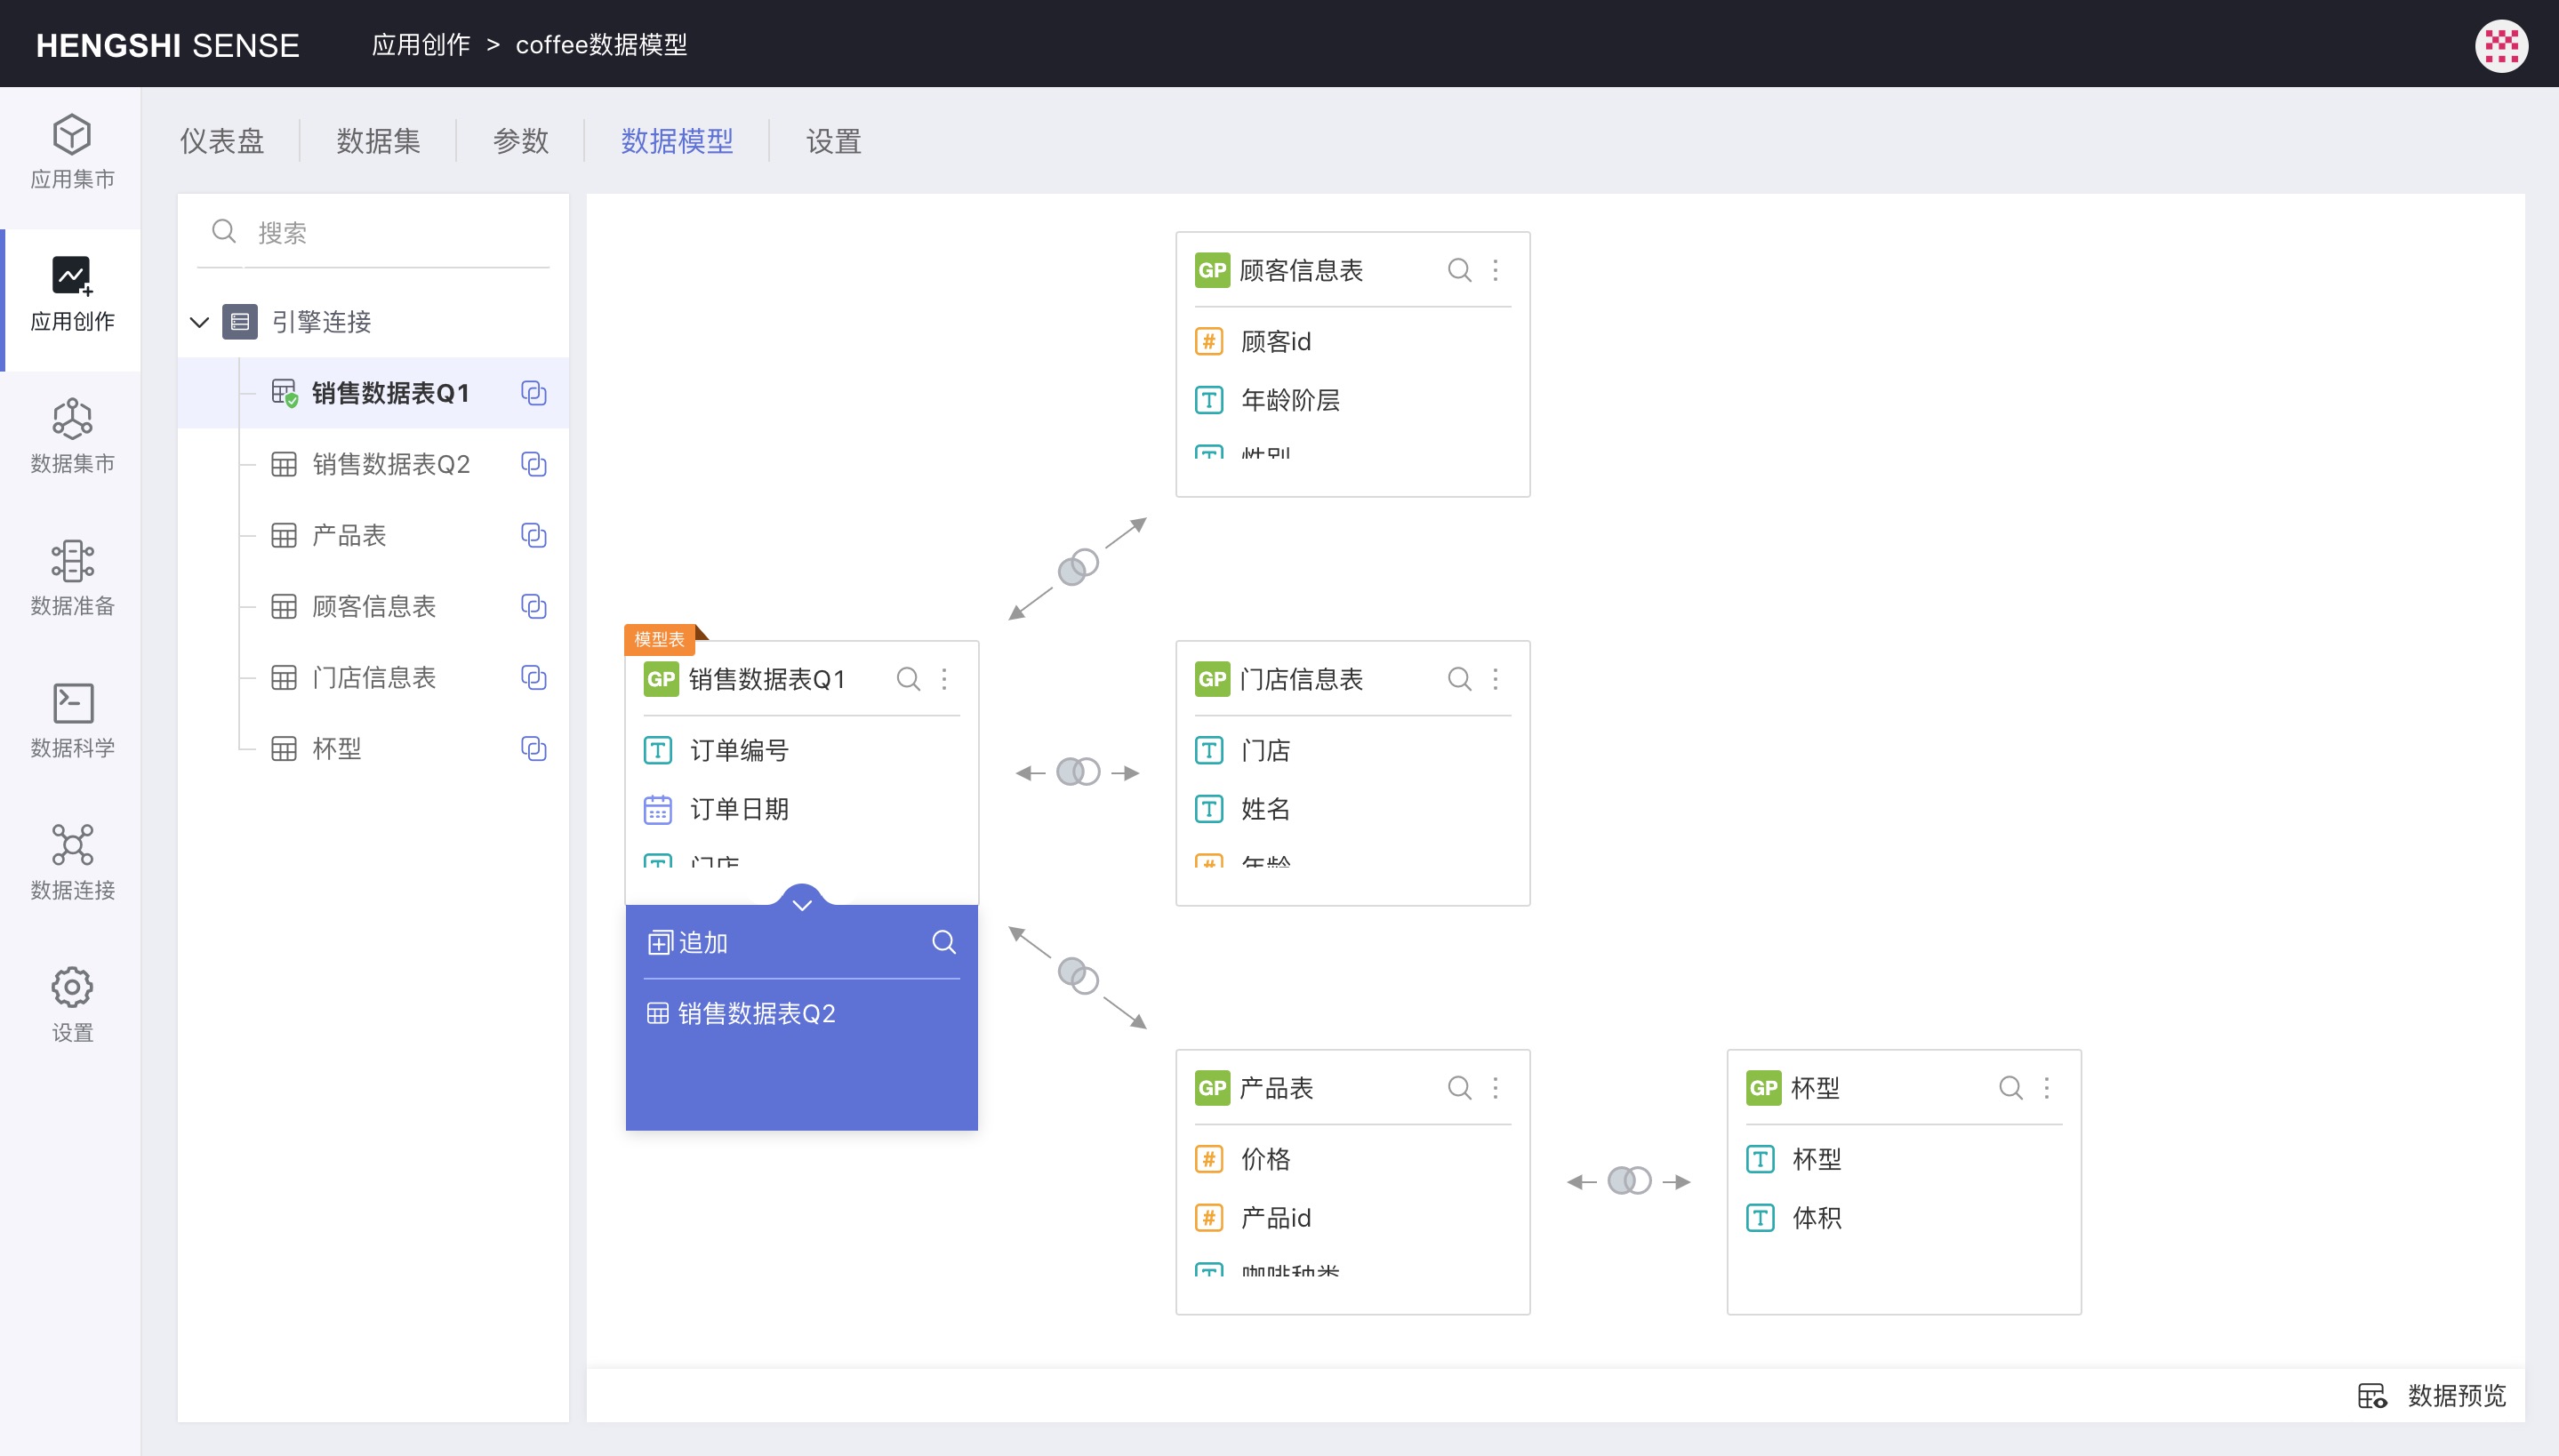
Create New Relationship
In the data model area, click a data set, and then drag a data set from the left-side list to it to pop up the Create New Relationship dialogue. In the dialogue, you can set:
- Association Relationship: Inner join, left join, right join, full join
- Association Conditions: Simple condition, Expression condition
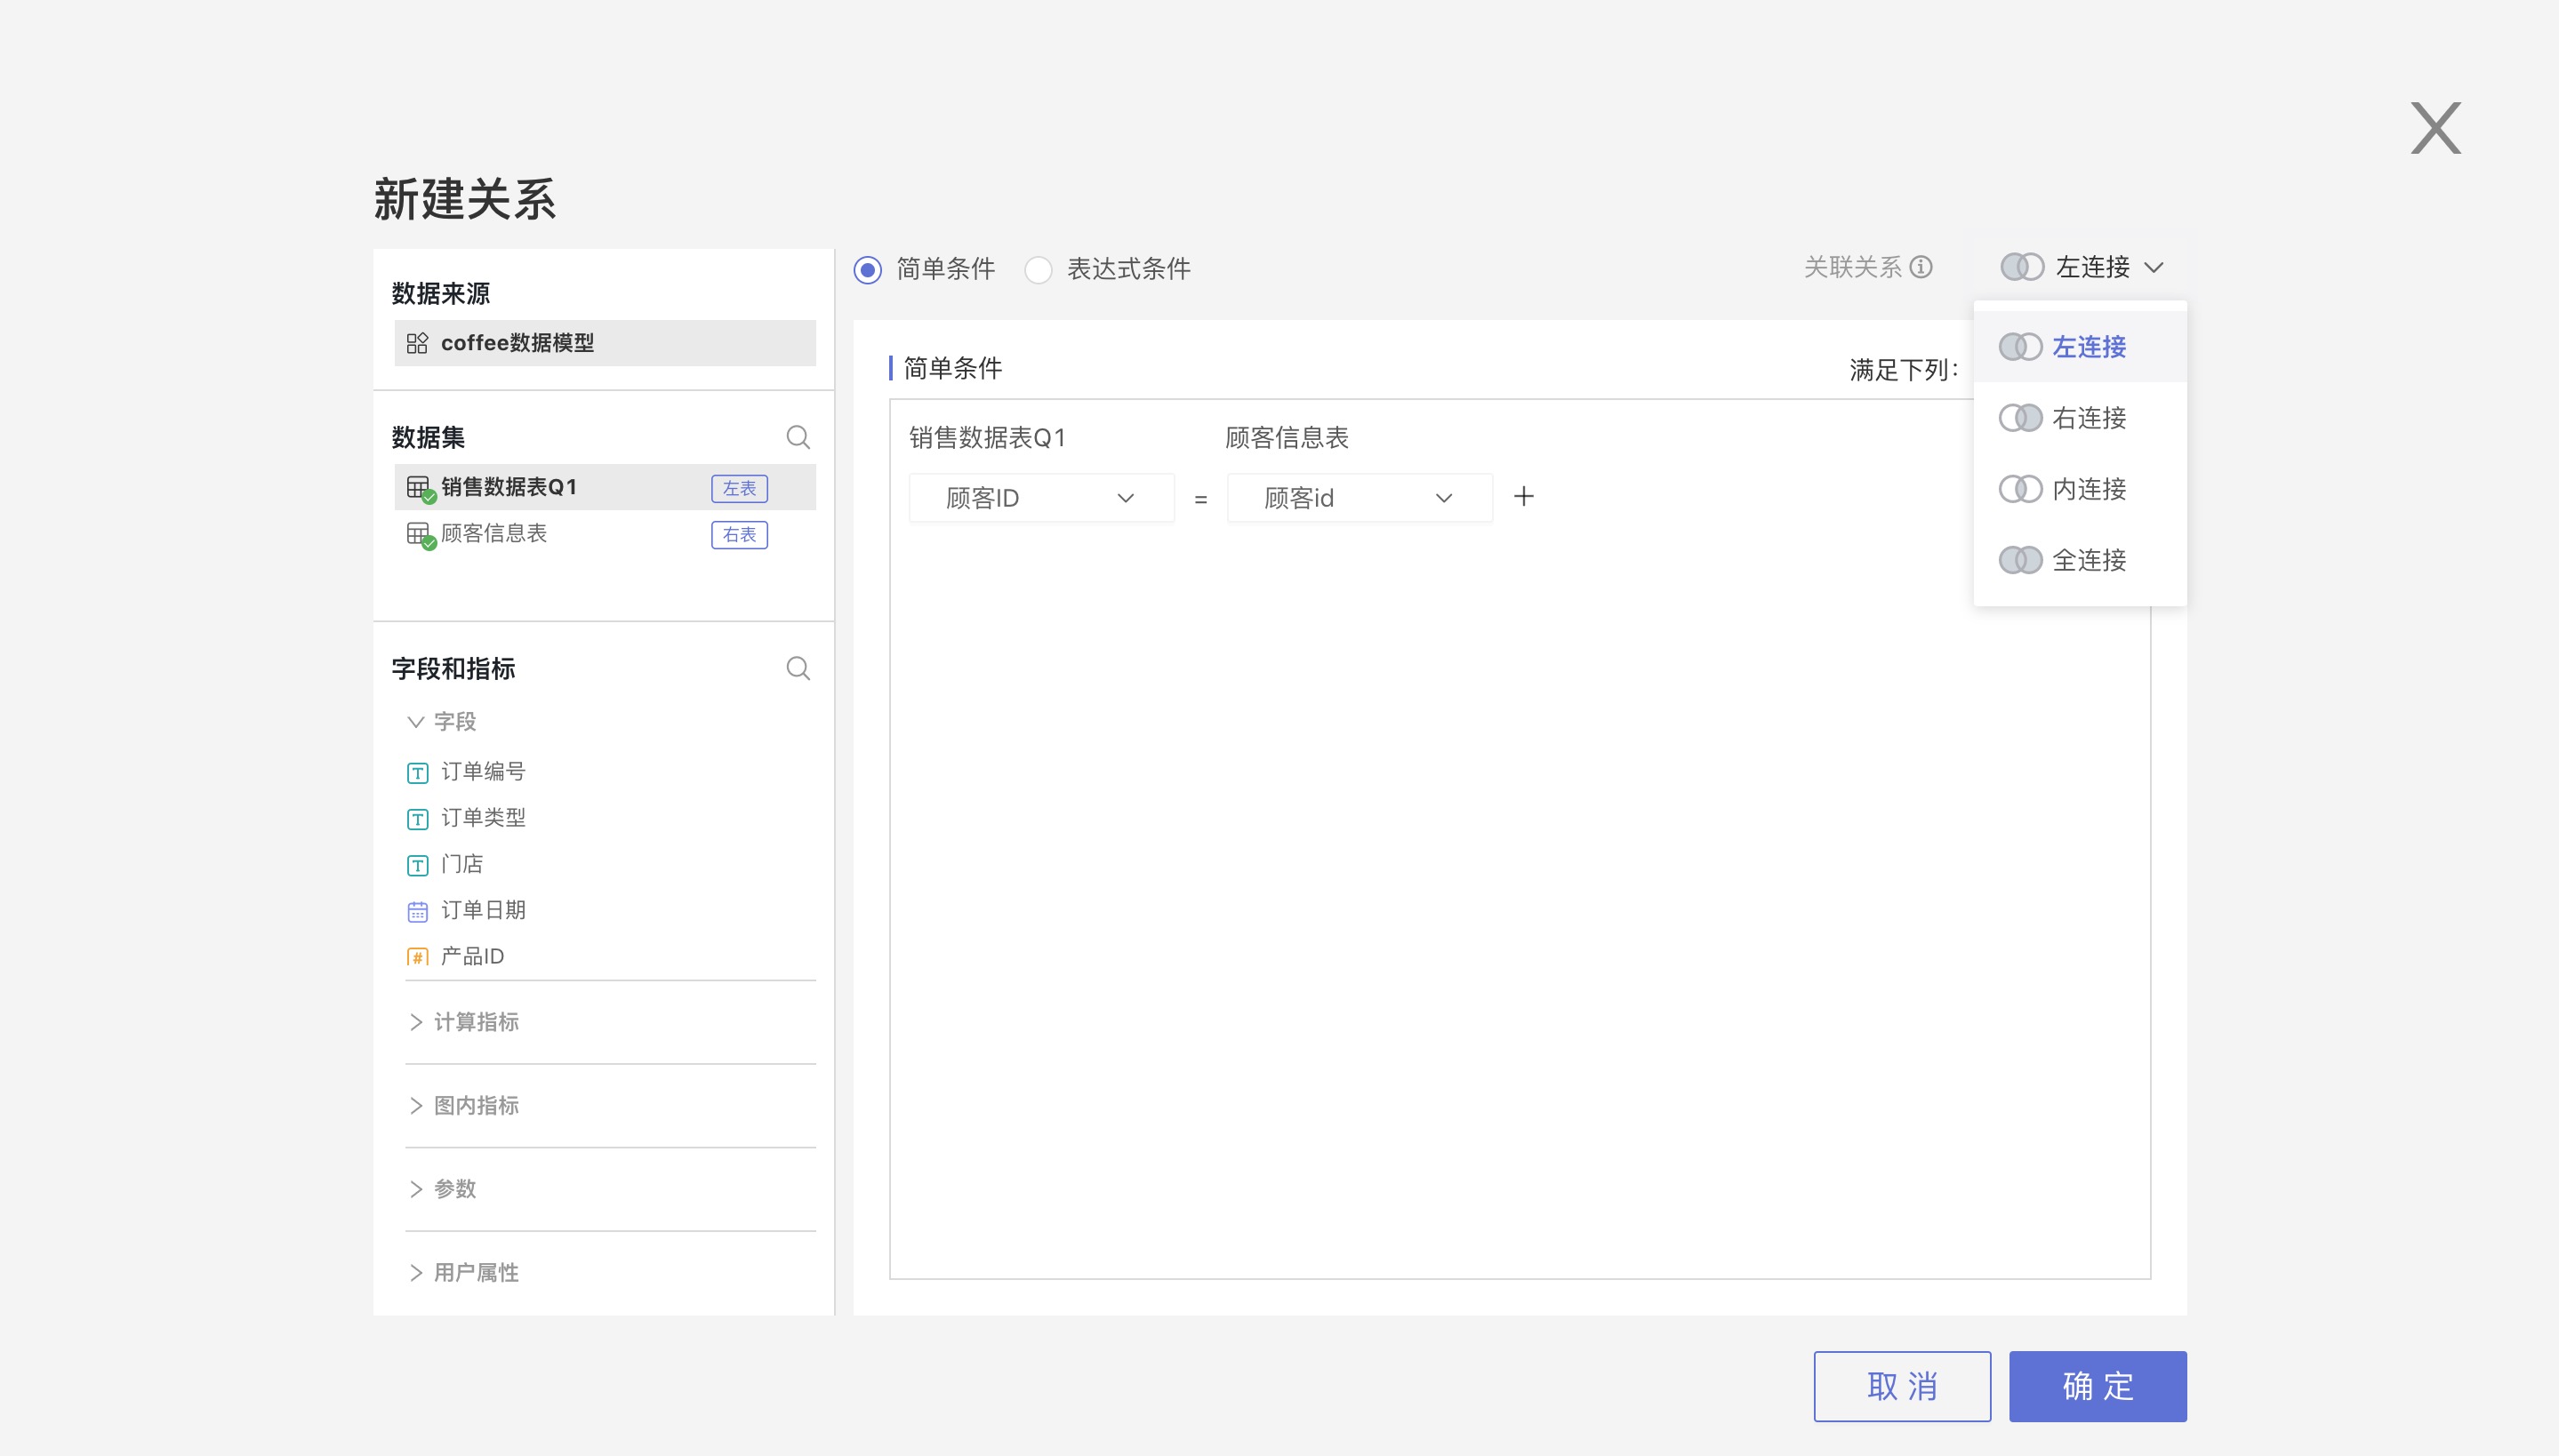
Association Relationship
Association relationship refers to the way data sets are joined, including the following four types:
- Inner Join: Only returns completely matching rows from both tables
- Left Join: Returns all rows from the left table, regardless of whether they match the right table
- Right Join: Returns all rows from the right table, regardless of whether they match the left table
- Full Join: Returns the union of the results of left join and right join
Some databases do not support full join due to their own limitations, such as MySQL 5, TiDB, etc. There will be prompts when creating the model.
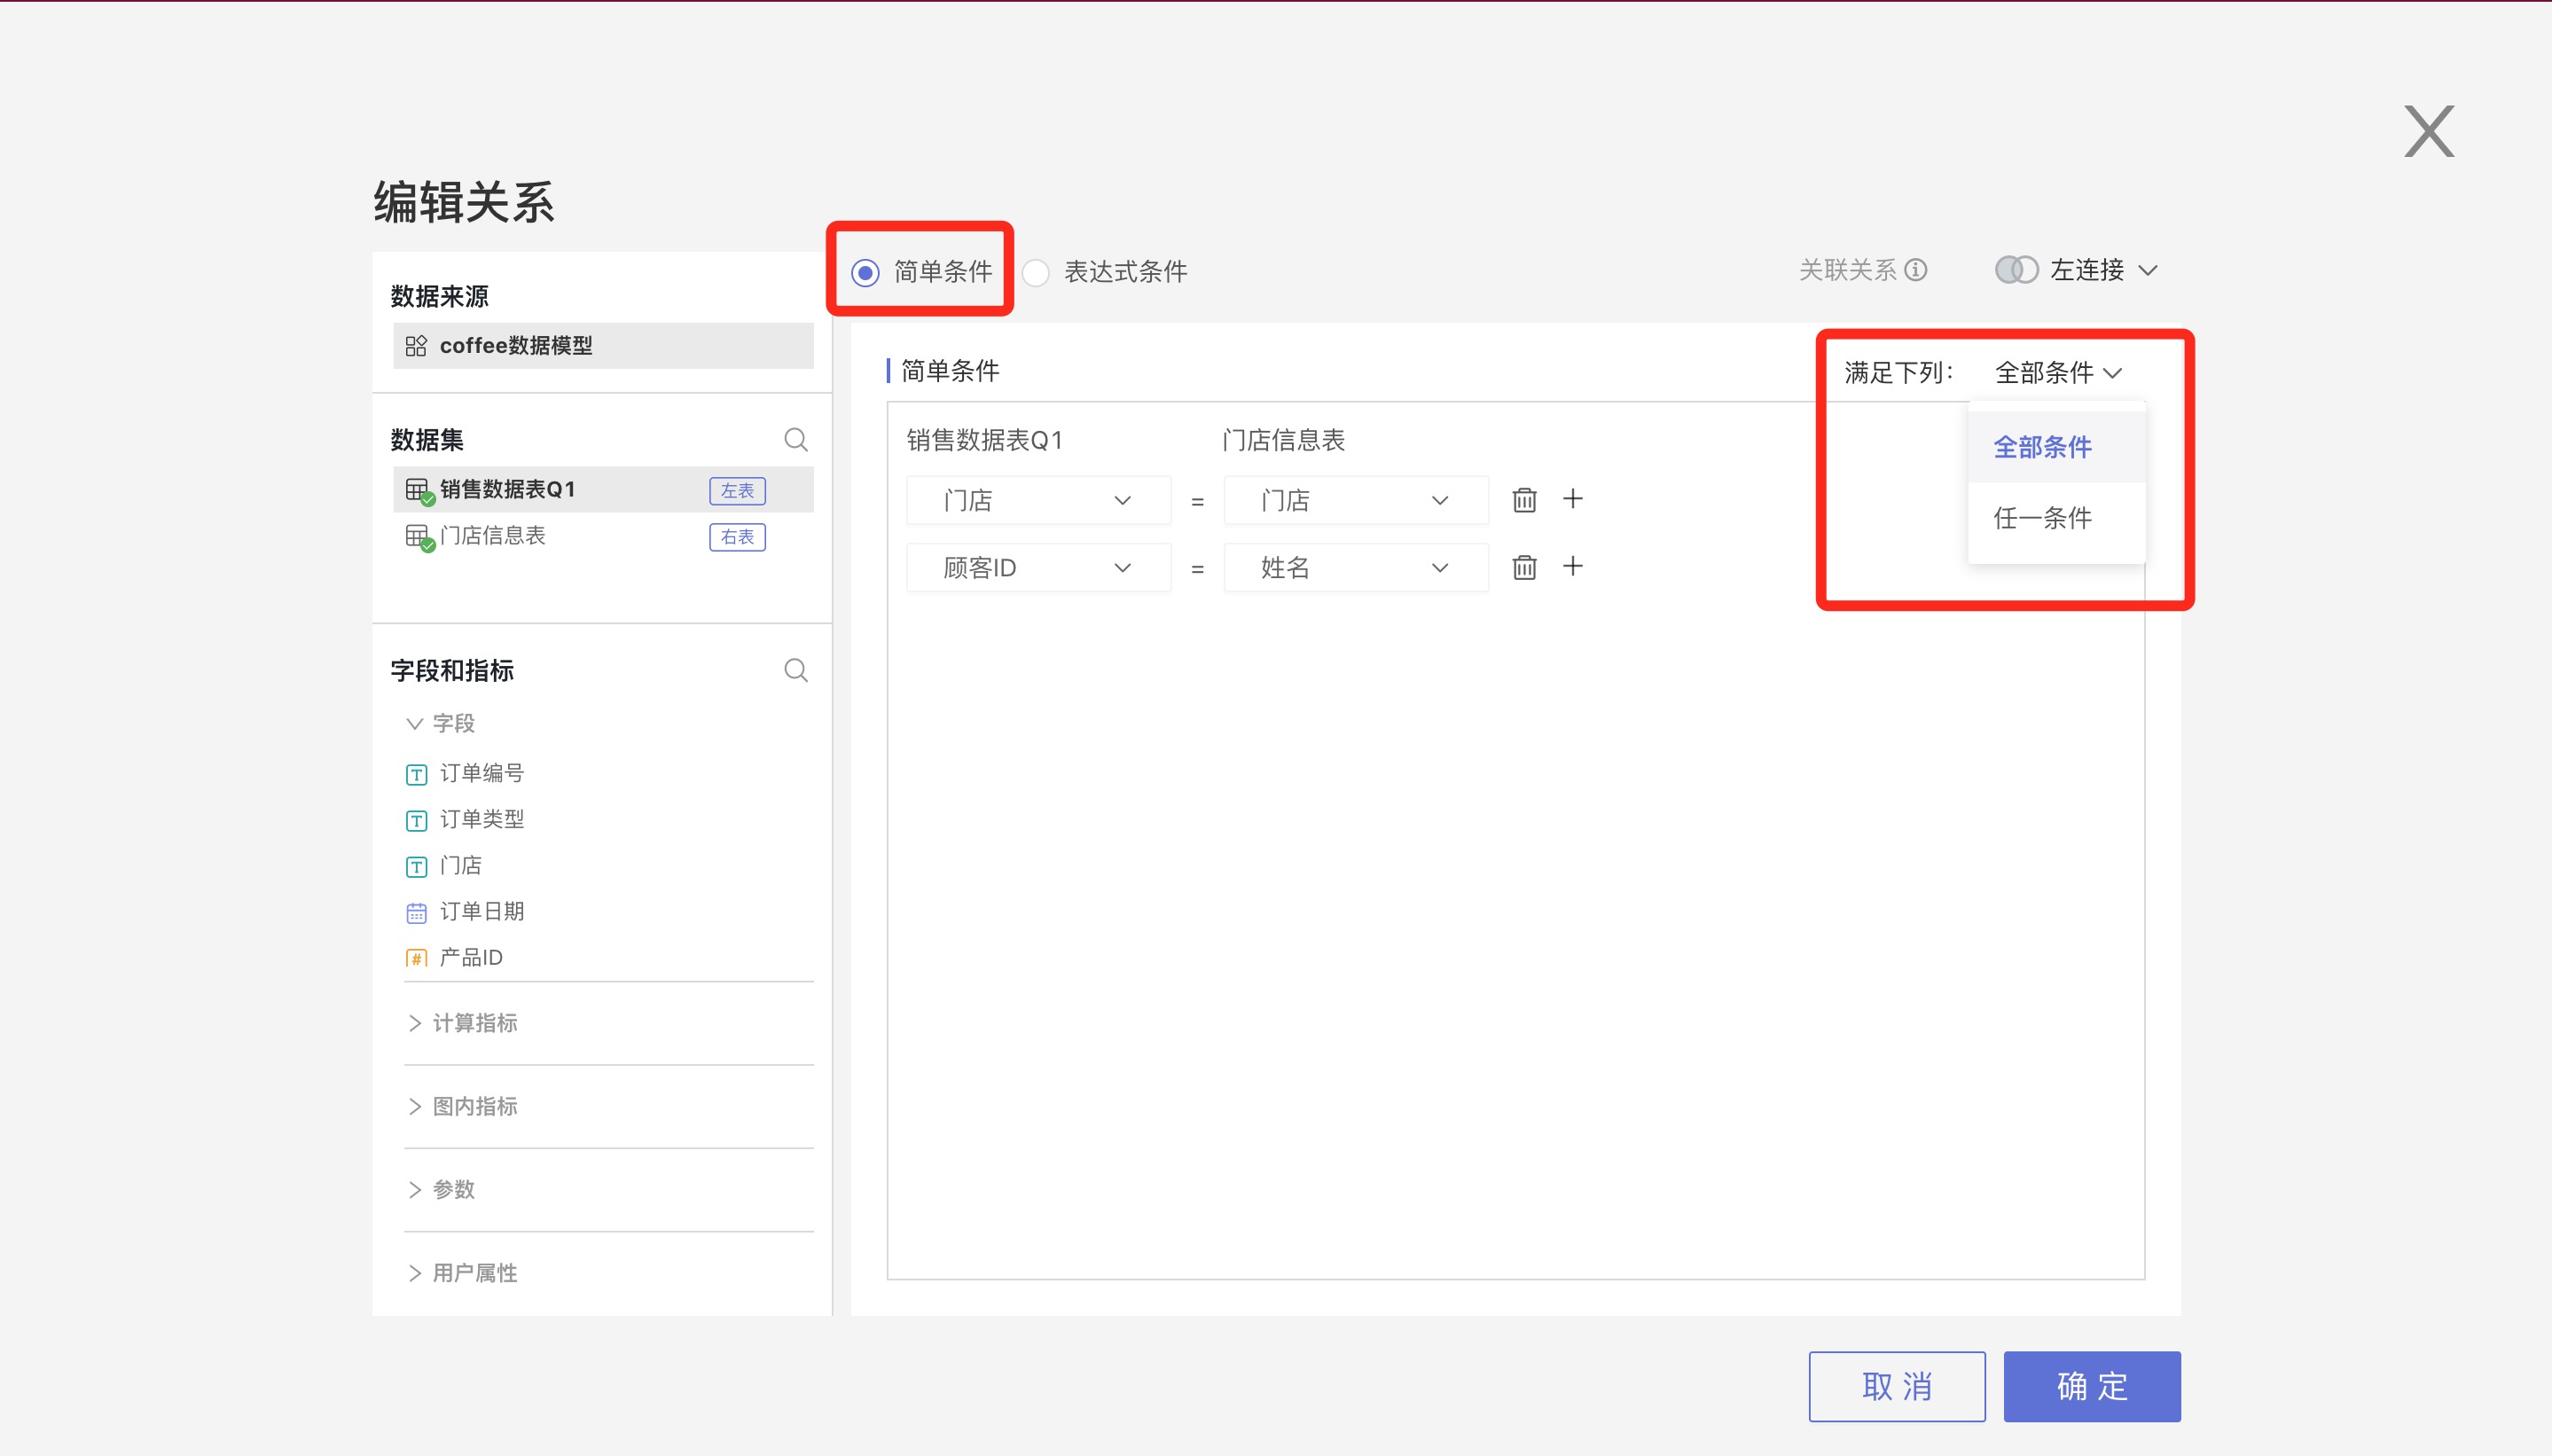
Association Conditions
Association conditions have two setting modes: Simple Condition and Expression Condition.
Simple conditions have two types of relationships between multiple conditions: Any Condition (OR) and All Conditions (AND).
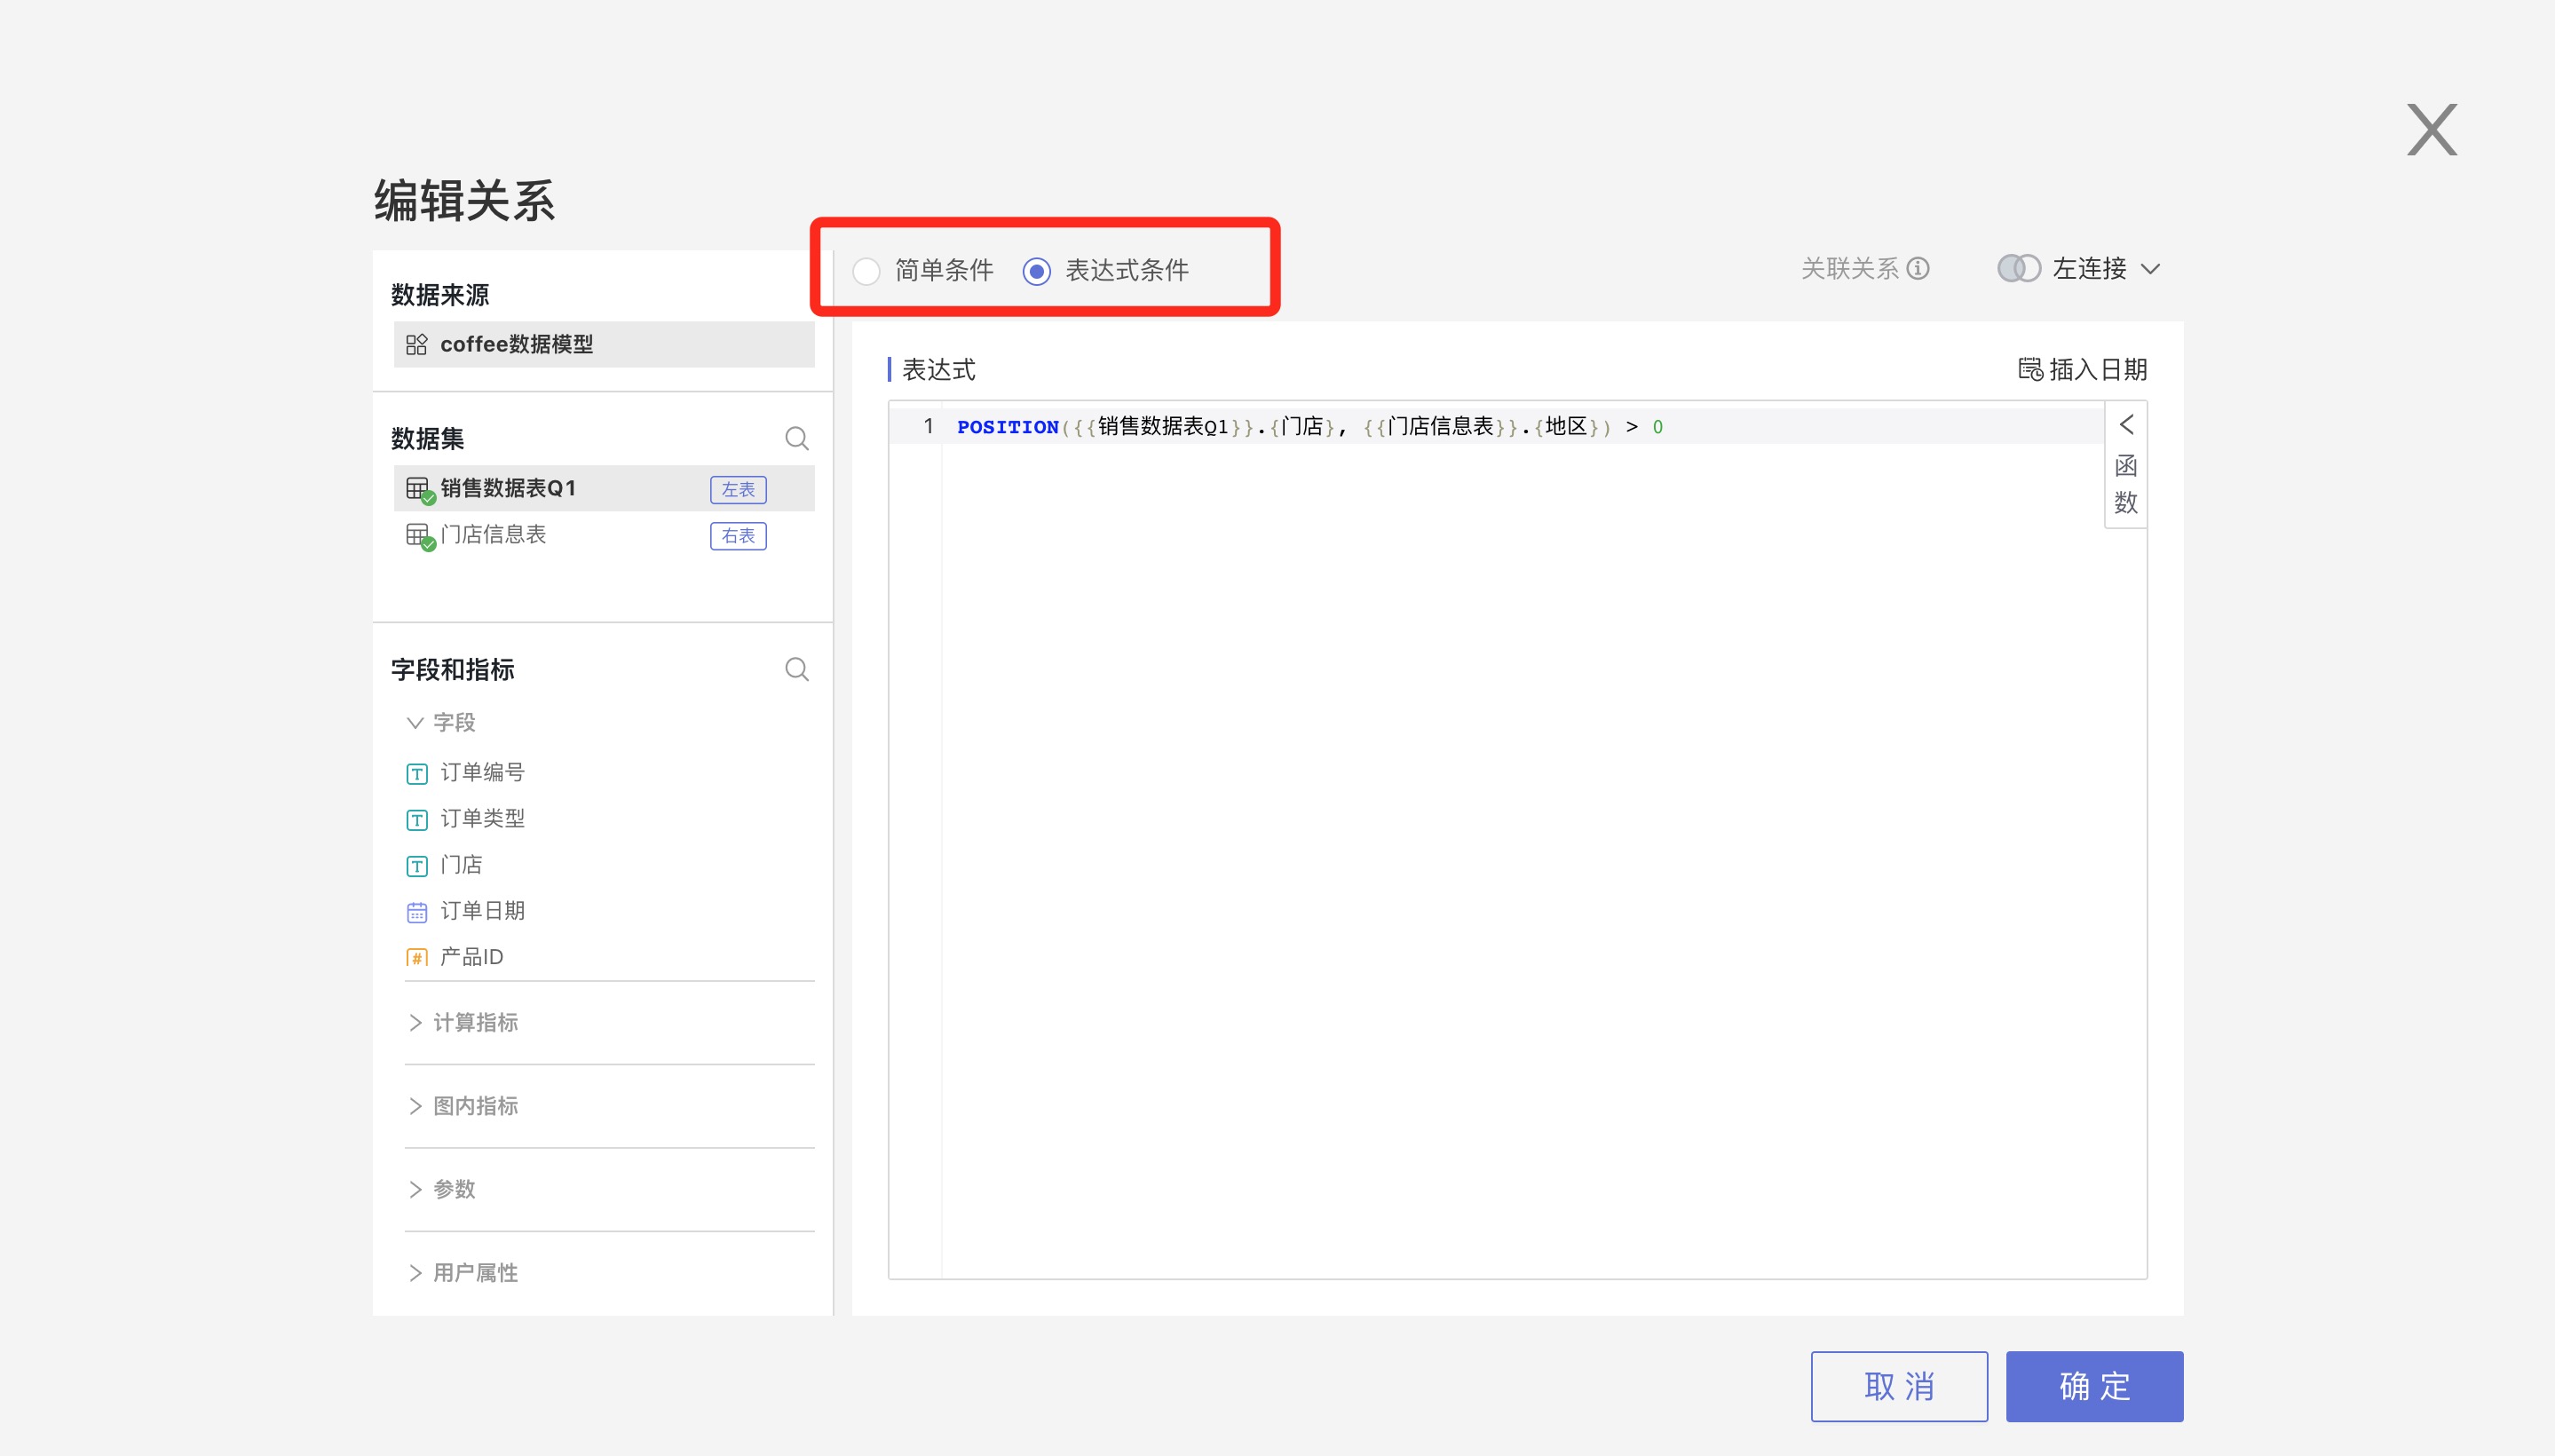
Expression condition supports users to freely write association conditions, which can be field a > field b or like(field a, field b), as shown below:
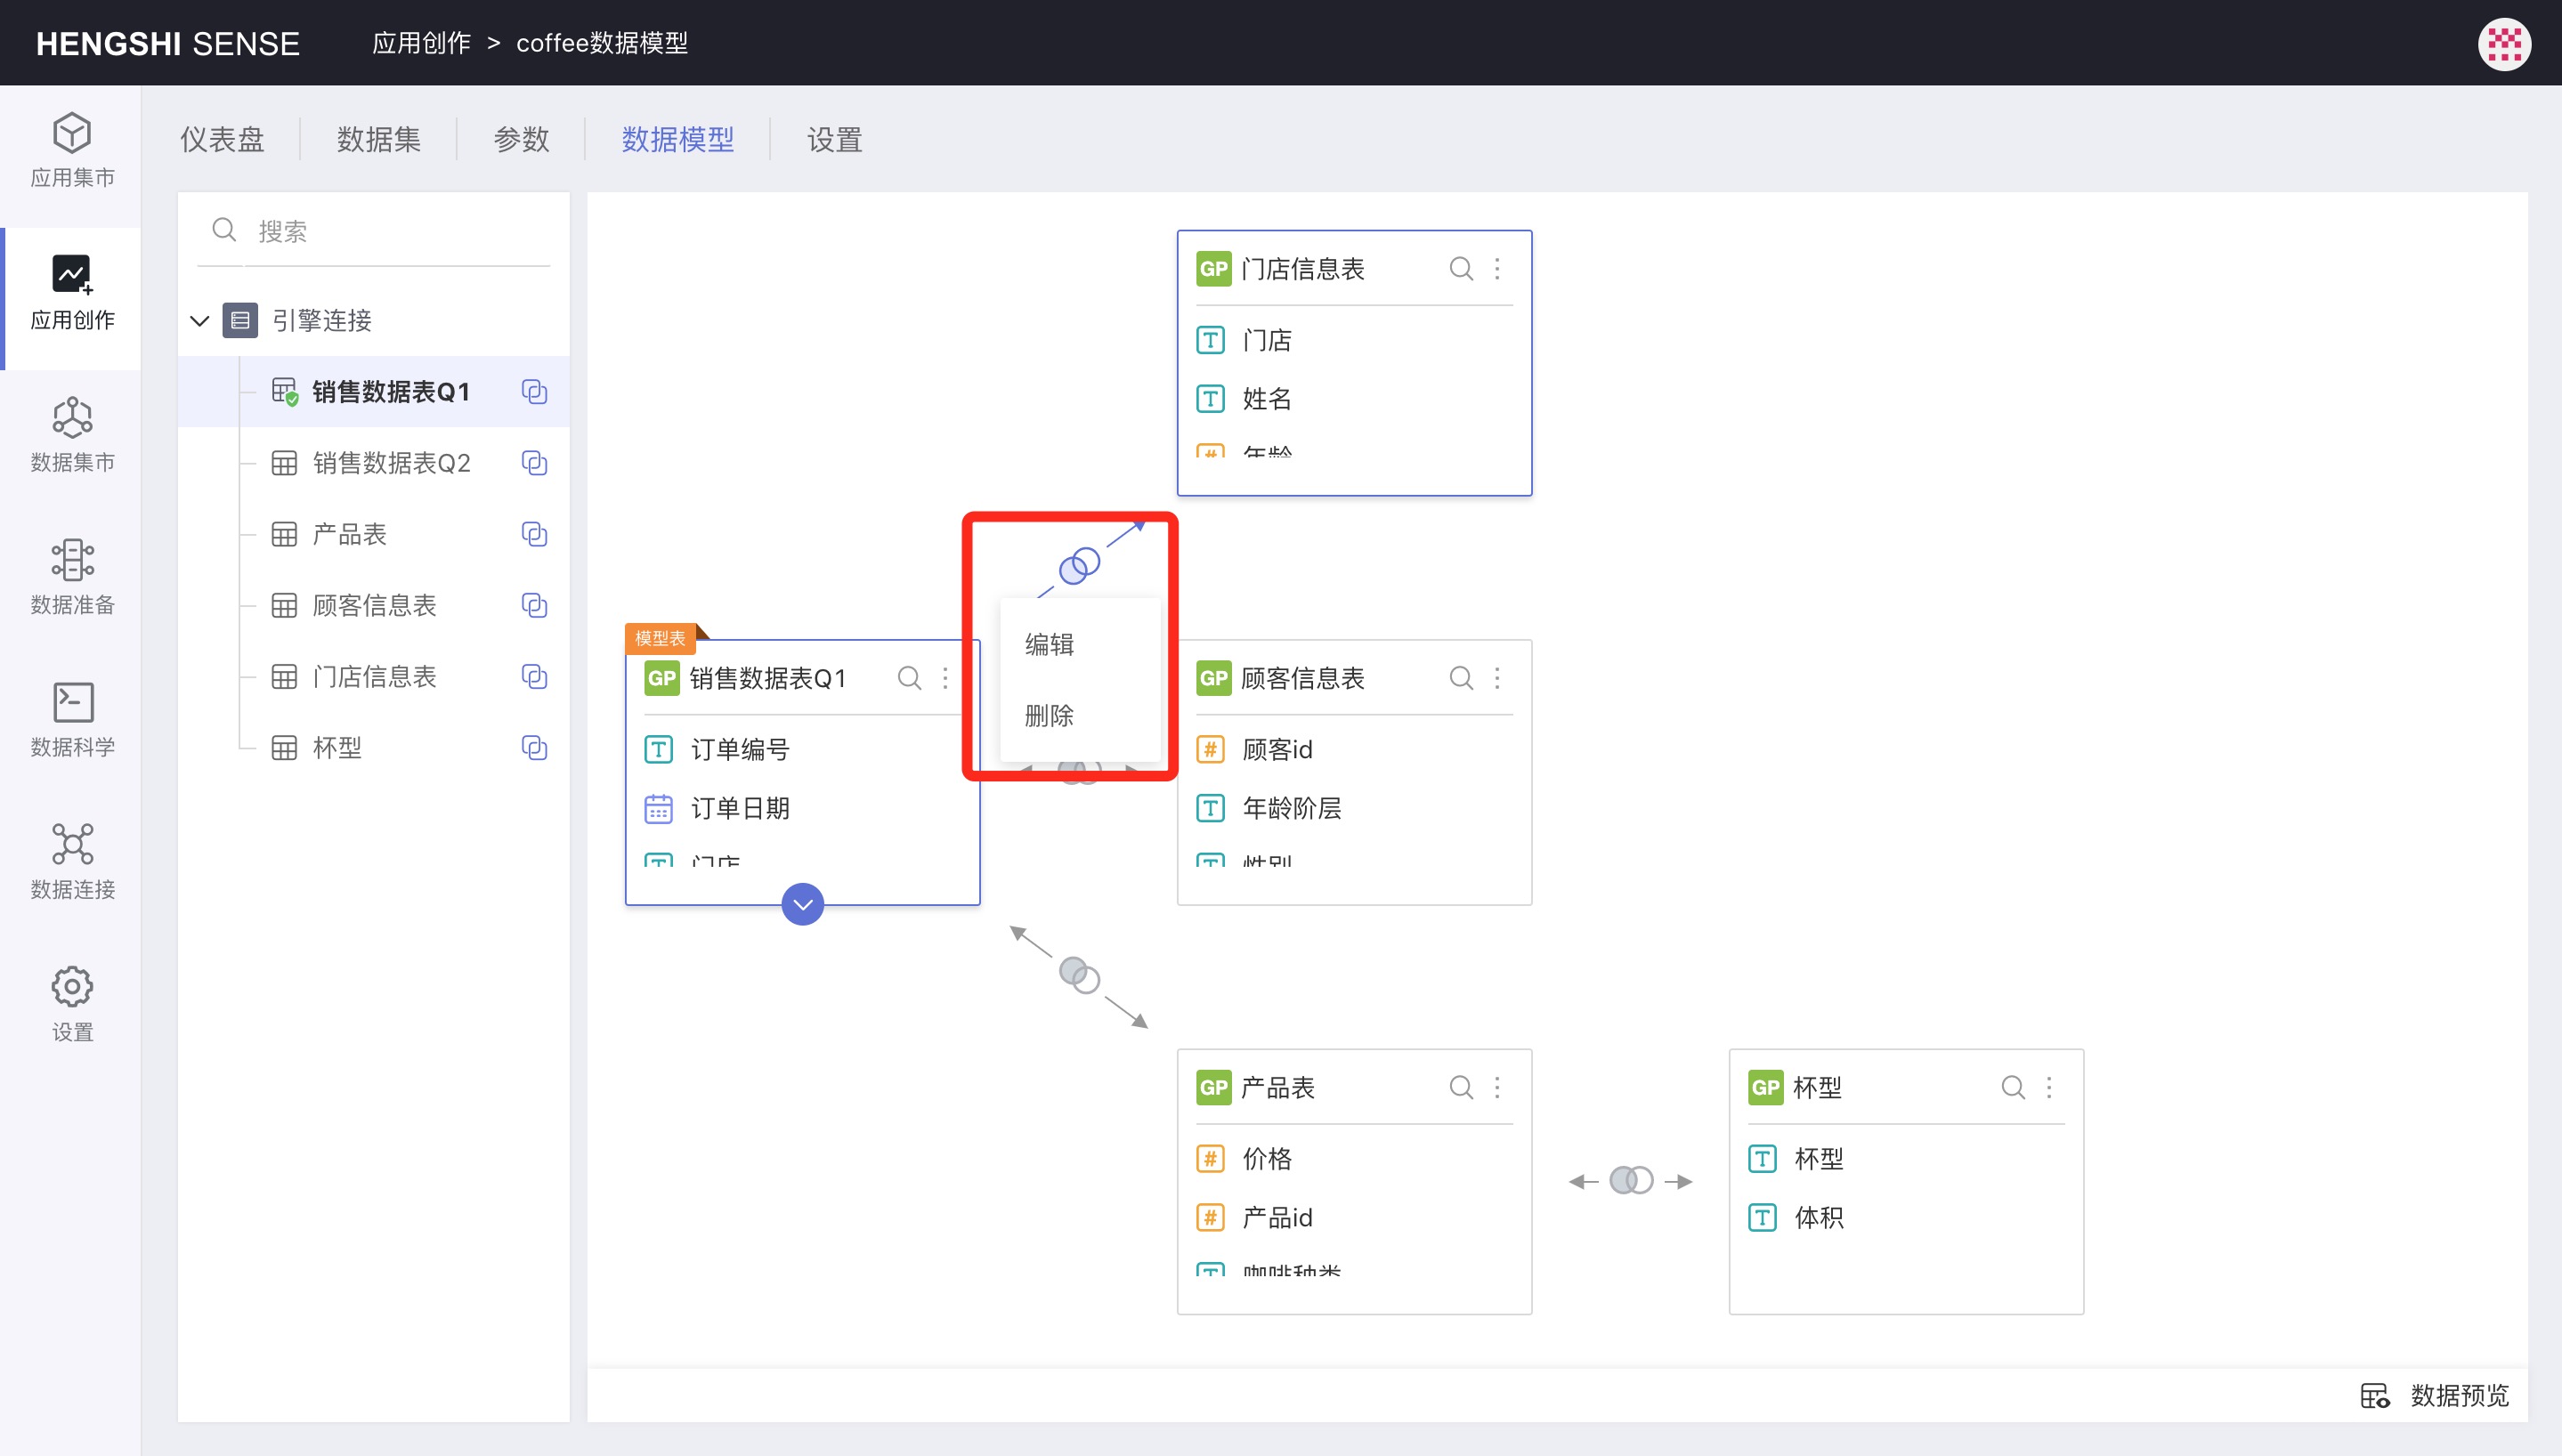
Edit Relationship
Click an associative relationship icon, choose Edit in the pop-up menu, and the Edit Relationship page will appear. The Edit Relationship page is exactly the same as the Create New Relationship page.
Data Set Append
Hover the mouse over any part of a data set to call out the append + icon, click this icon to expand the append data set area, and then drag a data set from the left-side list to append it:
![]()

Append principles are as follows:
- Automatically align by label; the first one is the base dataset; data with the same label are added together, and those with different labels create a new column; this process repeats.
- User-added fields in the base dataset are still considered new fields after appending. If the appended fields have the same label, that column is ignored.
- Hidden columns can participate in append.
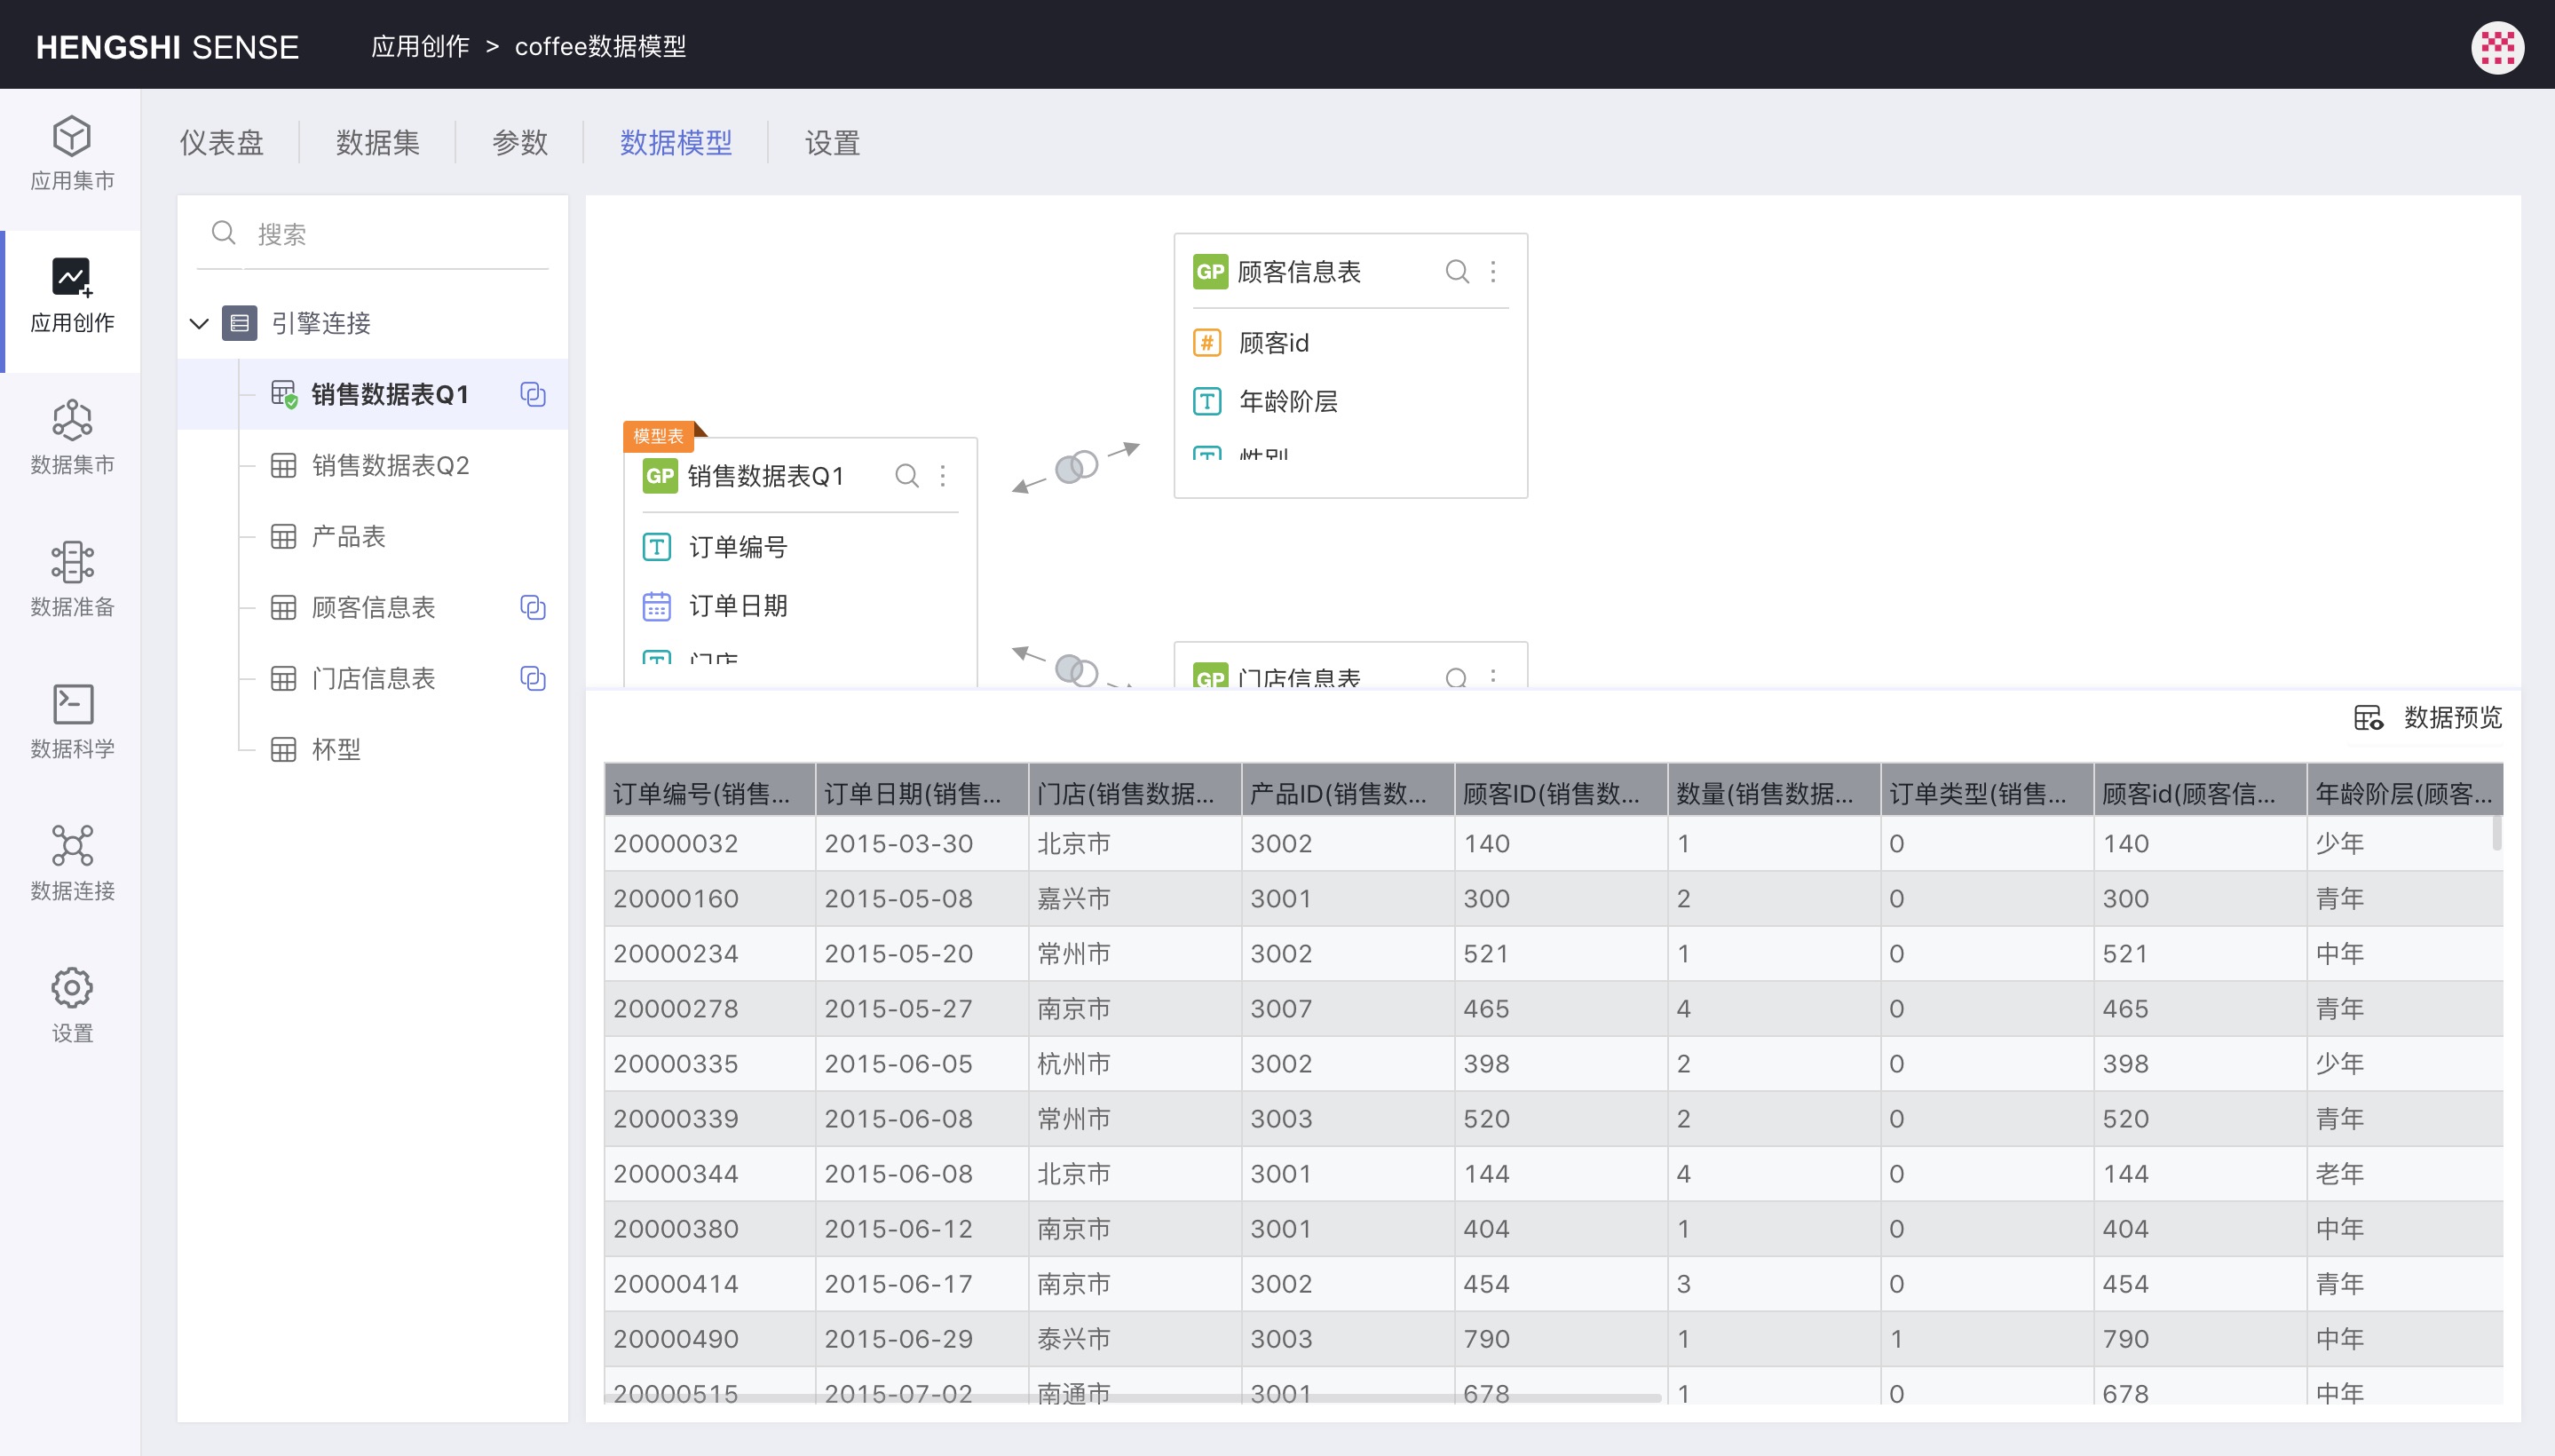
Preview Data
Click Preview Data at the bottom right of the data model area to preview the data after the associative model takes effect immediately:
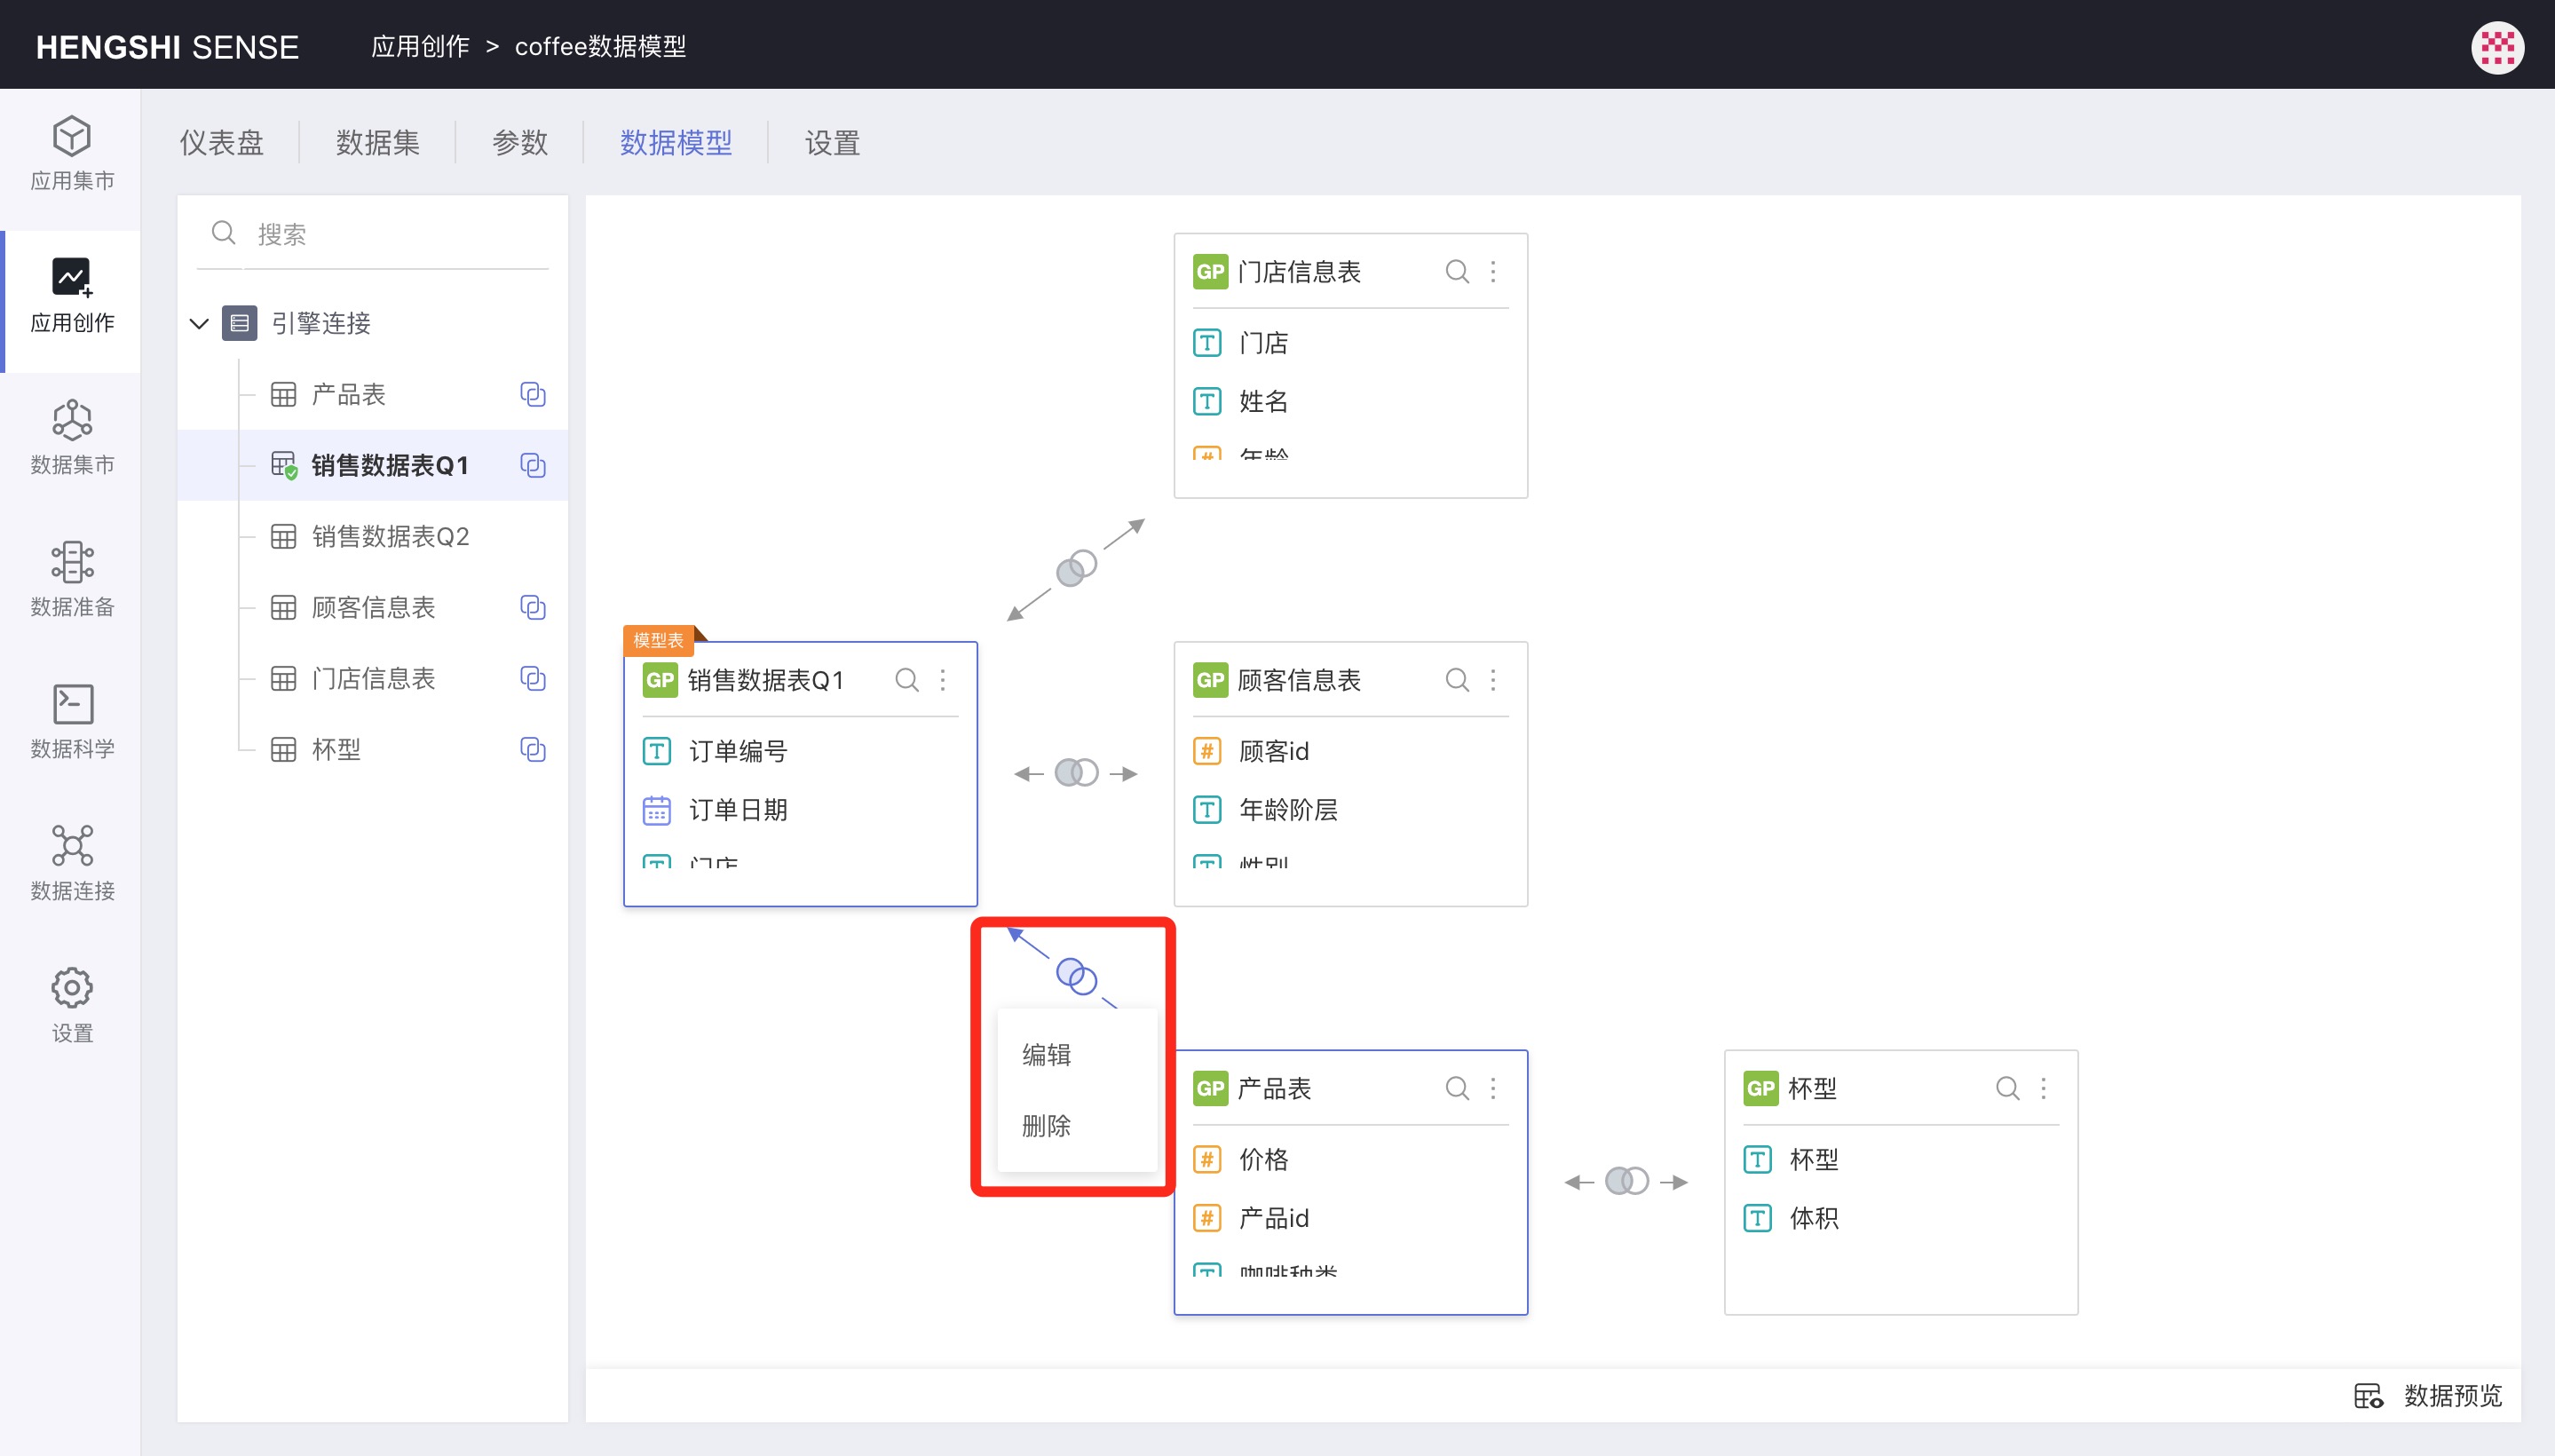
Delete Relationship
There are two ways to delete a relationship:
- Click on the relational icon, and choose
Deletefrom the pop-up menu to delete a single relationship. When deleting a single relationship, other relationships associated with the deleted associated table will also be deleted. That is, there will not be any relationships in the data model independent of the model table; any data set will be related to the model table through one or more links.
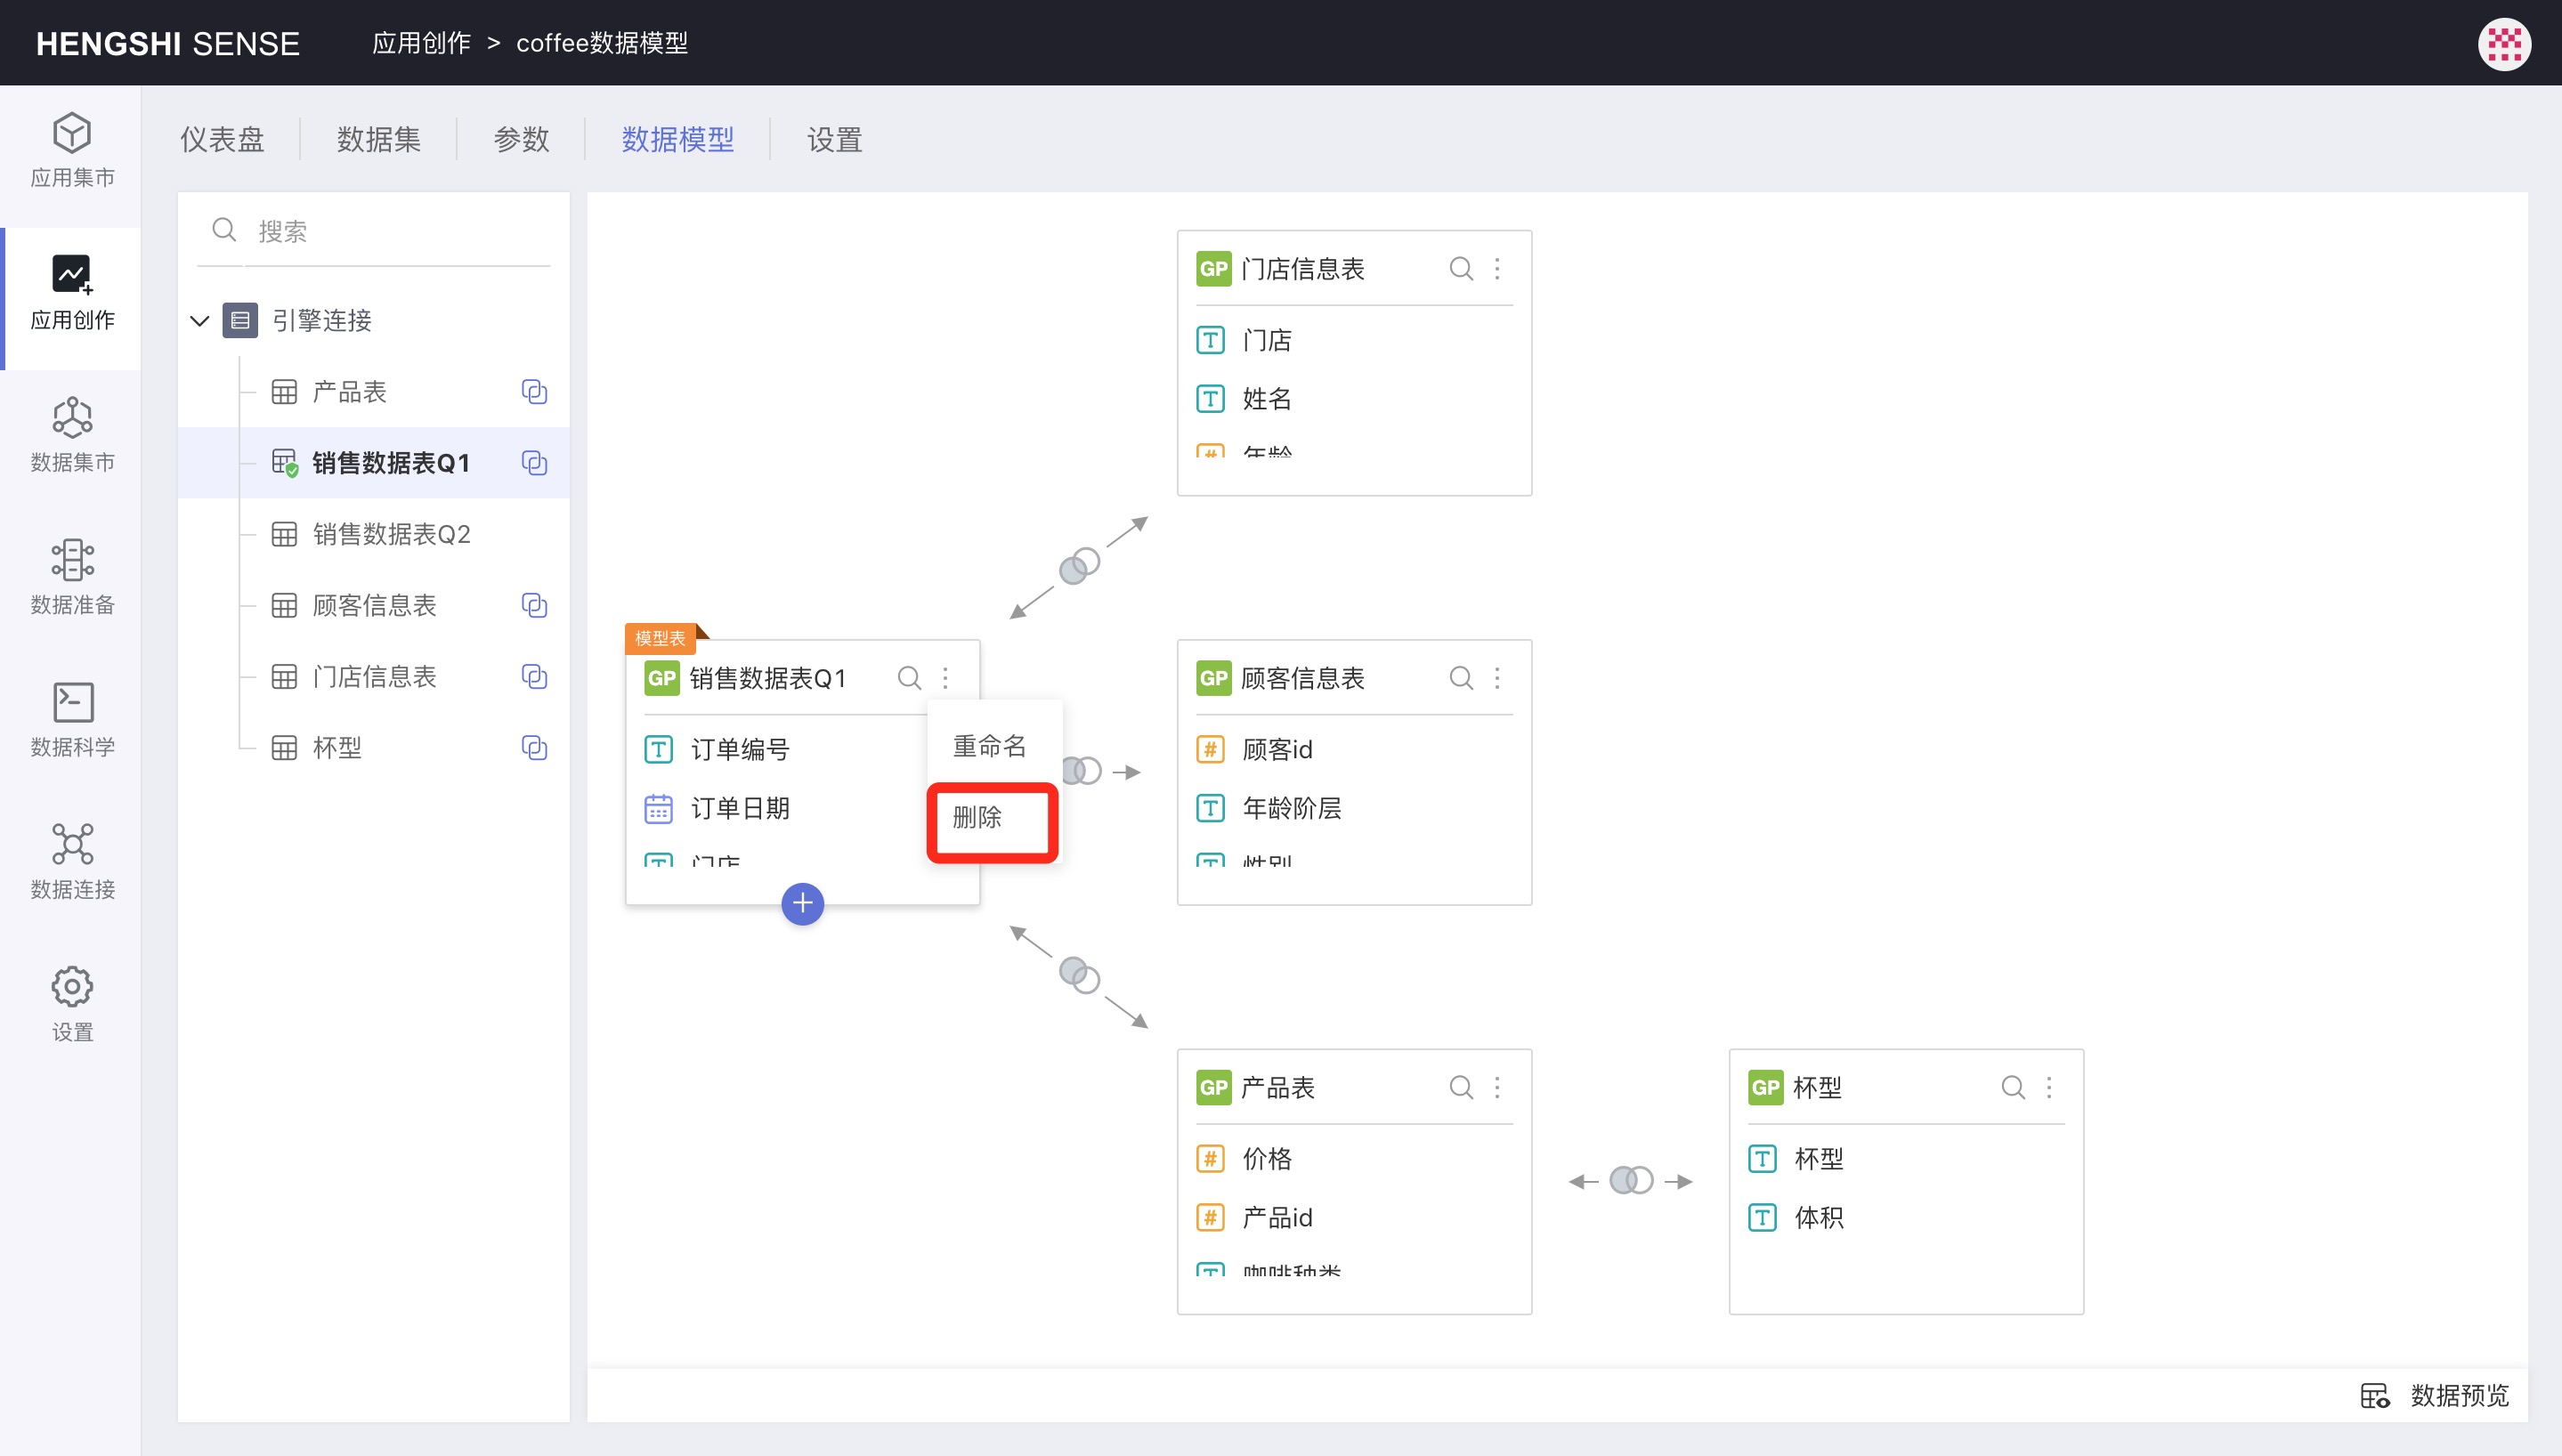
- Click the three-dot menu at the top right of a data set, and click
Deletein the pop-up menu to delete all relationships associated with that data set.
Create Metrics Across Data Sets
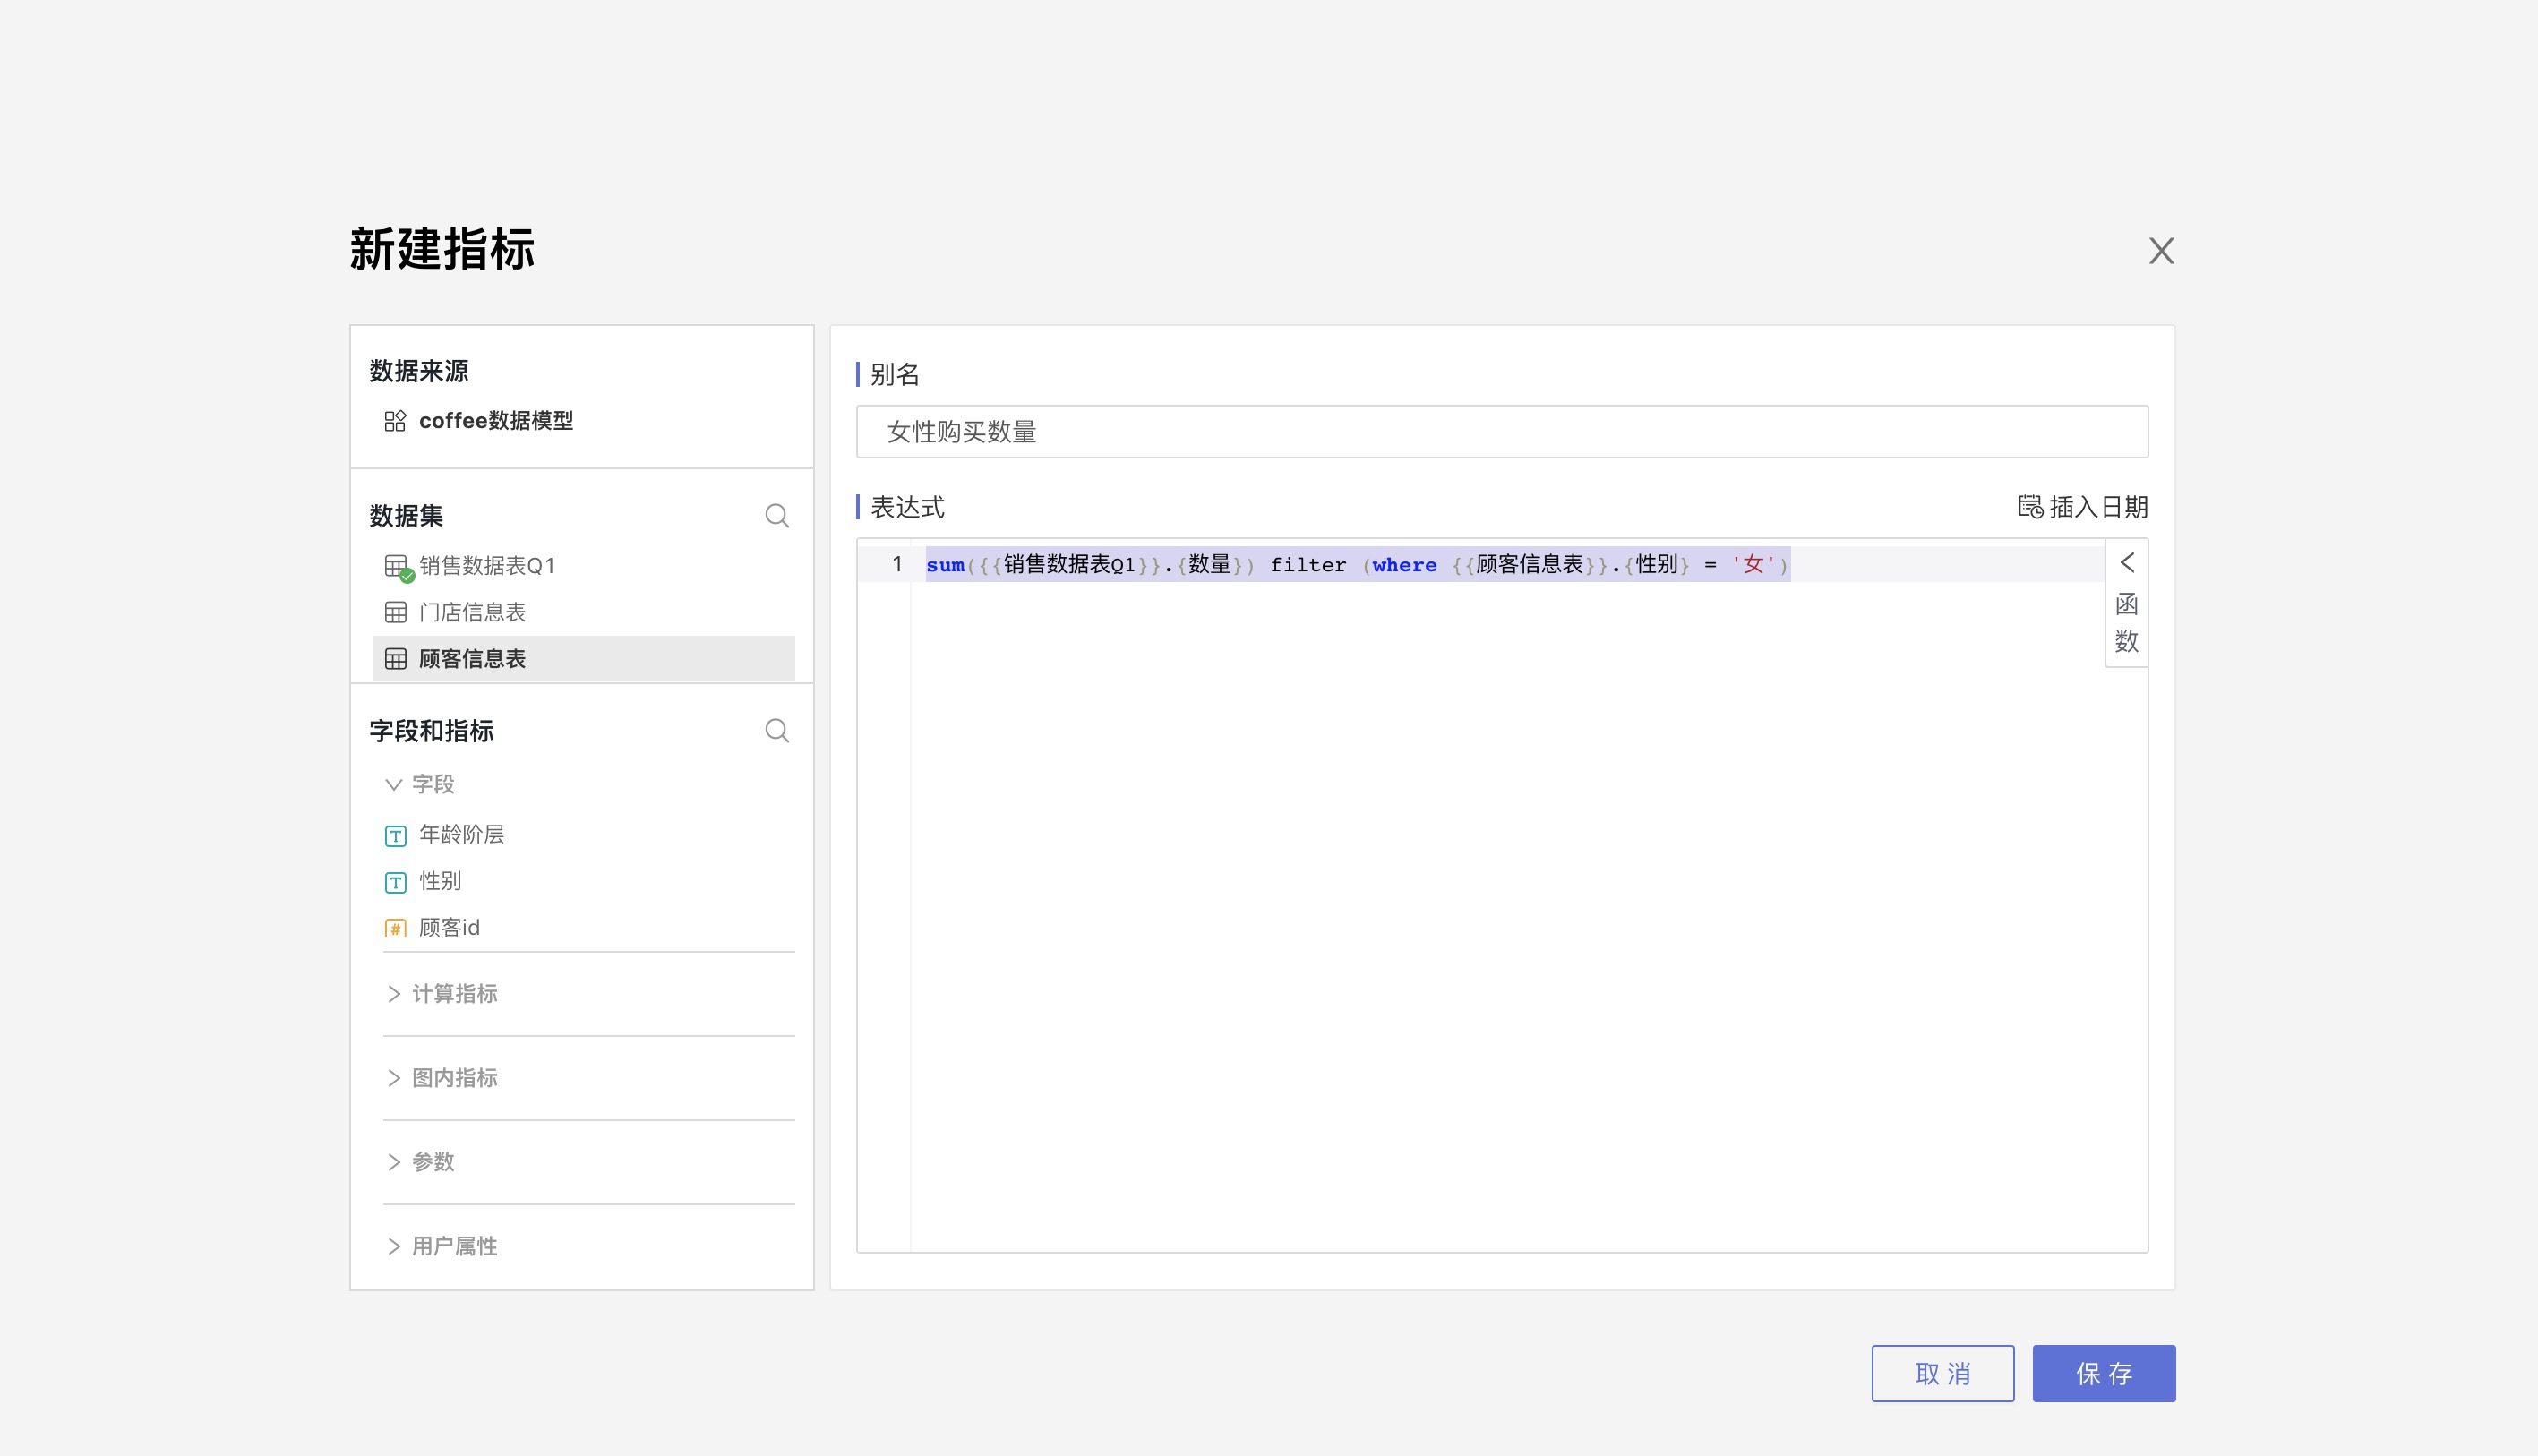
Open the model table data set, create a new metric, and you can use fields from the associated table in the metric expression.
In a model, metrics can only be created for the model table, not for the associated tables.
The metric below uses fields from two data sets:
Data Set Reuse
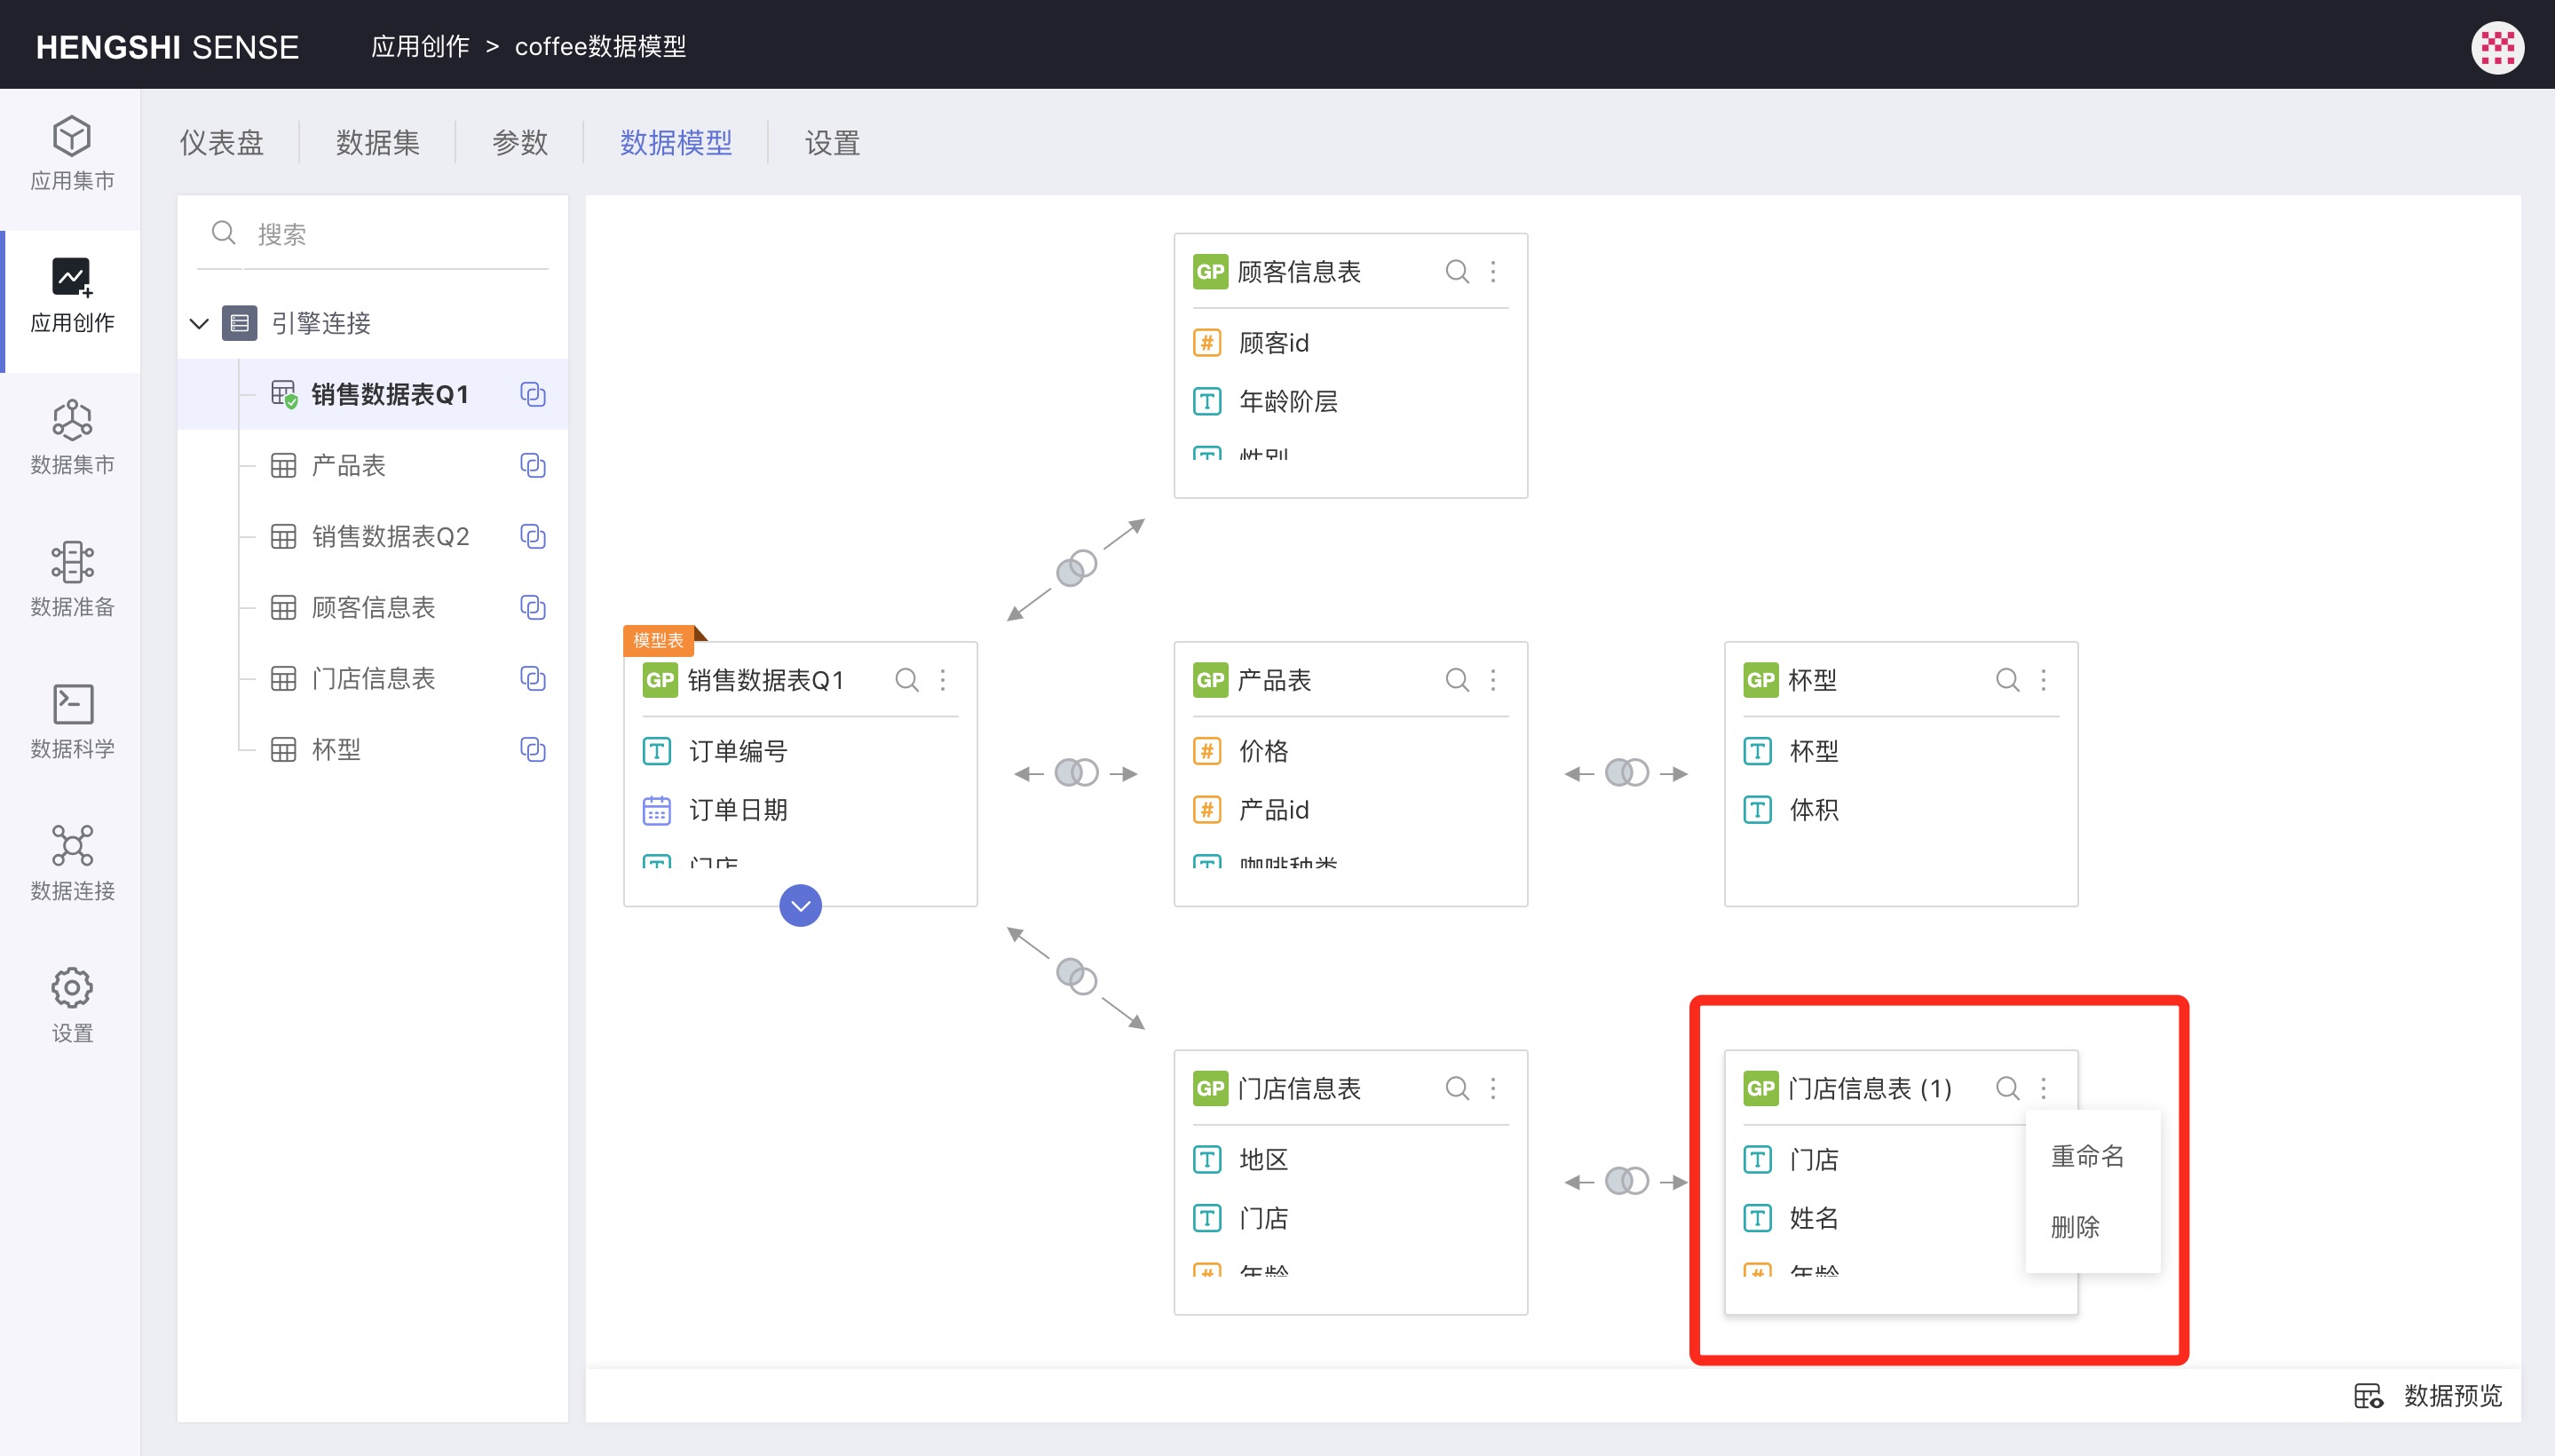
In a data model, the same data set can be dragged in multiple times. Upon subsequent drags, the data name is automatically appended with (1), (2), etc. For example, in the image below, when the Store Information Table is dragged in for the second time, it automatically has (1) added, becoming Store Information Table(1).
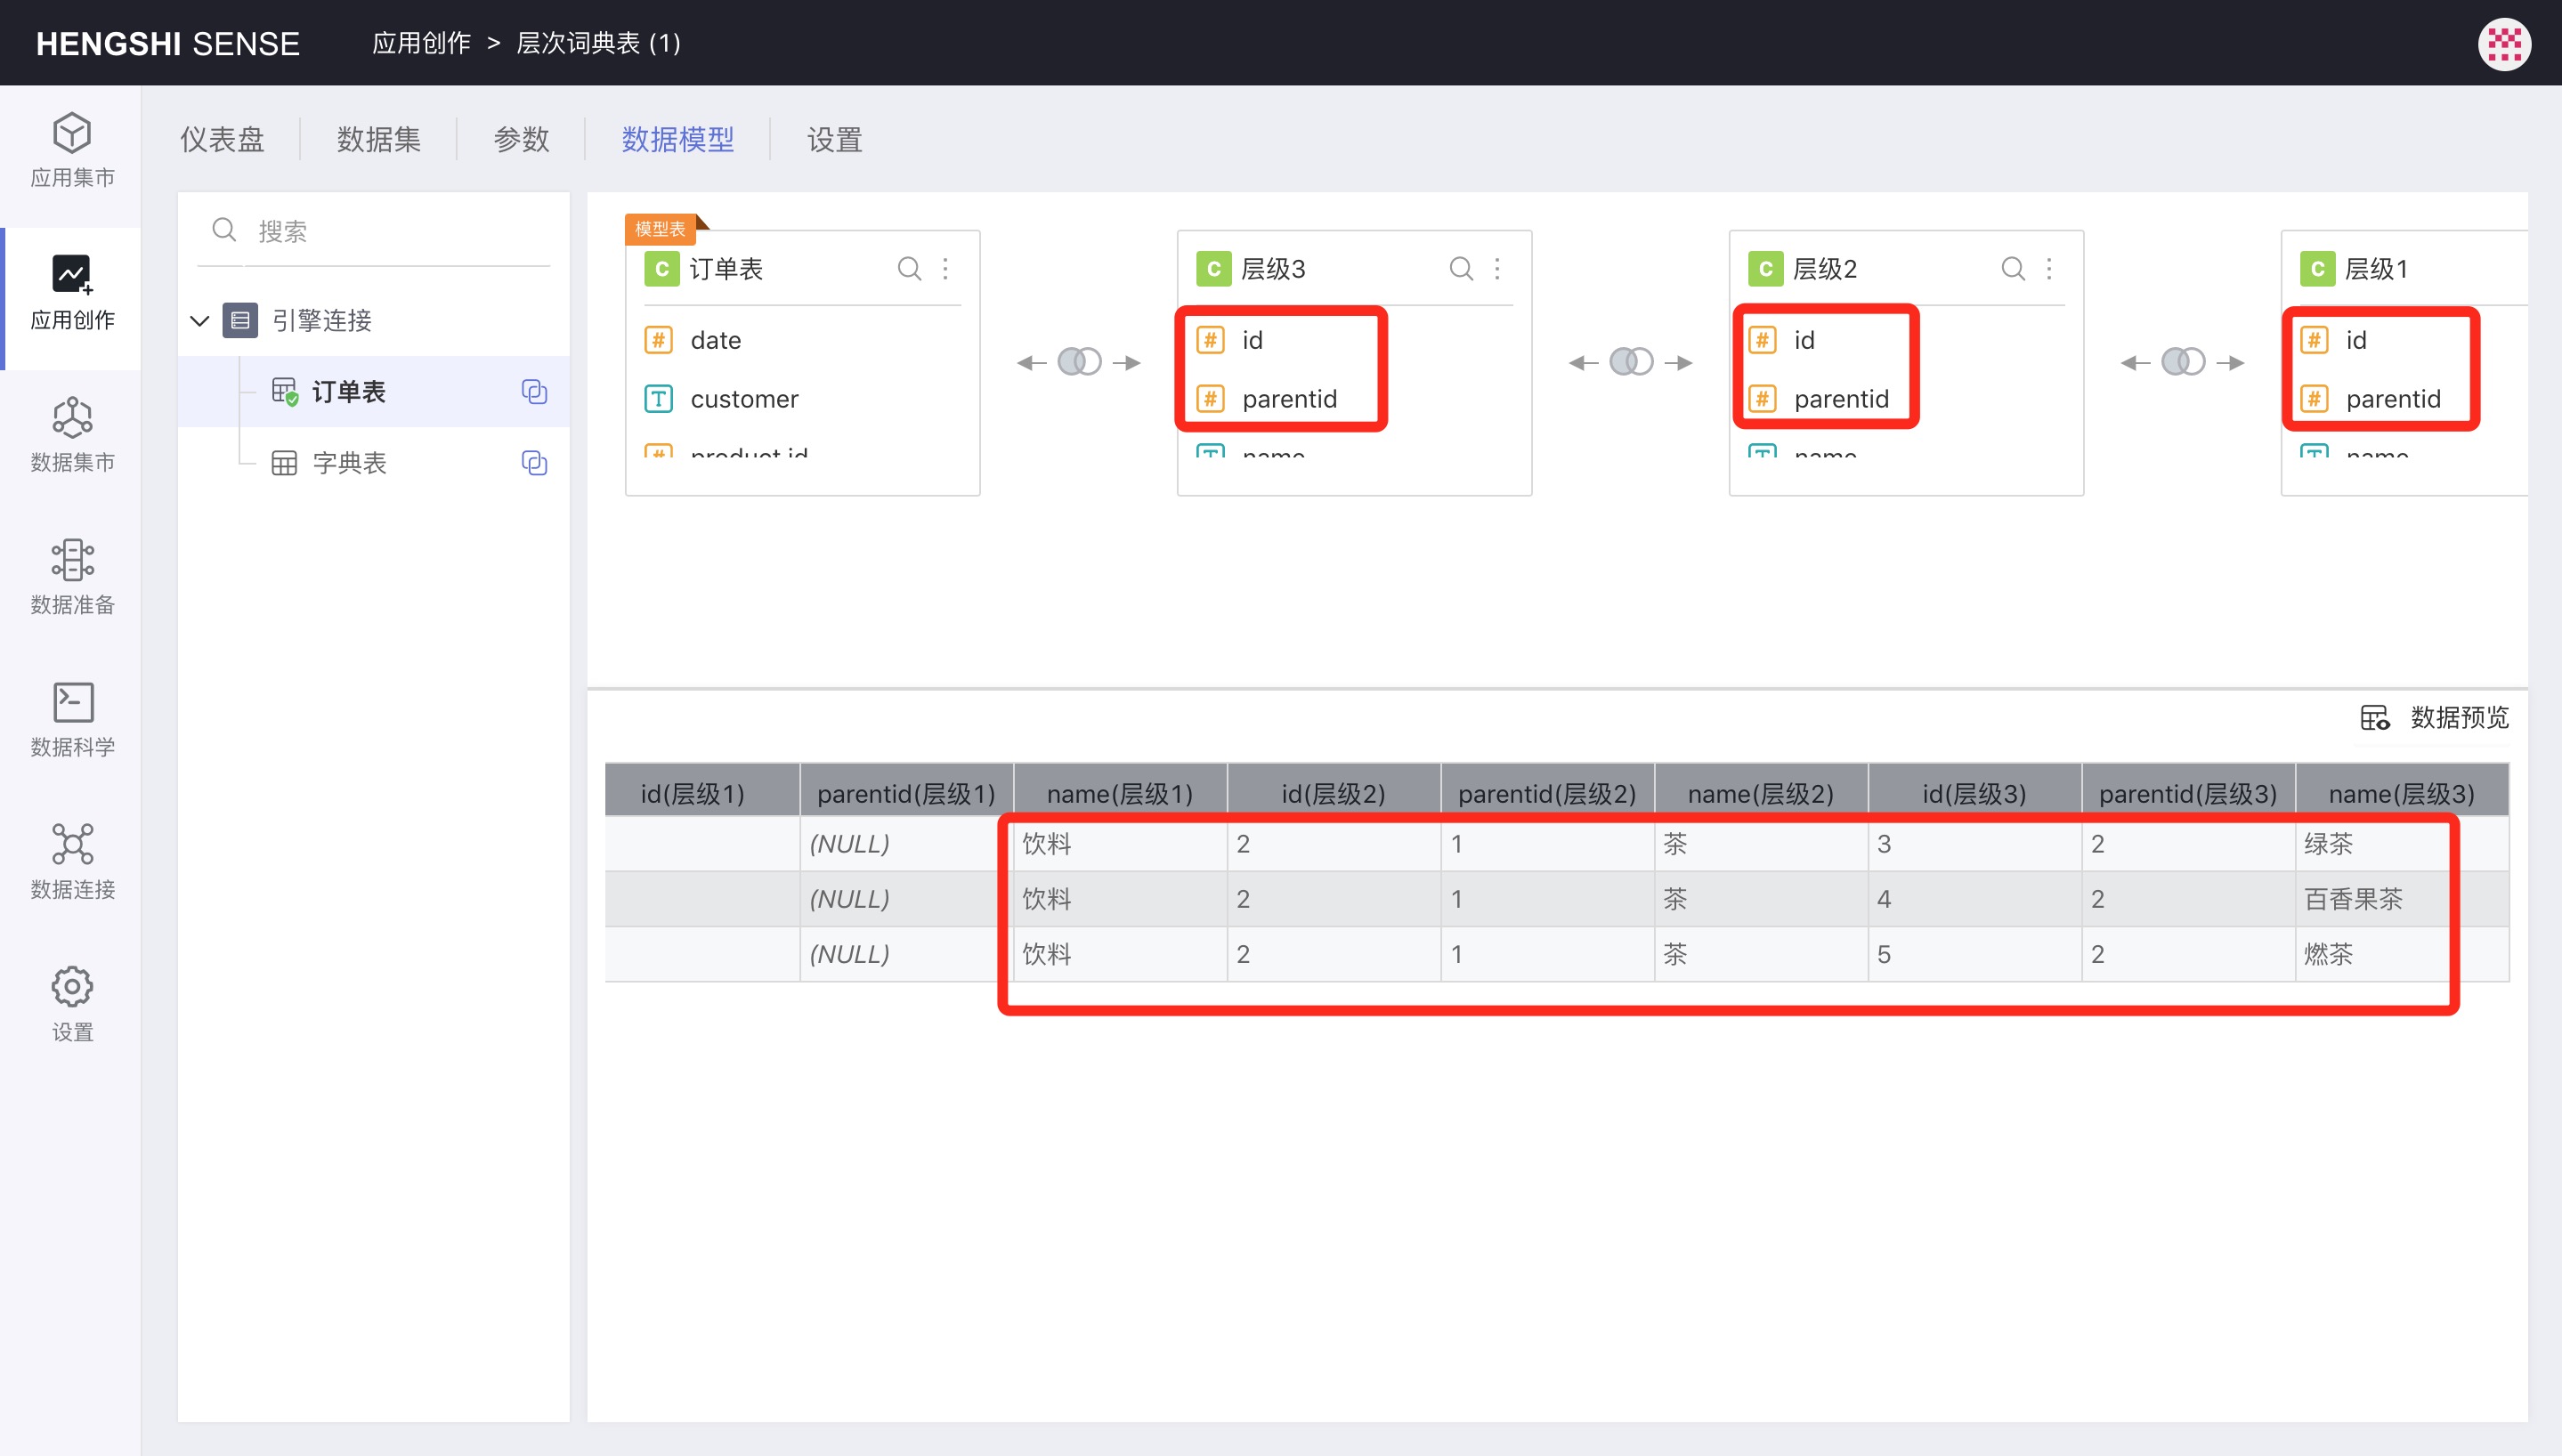
Data set reuse is mainly suitable for scenarios where dimension tables/dictionary tables self-associate to implement multiple levels, such as in an employee table where the employee manager ID and employee ID are self-associated to find out who an employee's manager is.
For instance, in the image below, levels 1, 2, and 3 are reuses of the Dictionary Table data set. They are interrelated using parentid and id to query up to the topmost parent level. They are associated with the order table, thus allowing the statistics of sales conditions at different levels.
Data Set Rename
In the data model, you can click Rename in the upper right corner of the data set to rename it. After renaming, the data set is essentially a new referenced data set, and when linking filters, it does not affect the charts made using the original data set.
Linked Filtering
As long as the data set names are the same, they will be linked for filtering.
This rule applies to linked filtering and dashboard filters.