Hengshi Documentation
Table of Contents generated with DocToc
Getting Started
Quick Guide
Creating an Admin Account
After a successful installation following the document, if the server IP where the installation is located is <Server IP> and the port is <Server Port>, you can access the Hengshi Analytics Platform through the browser at http://<Server IP>:<Server Port>/. If everything is normal, the following initialization page will be displayed:
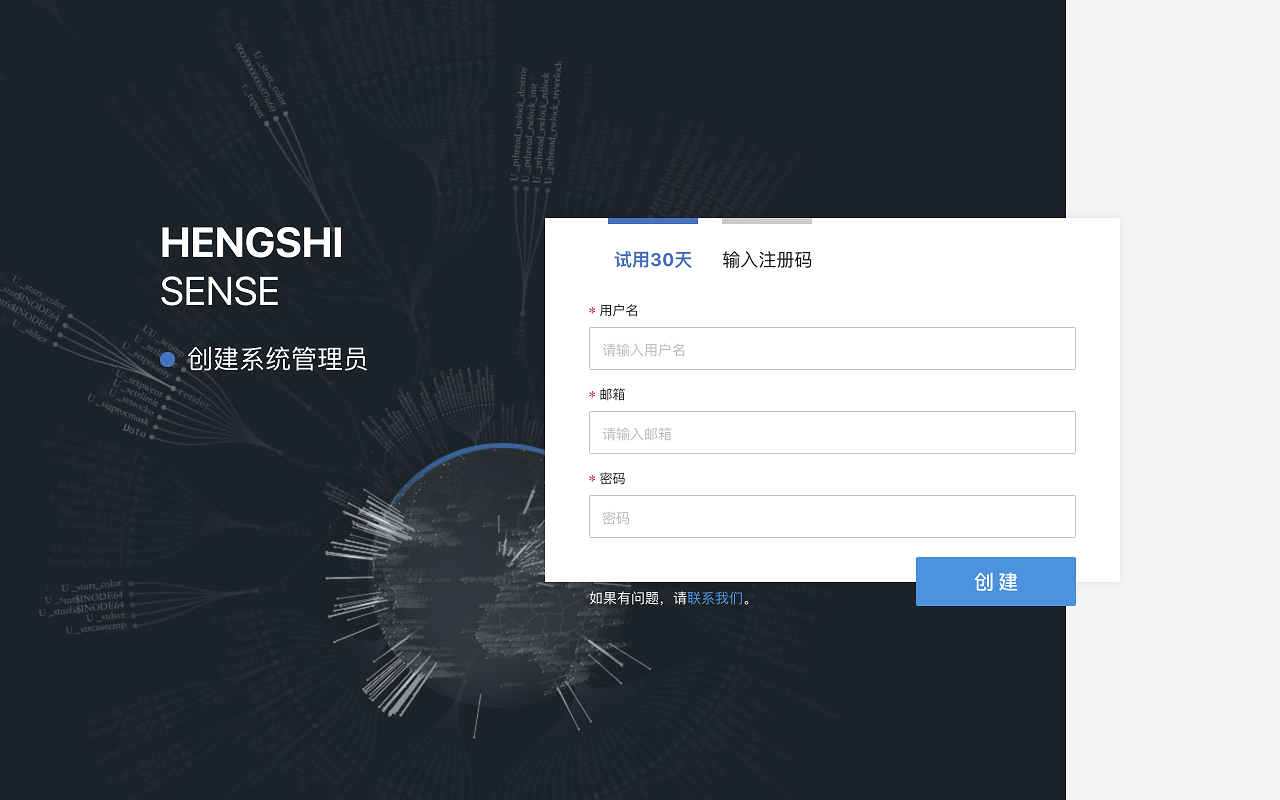
Enter Name, Email, and Password, click Create, and the creation of the admin account is complete.
Note that the system initialized on this page is only a trial system for 30 days; If you have a registration code provided by Hengshi, you can click Enter Registration Code to proceed to the following initialization page:
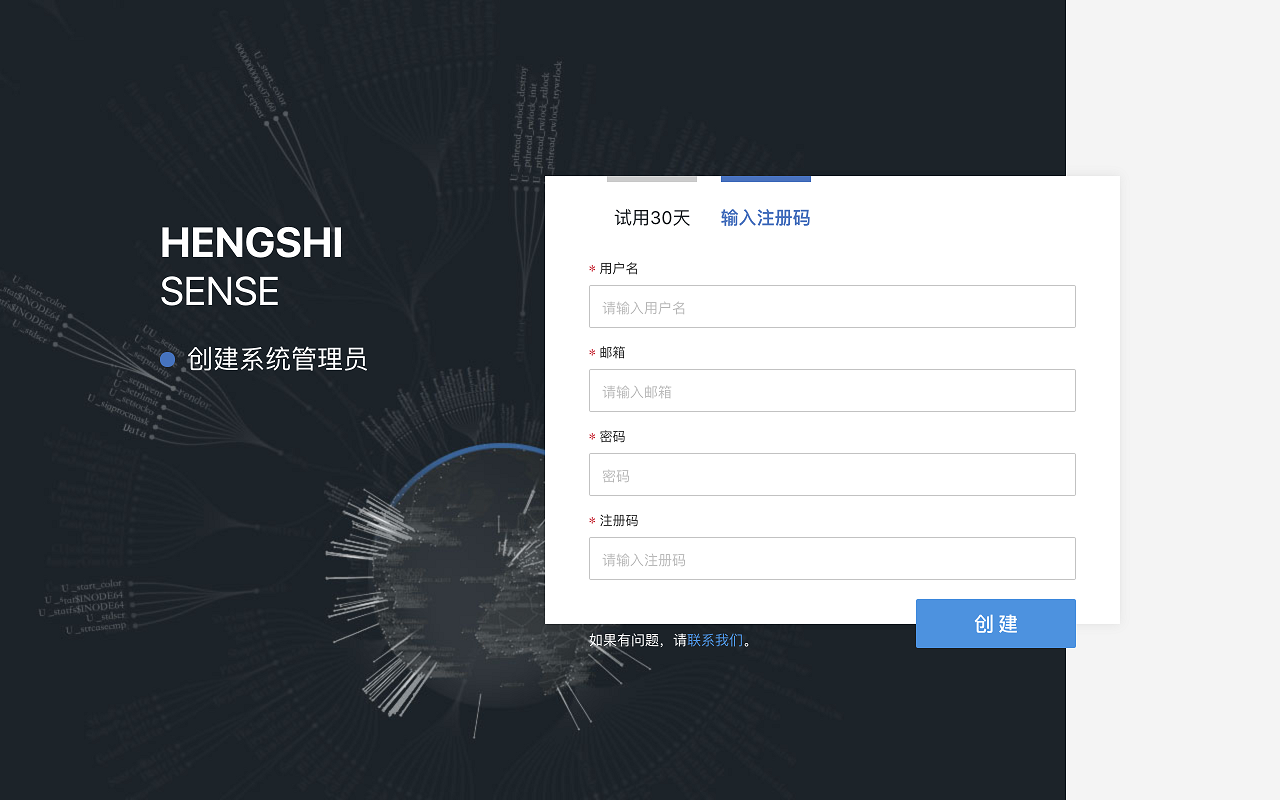
Similarly, enter Name, Email, Password, and Registration Code, then click Create.
The email address filled in here is the one used when applying for the registration code. If the registration code is verified, the system will automatically create a user with the system administrator role for this email. It is recommended to use a public email to apply for the registration code, such as it_support@your-company.com.
If you need a registration code, please contact support@hengshi.com
Logging into the System
After completing the initialization, access the login page again through
http://<Server IP>:<Server Port>/. Enter the administrator's email and password set during the Creating an Admin Account process, and log in successfully.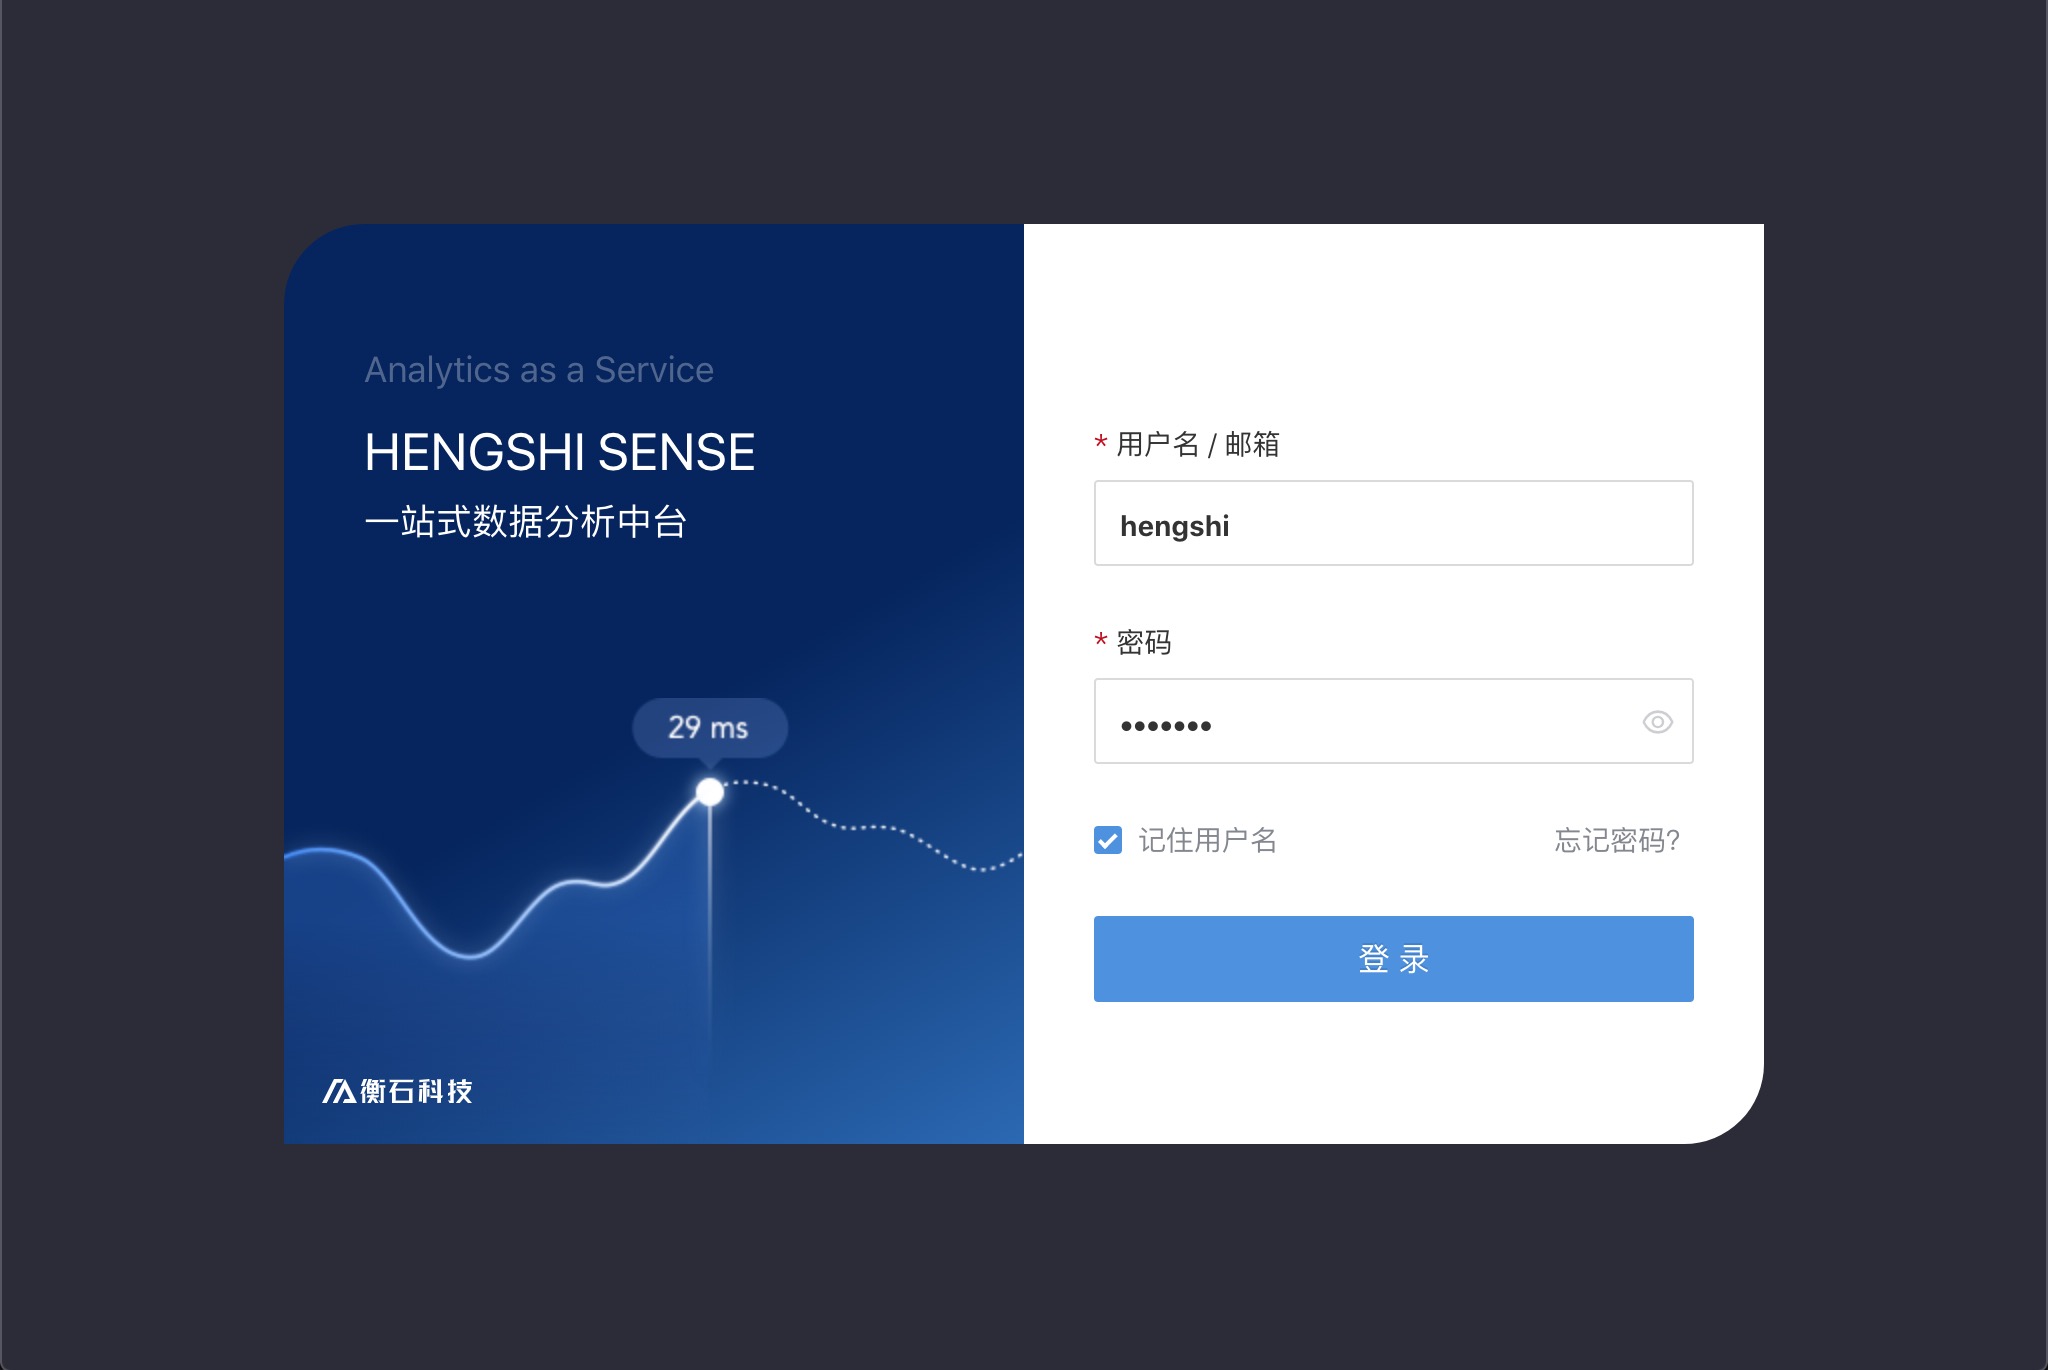
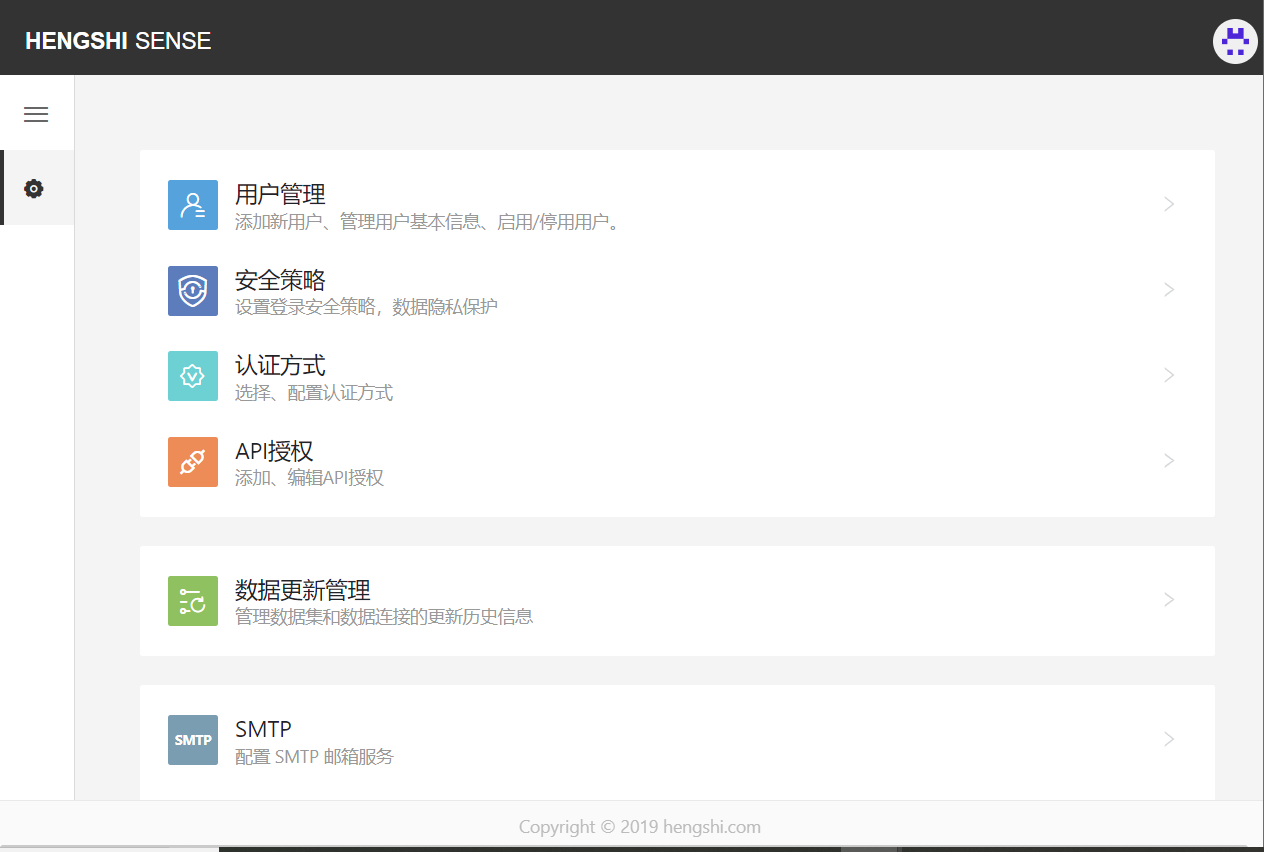
Upon the first login to the system, only the
Settingsoption is active on the left sidebar menu. This is because, in the Hengshi system, theSystem Managementrole only has permissions to modify system-related settings, while theData ManagementandData Analysisroles are able to create data connections, charts, dashboards, etc.
Creating Other Role Accounts
Below we create a user who can operate data by clicking User Management -> Add User.
Enter
Login Name,Username,Email, note theInitial Password, select the user'sUser Group(the default user role isData Analysis), and clickAddto complete the account creation. Each user can belong to multiple user groups.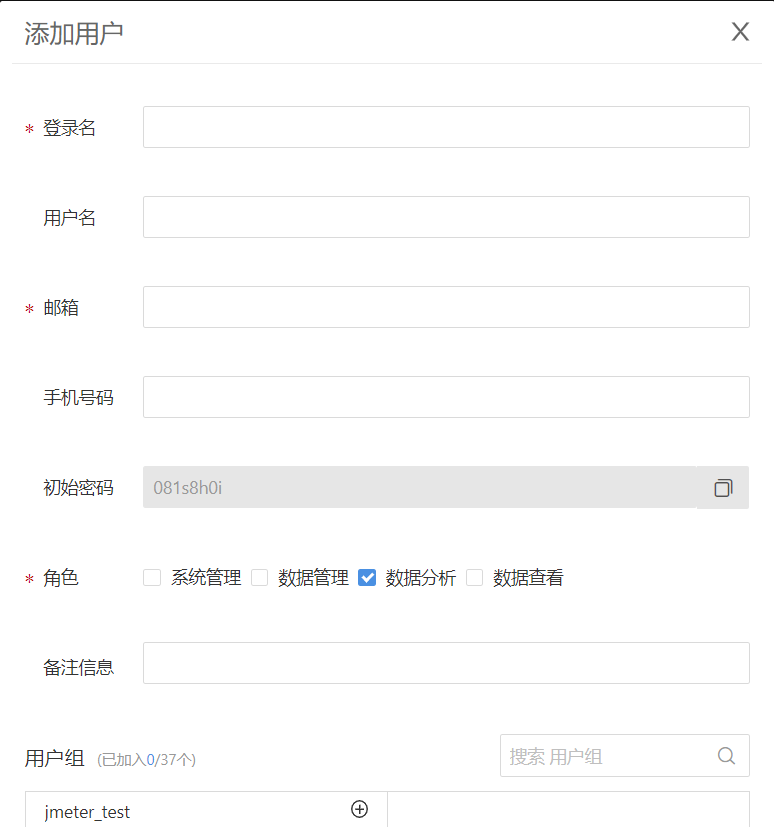
For detailed user permissions, refer to
User Management
Analyzing Data
- Log in using the data analyst's account at
http://<Server IP>:<Server Port>/.
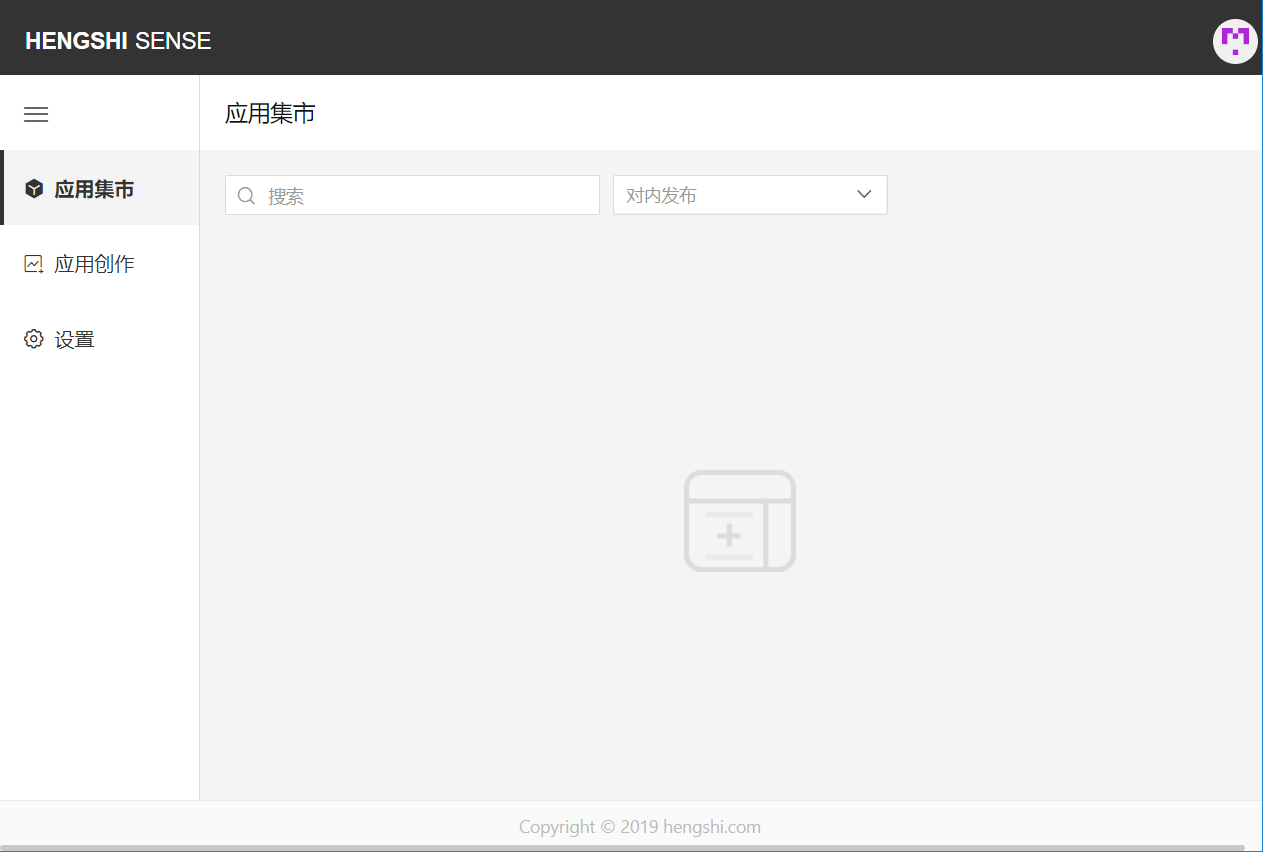
- Click on
Application Creationto enter the workspace. - Create an application.

- Click on
Data Sets->Create a New Data Set. ClickLocal Fileto upload a data file. ClickNextstep by step.
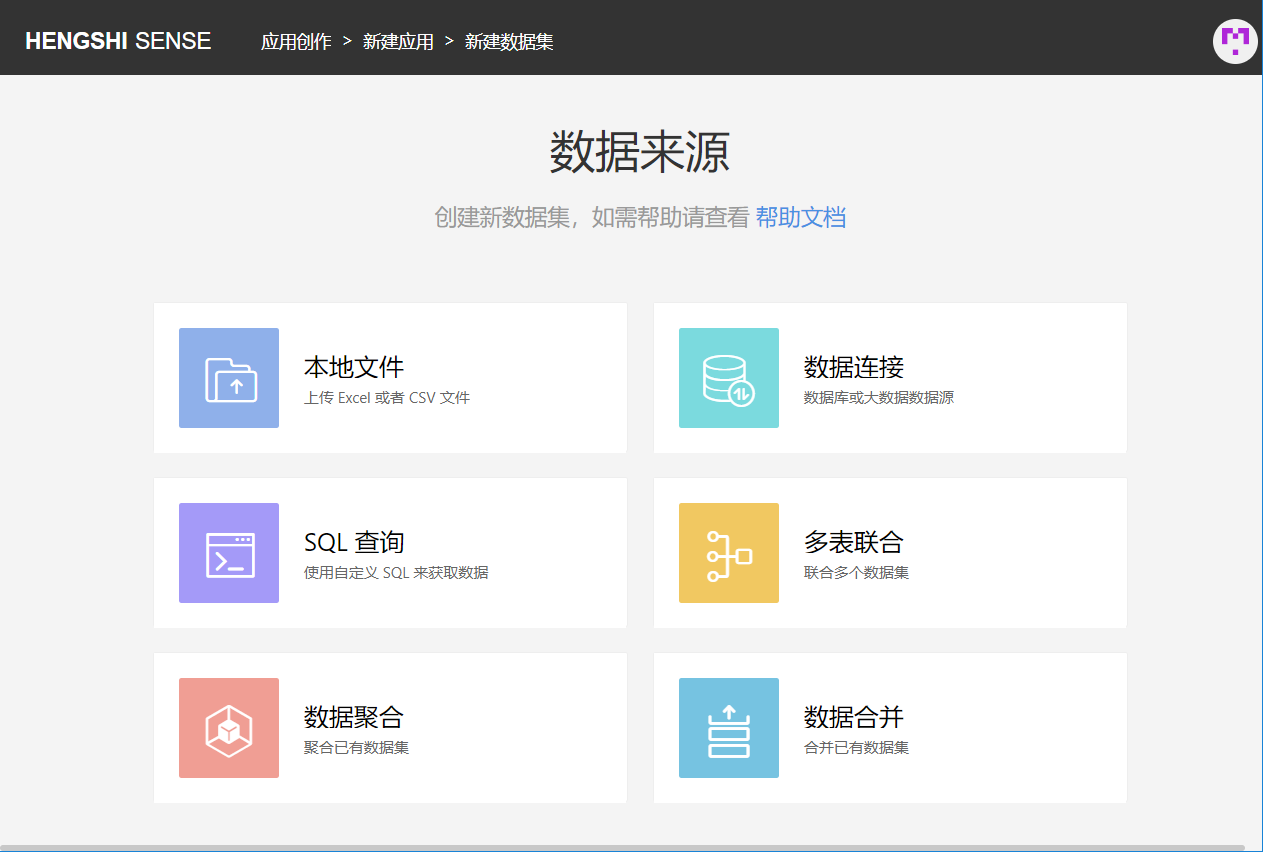
You can use our sample files: Douban TOP250 movie data or 2016 Global Top 200 Pharma Sales Sample Data
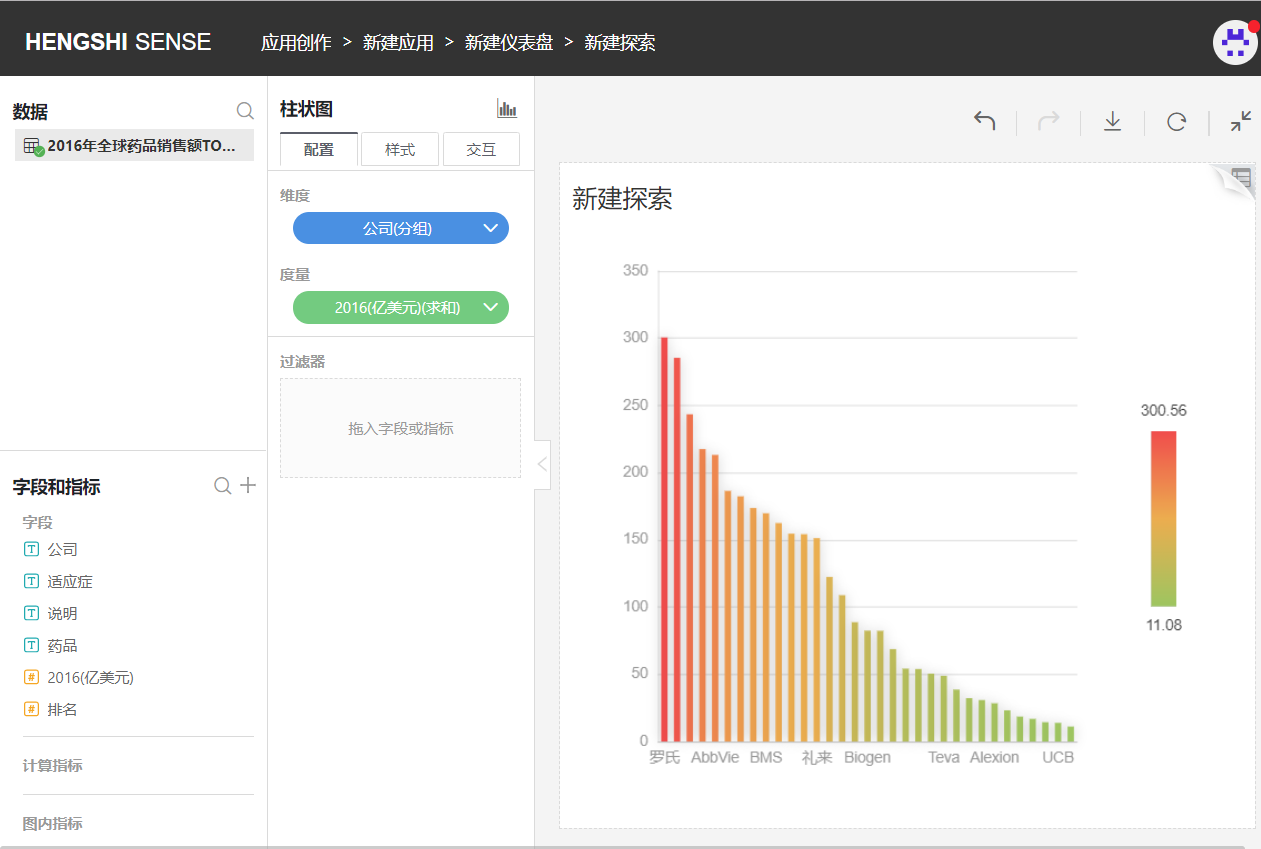
- Click
Dashboard->Create Dashboard, choose to create aNormal DashboardorAdvanced Dashboard, then select and create charts. ChooseBar Chart, drag and dropDimensionsandMetricsto the designated areas. The system will automatically generate the report.
- For details, refer to Data Set Interface Operation Instructions, Chart Exploration Interface Interaction Instructions, and Dashboard.
Product Usage Instructions
- First read the Overall Product Introduction
- Then read User Management to create a user
- Then read Data Set Interface Operation Instructions, and then try Uploading Files or Connecting to a MySQL Database to import data
- Finally, read the Chart Interface Interaction Instructions to explore various charts, and the completed charts can be placed in the Dashboard for sharing and collaboration