Hengshi Documentation
Table of Contents generated with DocToc
- Area Chart
- Stacked Area Chart
- Percentage Stacked Area Chart
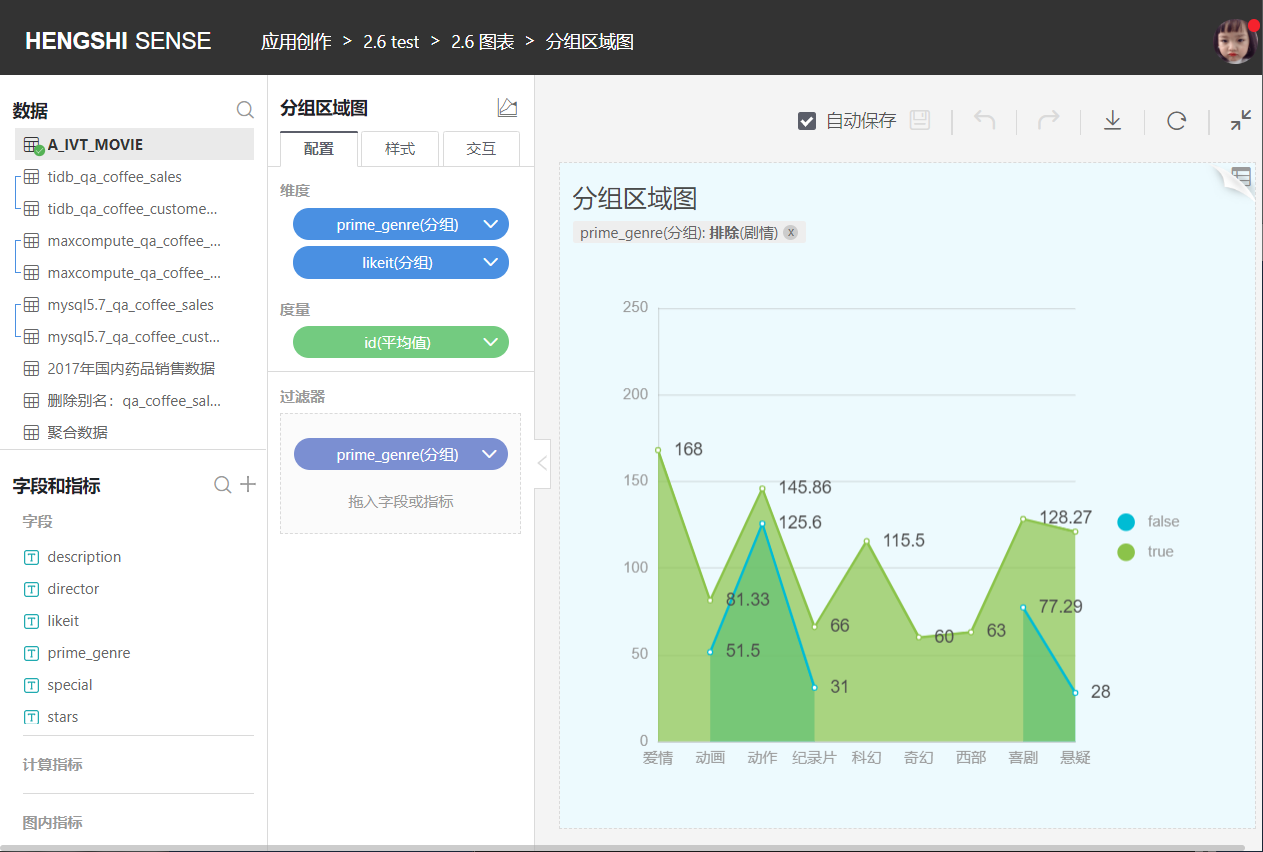
- Grouped Area Chart
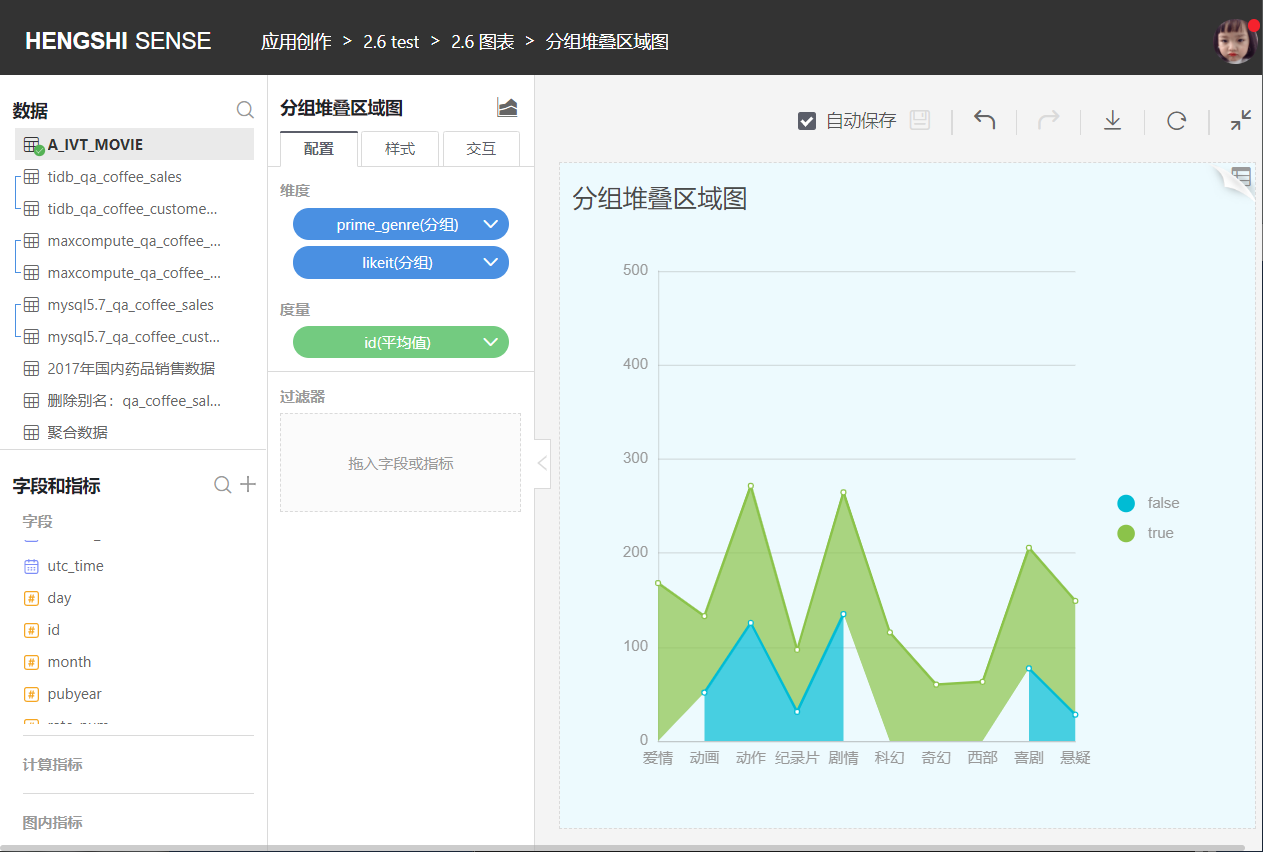
- Grouped Stacked Area Chart
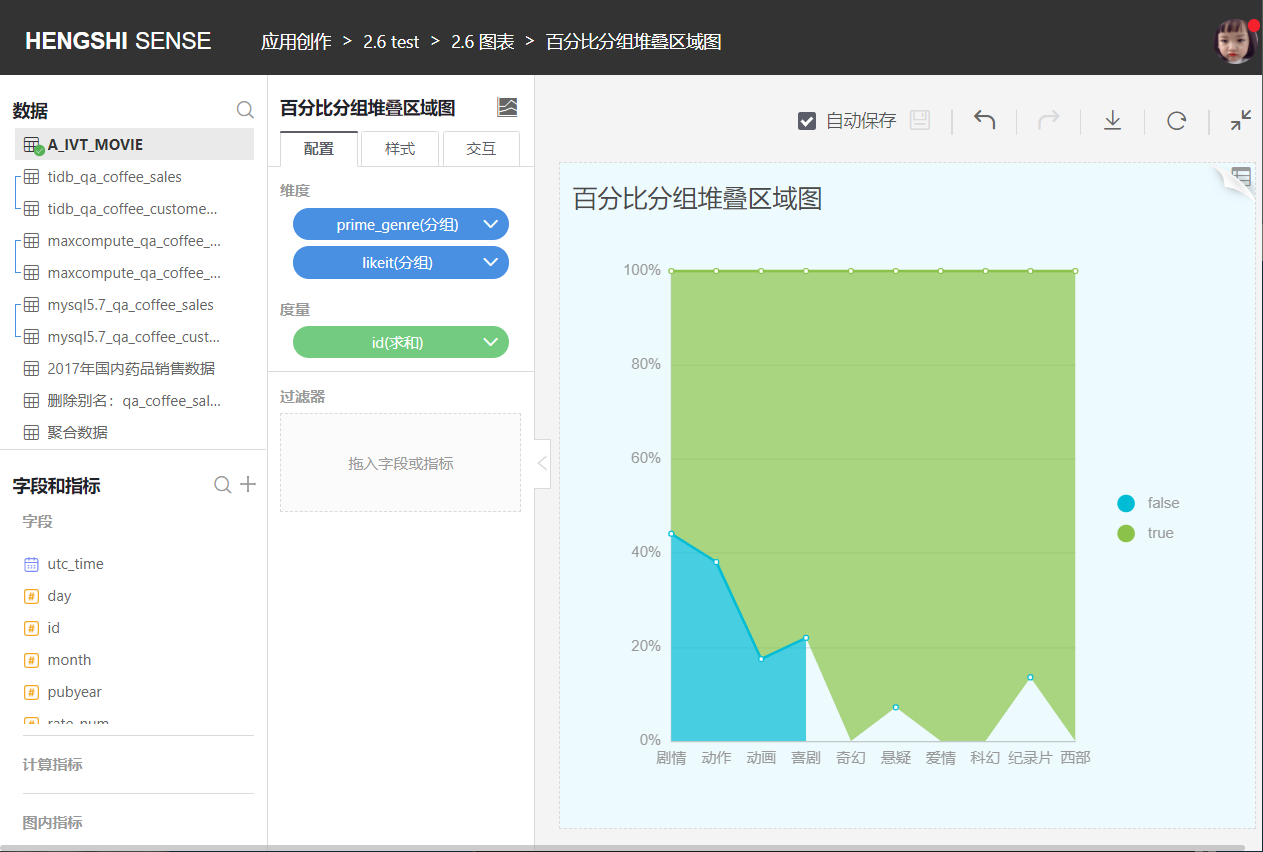
- Percentage Grouped Stacked Area Chart
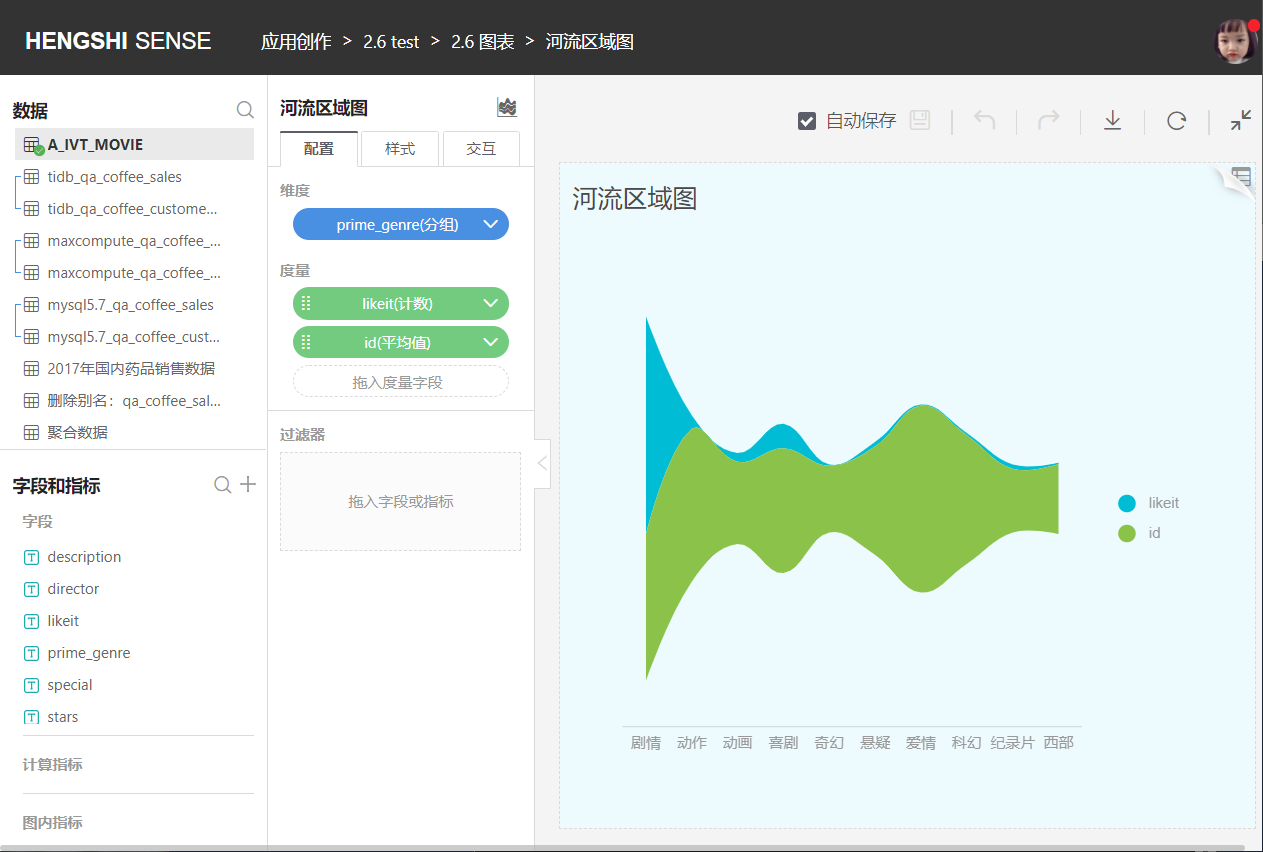
- Streamgraph (River Area Chart)
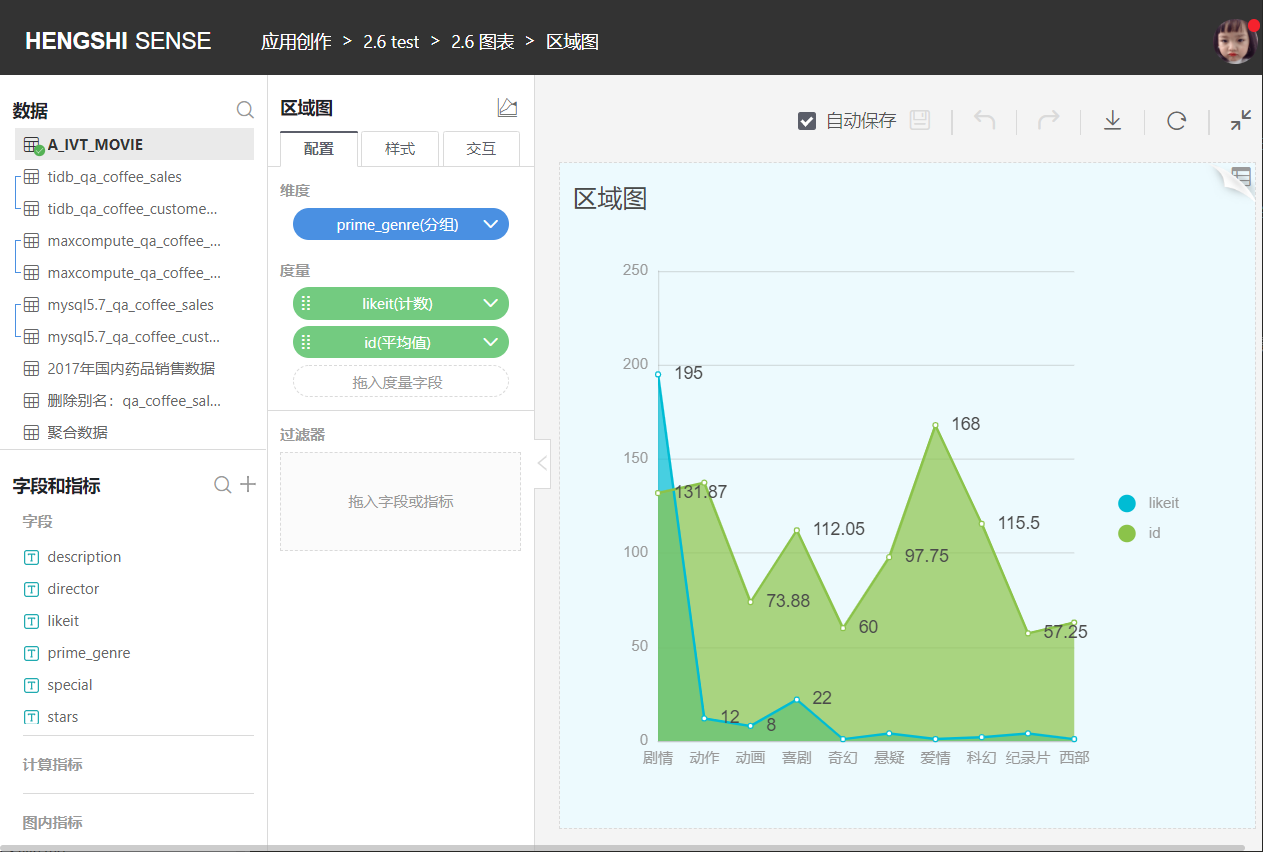
Area Chart
An area chart is a type of line chart where the area between the line and the axis is shaded with color. These charts are typically used to represent cumulative totals over time and are a convenient way to show stacked lines.
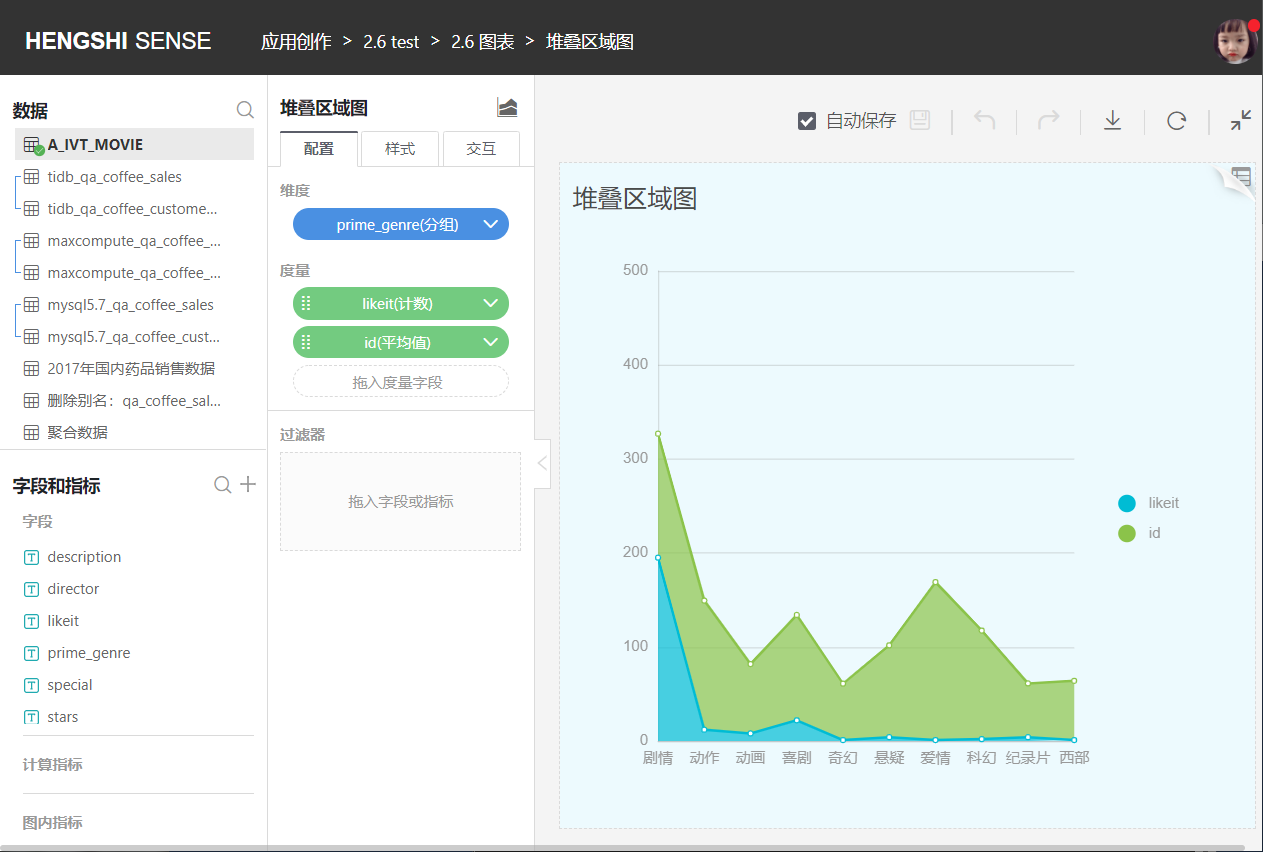
Stacked Area Chart
In a stacked area chart, each data layer is drawn on top of the previous one.
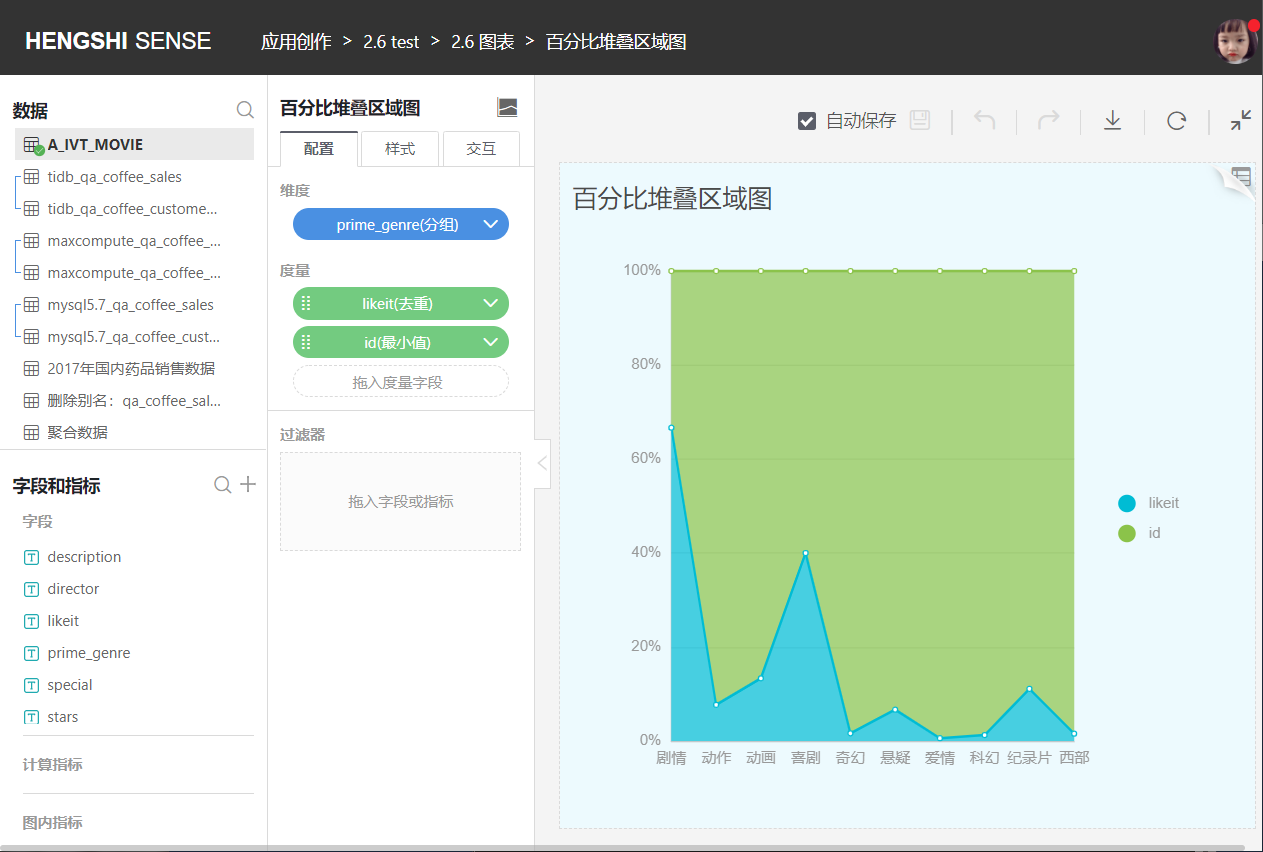
Percentage Stacked Area Chart
Grouped Area Chart
Grouped Stacked Area Chart
Percentage Grouped Stacked Area Chart
Streamgraph (River Area Chart)