Hengshi Documentation
Table of Contents generated with DocToc
- Field Management
- Create New Field
- Expression
- Column Value Grouping
- JSON Splitting
- Change Field Type
- Change Field Name
- Batch Change Field Names
- Batch Naming Using Original Field ID
- Batch Naming Using Original Field Description
- Download Batch Naming Template
- Upload Batch Naming Template
- Numeric Display Format
- Number of Decimal Places
- Numeric Units
- Prefix/Suffix
- Display Thousands Separator
- Display as Percentage
- Display as Scientific Notation
- Reset
- Apply
- NULL Replacement
- Set Visibility
- Field Sorting
- Date Parsing
Field Management
Open the dataset and click the Field Management tab.
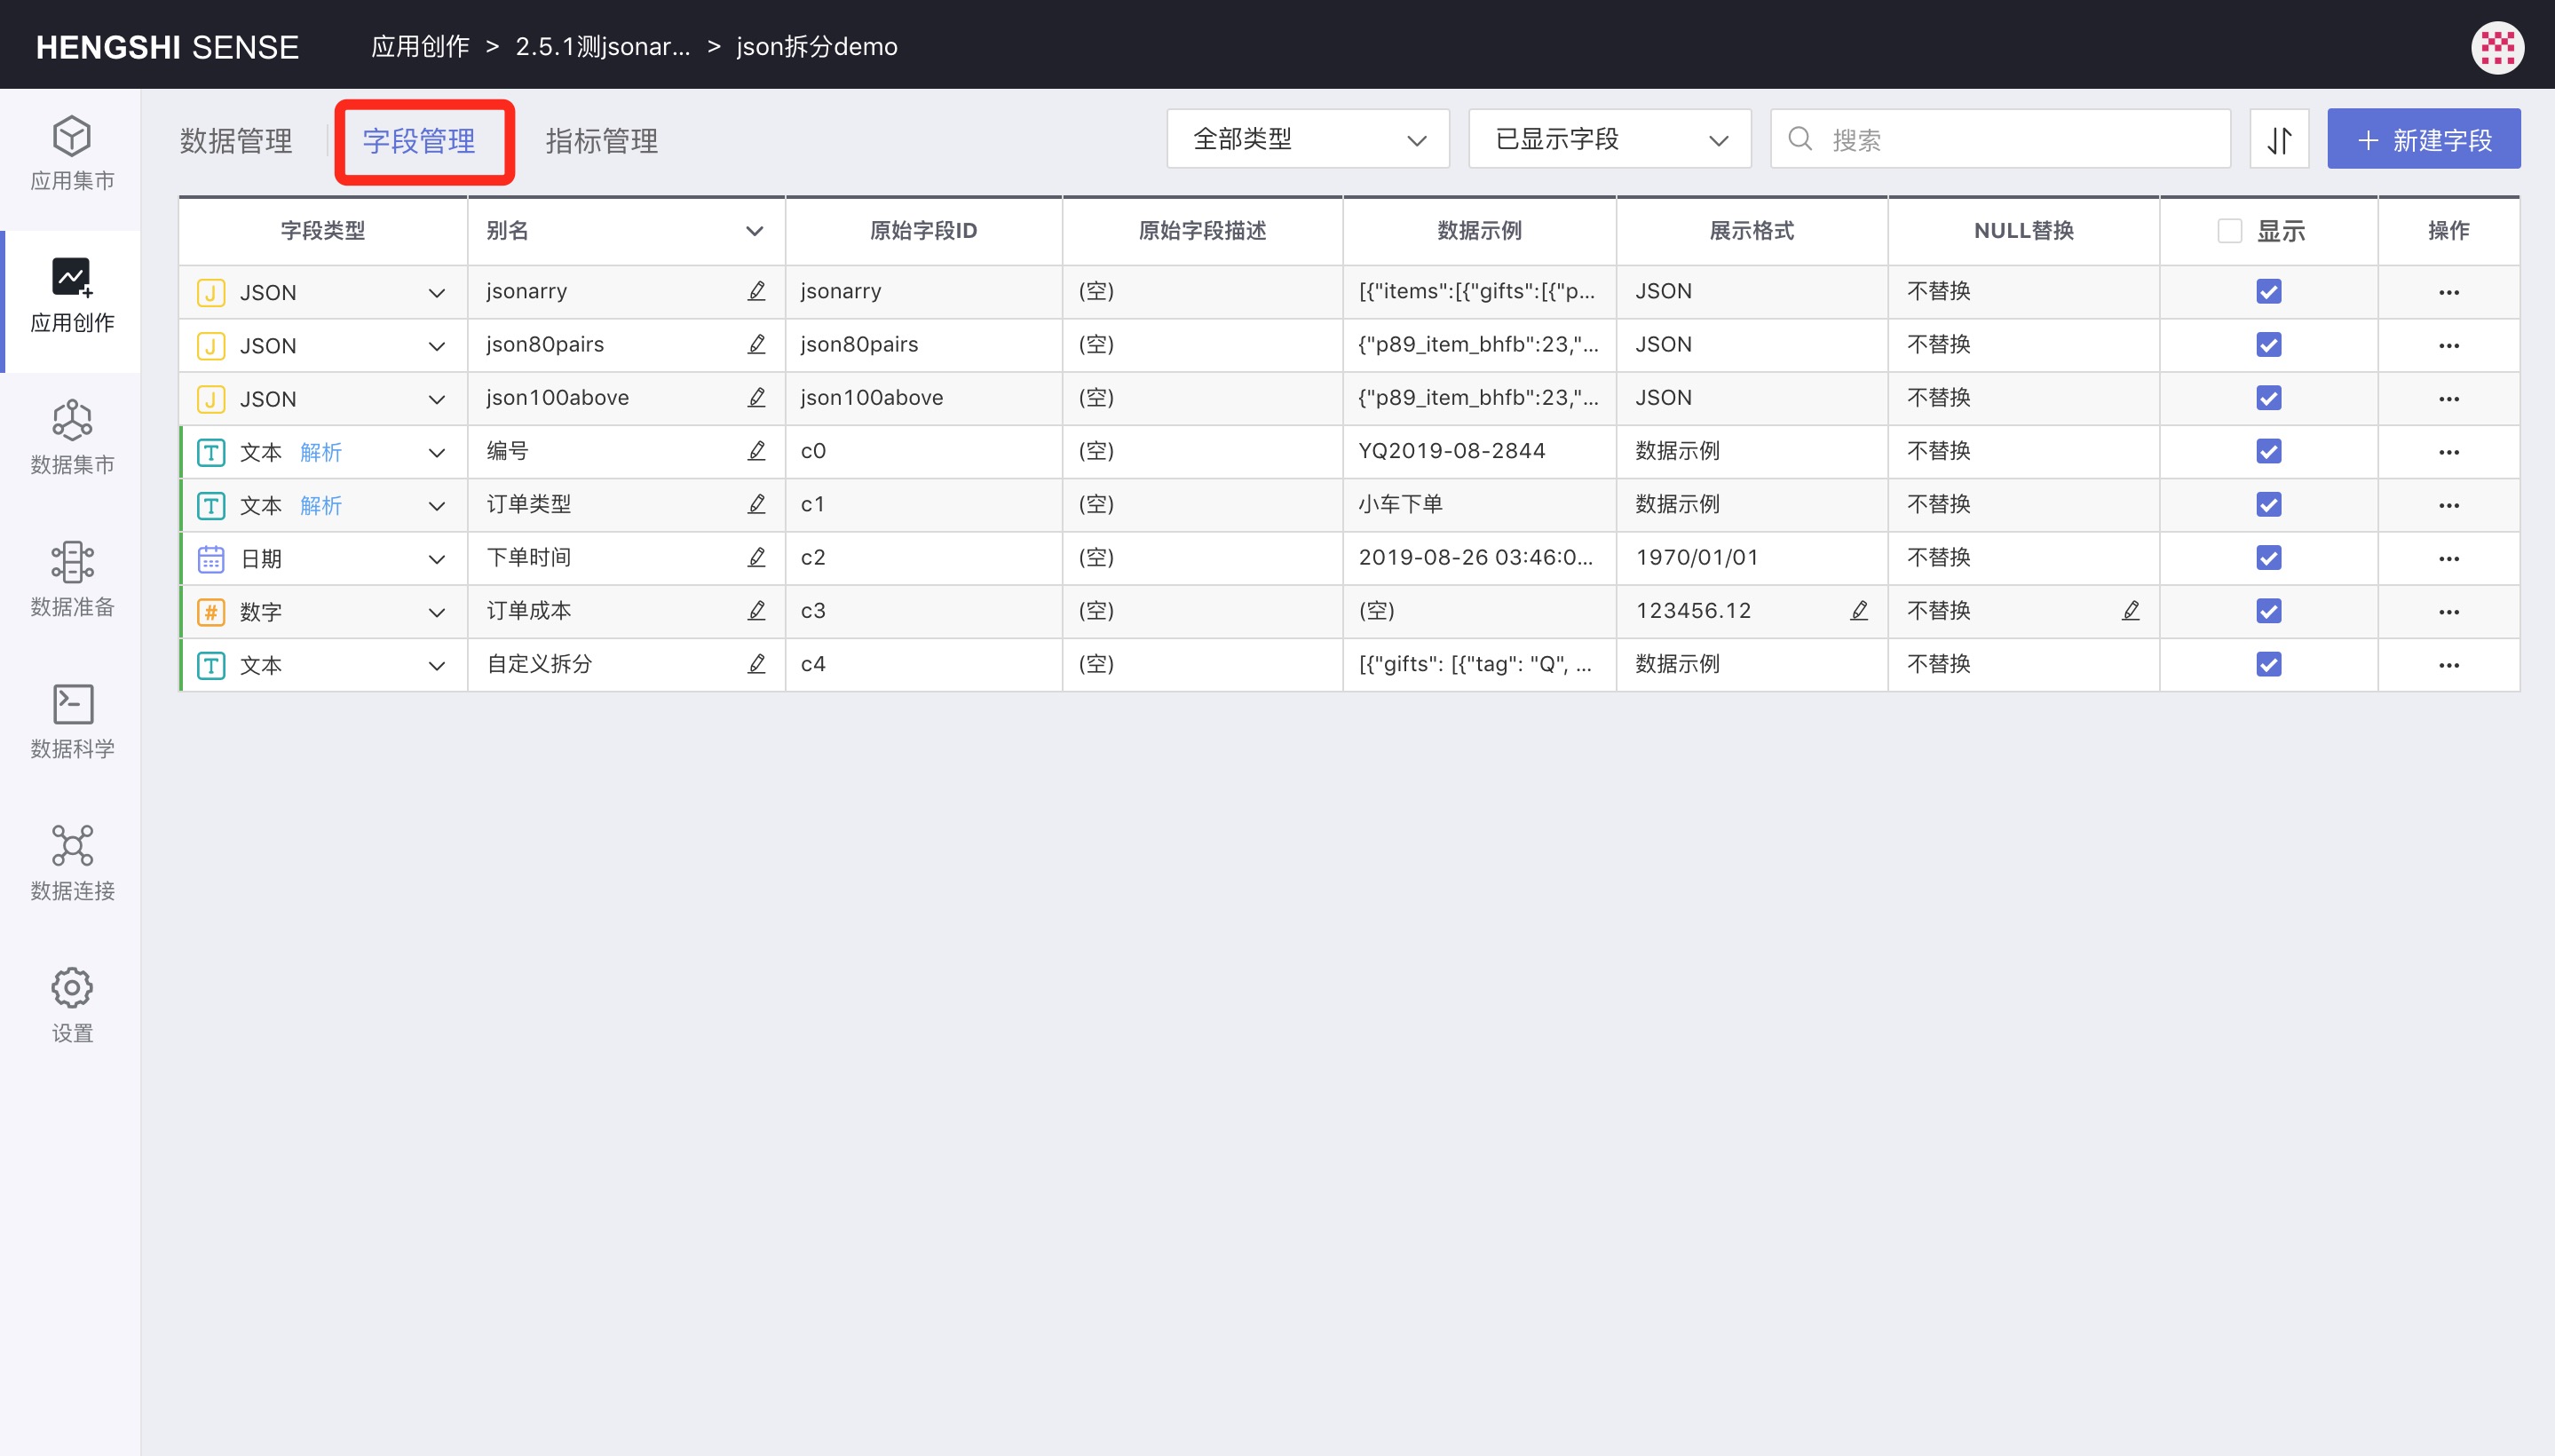
On this page, you can:
- Create a new field
- Change the field type
- Change the field name
- Batch change field names
- Set numeric display format
- Replace NULL
- Set visibility
- Sort fields
Create New Field
There are three ways to create a new field:
- Expression
- Column value grouping
- JSON splitting
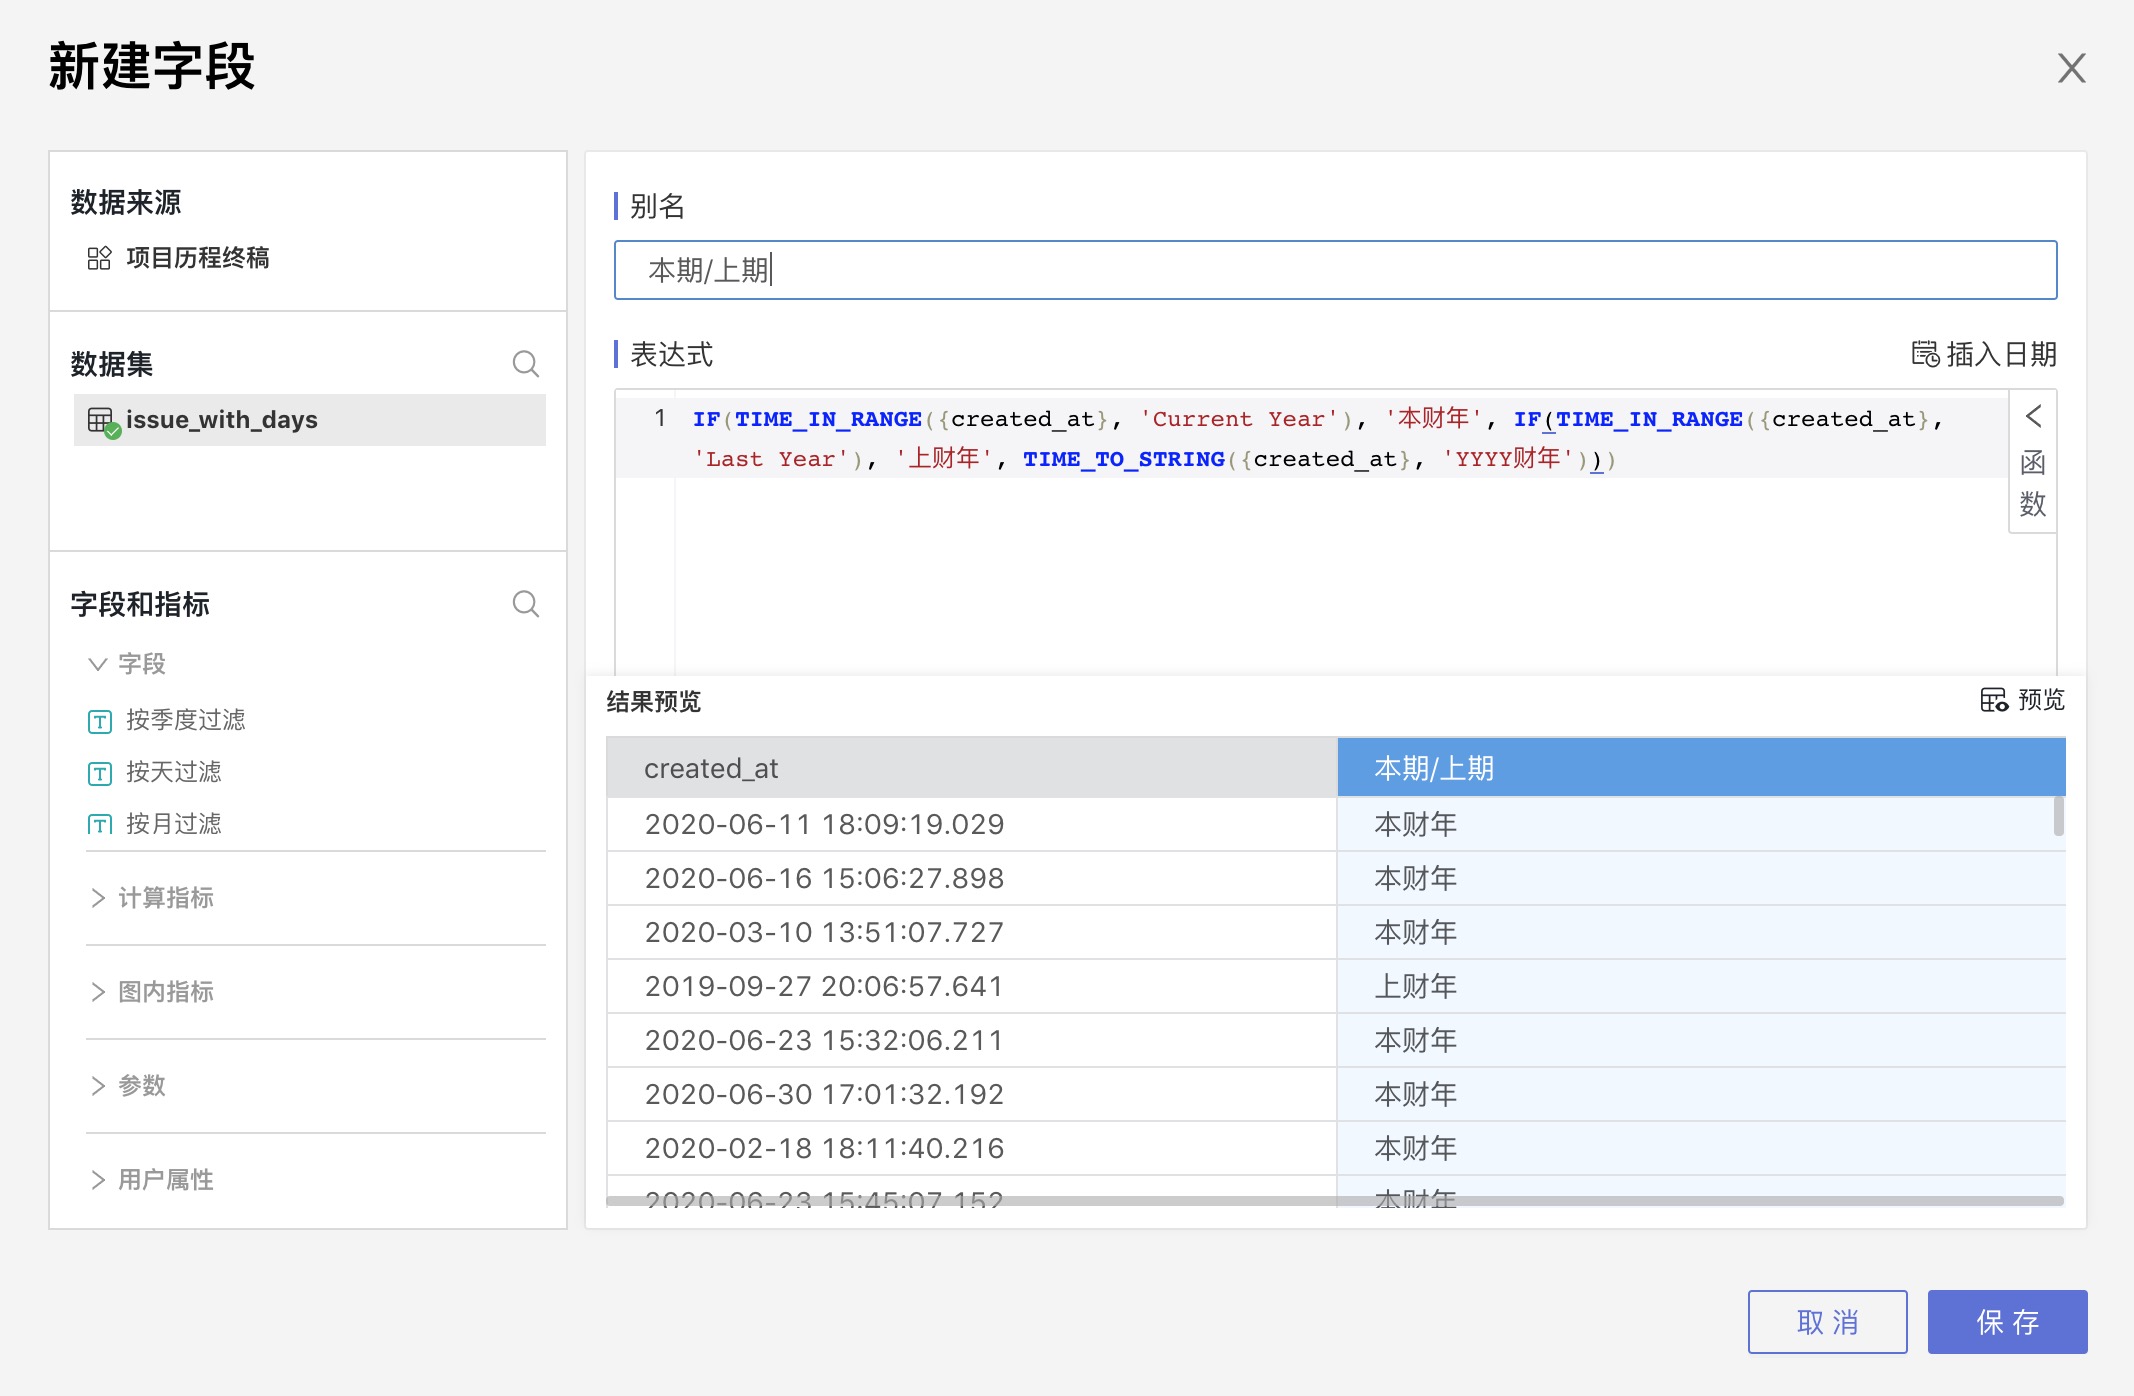
Expression
Open the dataset, switch to the Field Management tab, and click Create New Field.
Enter the field Alias, and you can enter fixed values or use various functions to write complex expressions in the expression box. The field type is automatically determined by the return type of the expression.
During the expression input process, click on the fields/parameters/user attributes on the left, and the selected fields/parameters/user attributes will automatically jump to the cursor position in the expression.
Expand the function list in the top right corner of the expression box, hover over a function, and click the help icon to view the function description. Click on a function to jump it to the expression window area.
After entering the expression, click Preview in the lower-right corner to view the results of the expression. You can adjust the size of the upper and lower windows by dragging the middle separator.
Column Value Grouping
In field management, click the three-dot menu of a field to pop up Column Value Grouping.
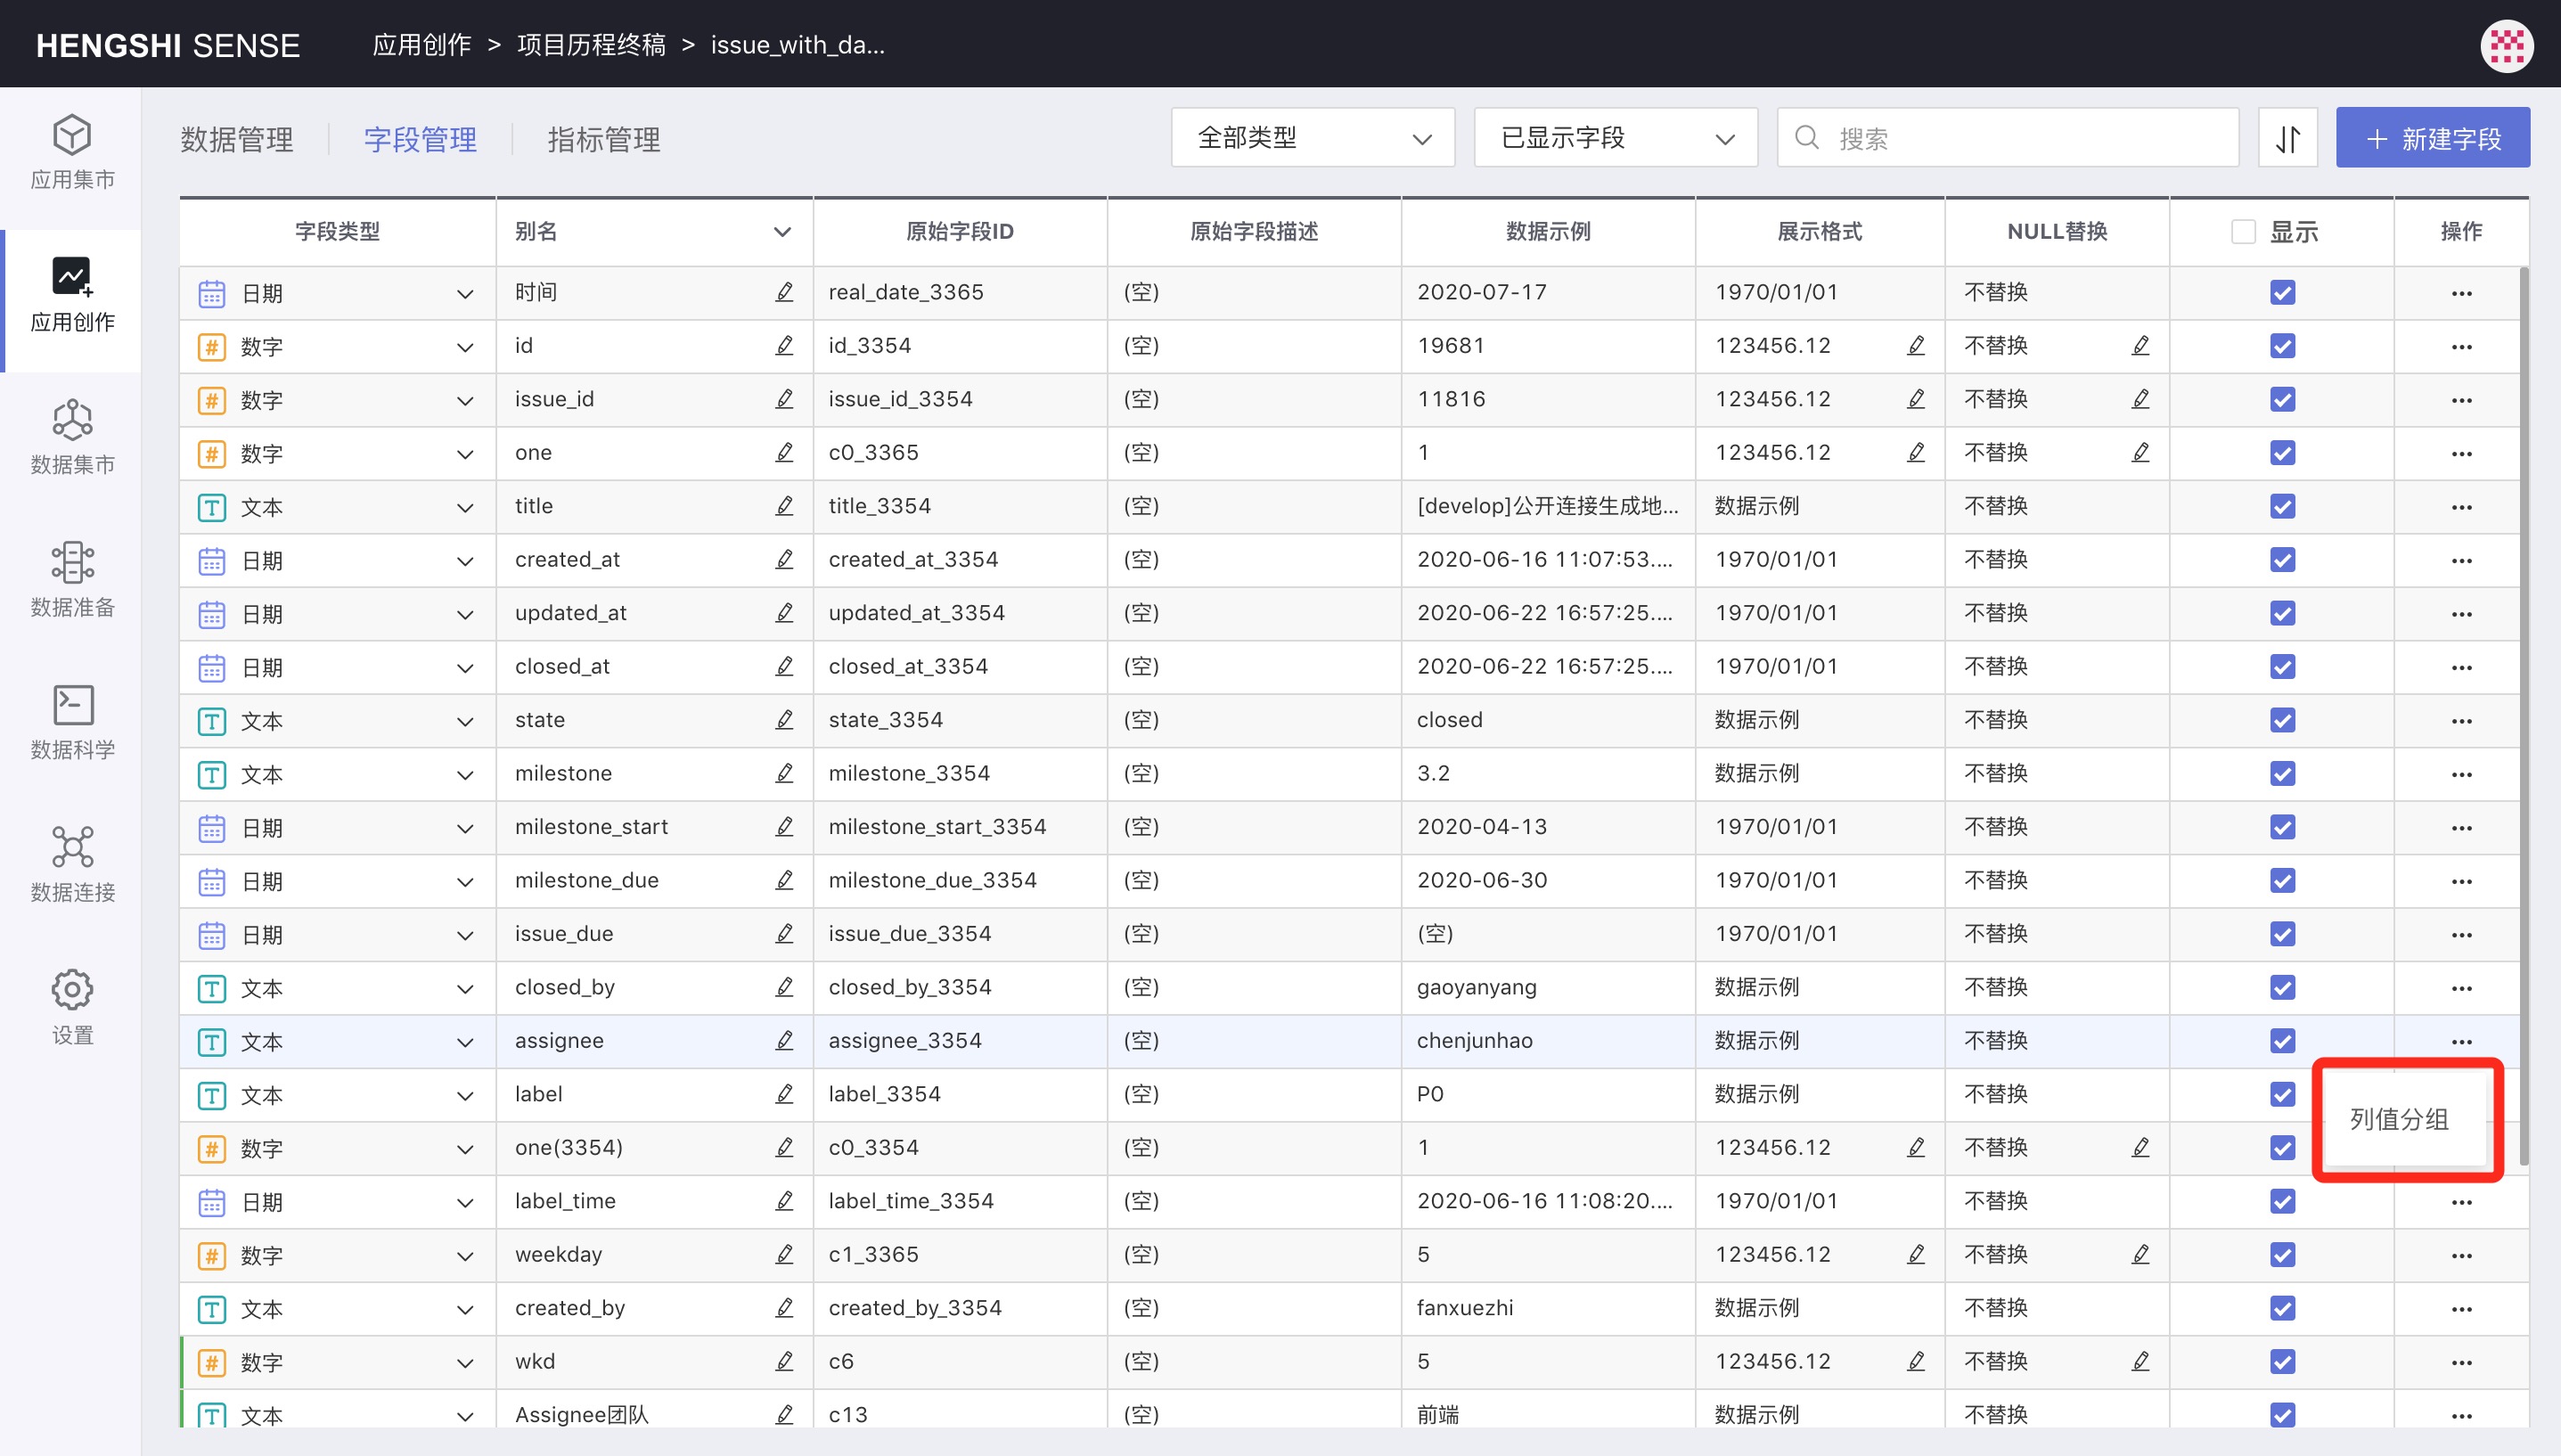
Click Column Value Grouping to open the column value grouping window.
Column value grouping is divided into "Discrete Value Group" and "Continuous Value Group", with selectable parameters including text, numbers, and dates; currently, text only supports discrete value grouping, dates only support continuous value grouping, and numbers support both.
Discrete Value Group
Discrete value grouping requires creating a new group.
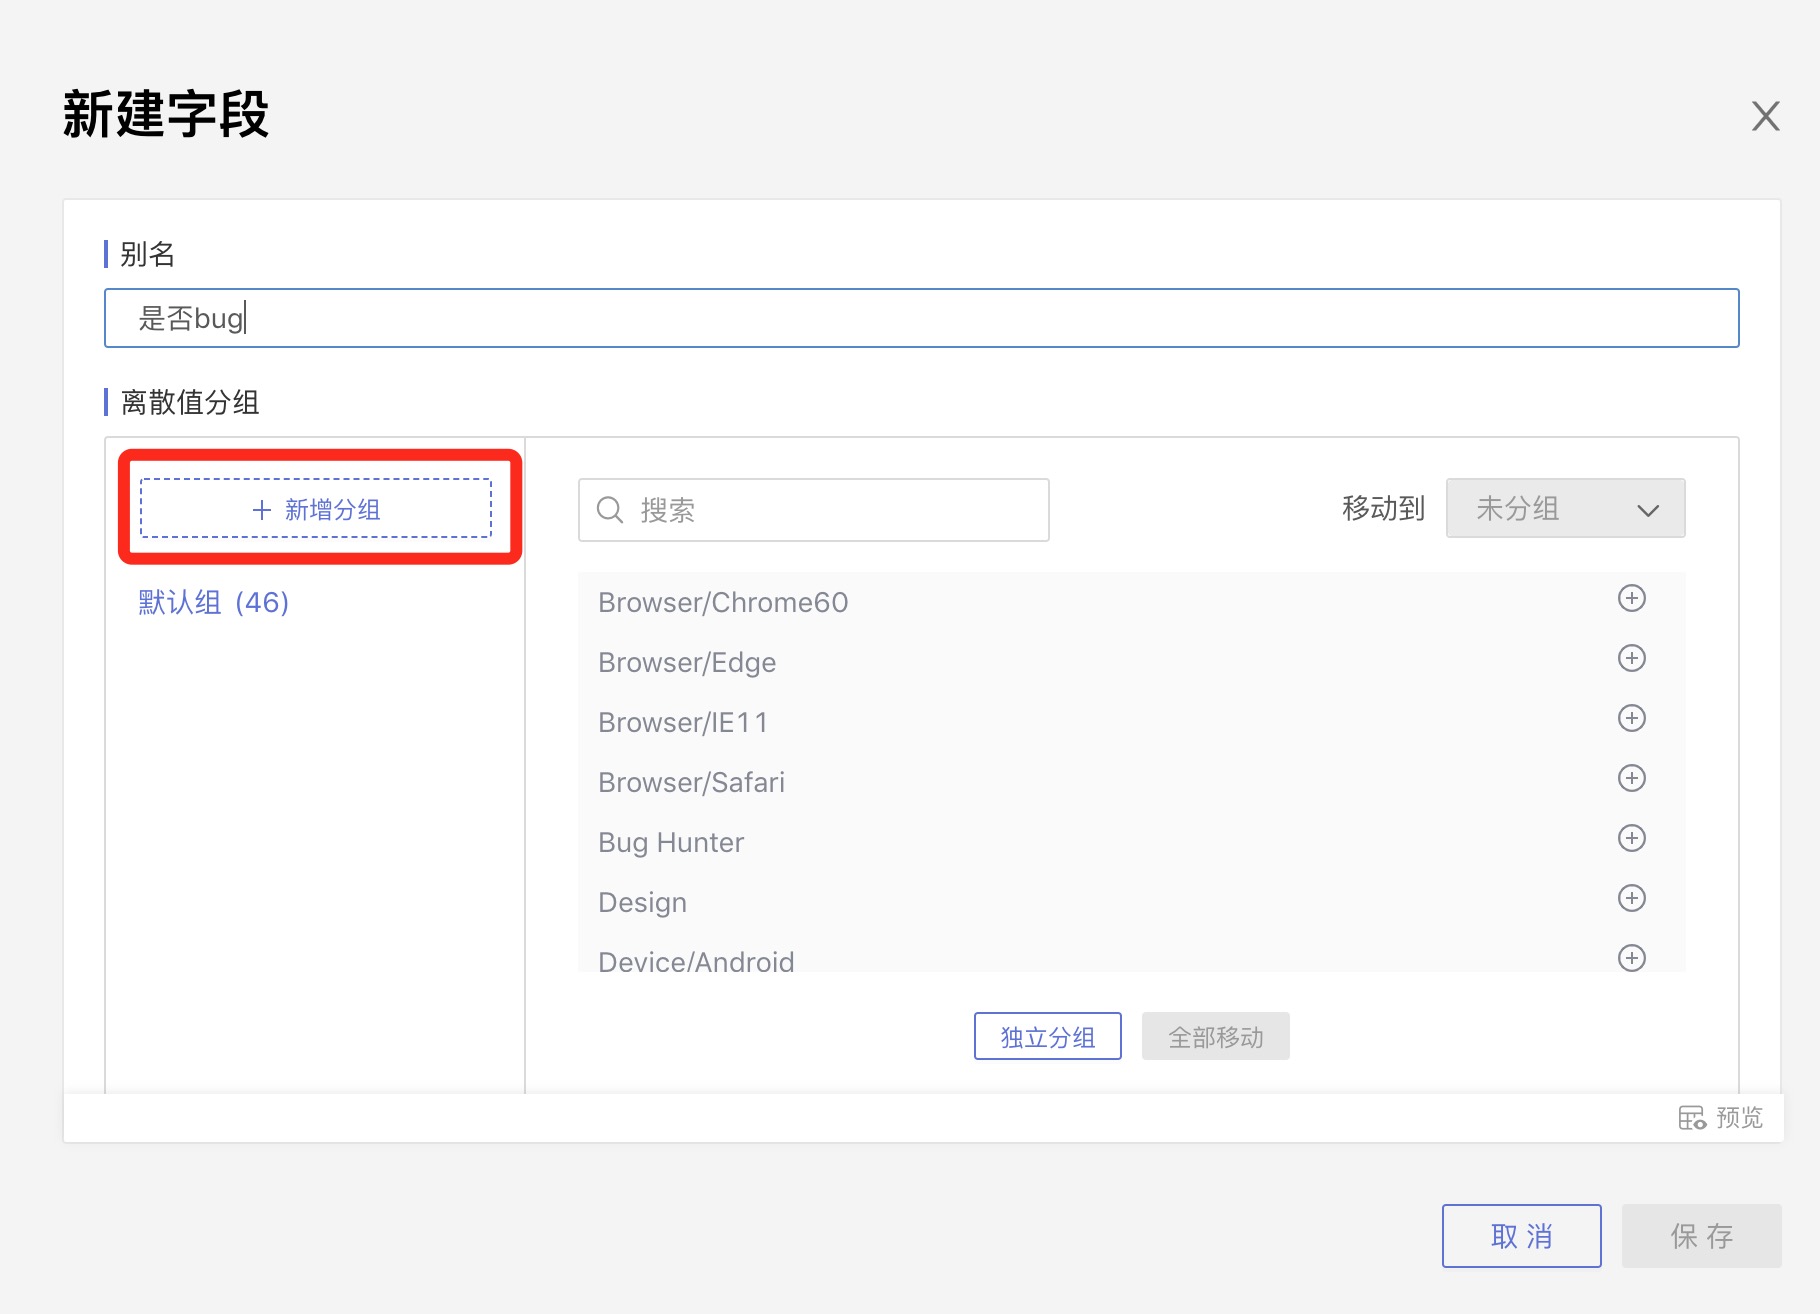
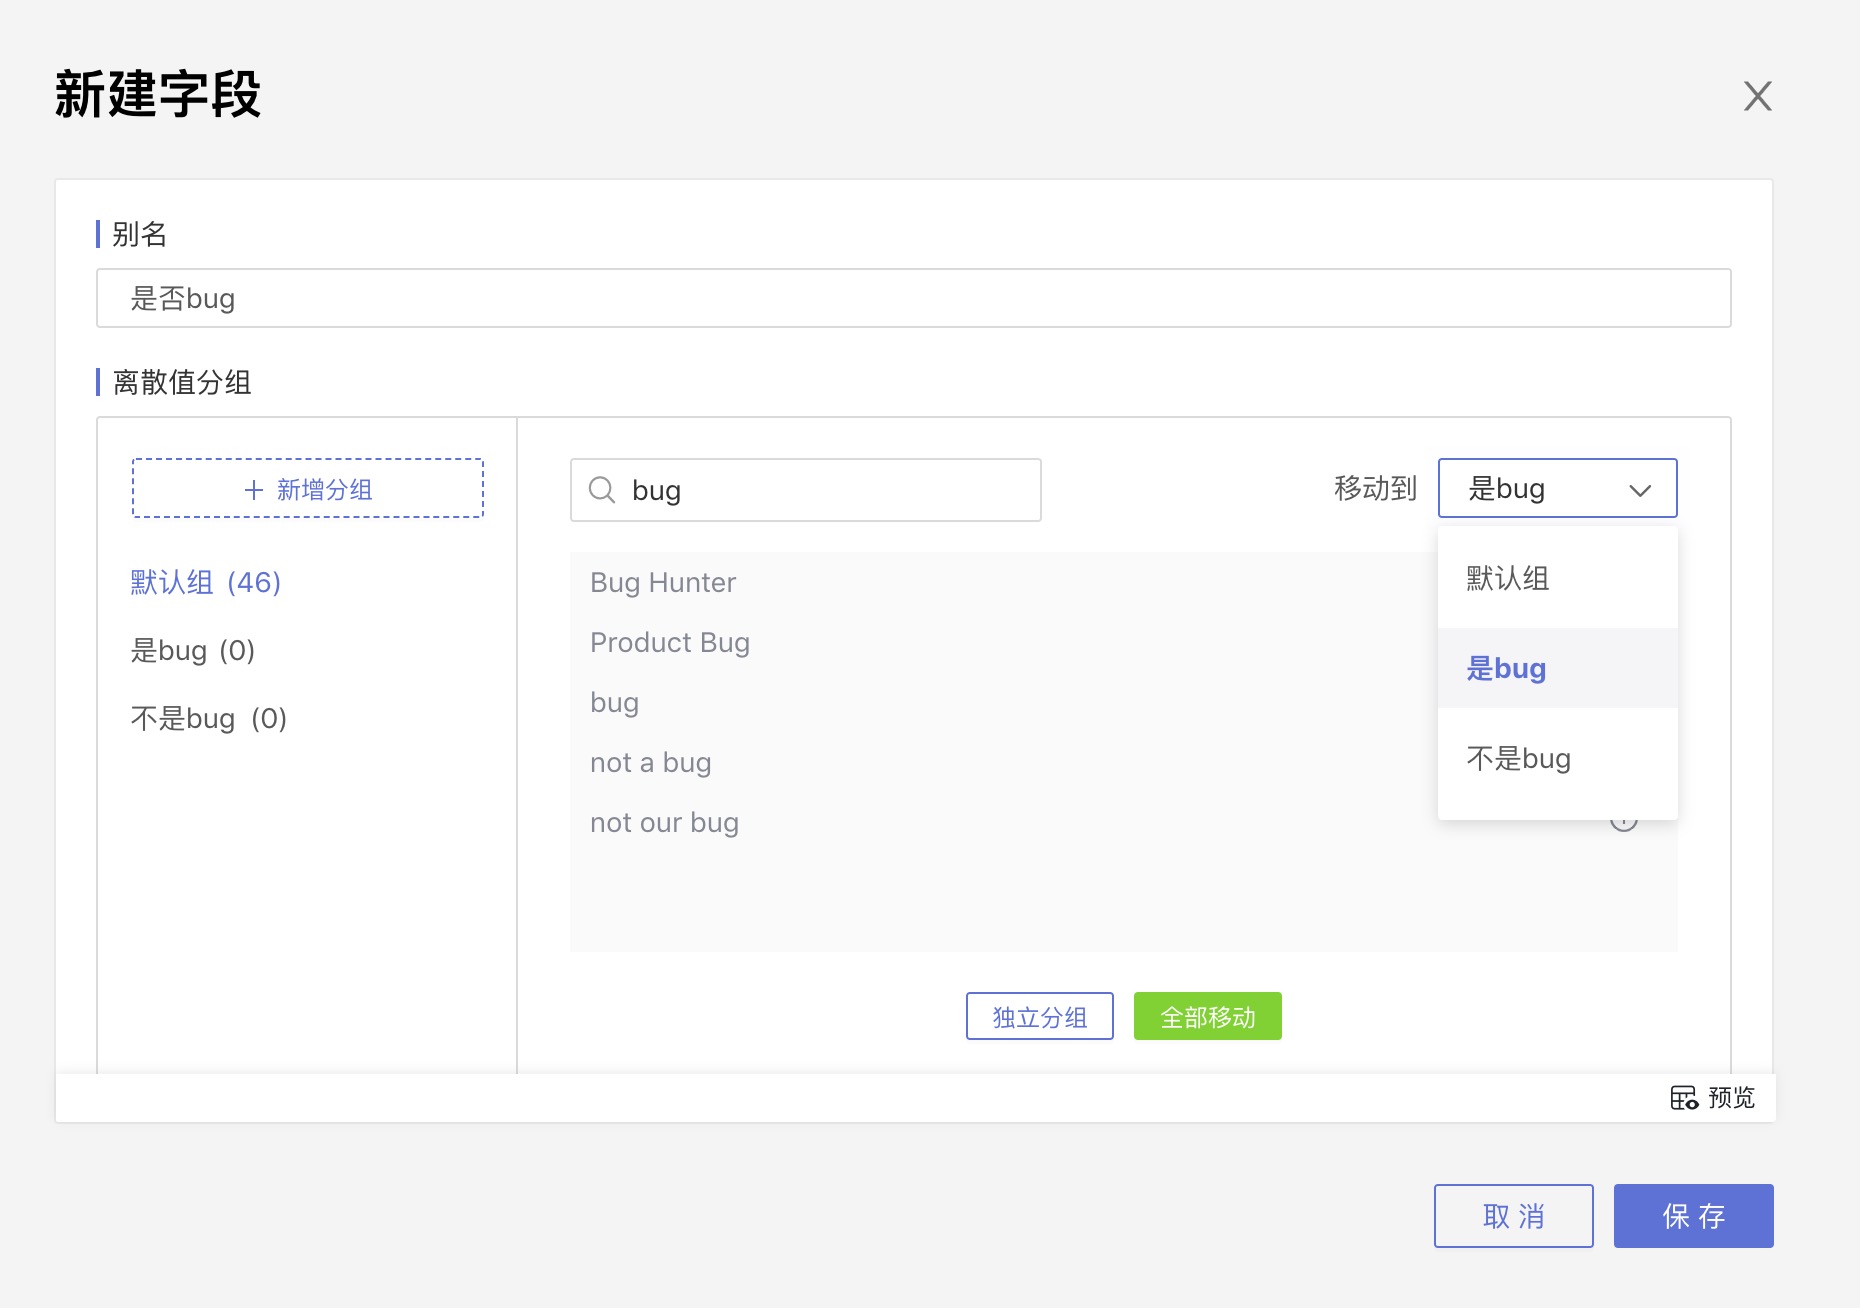
After creating a new group, select the target group in the Move to dropdown list in the right-upper corner, select a field value in the middle field value area, and click the plus sign to move field values one by one into the target group.
Move All: Click Move All below to move all field values in the field area to the target group.
Independent Grouping: Clicking Independent Grouping will make each field value in the field area into an independent group.
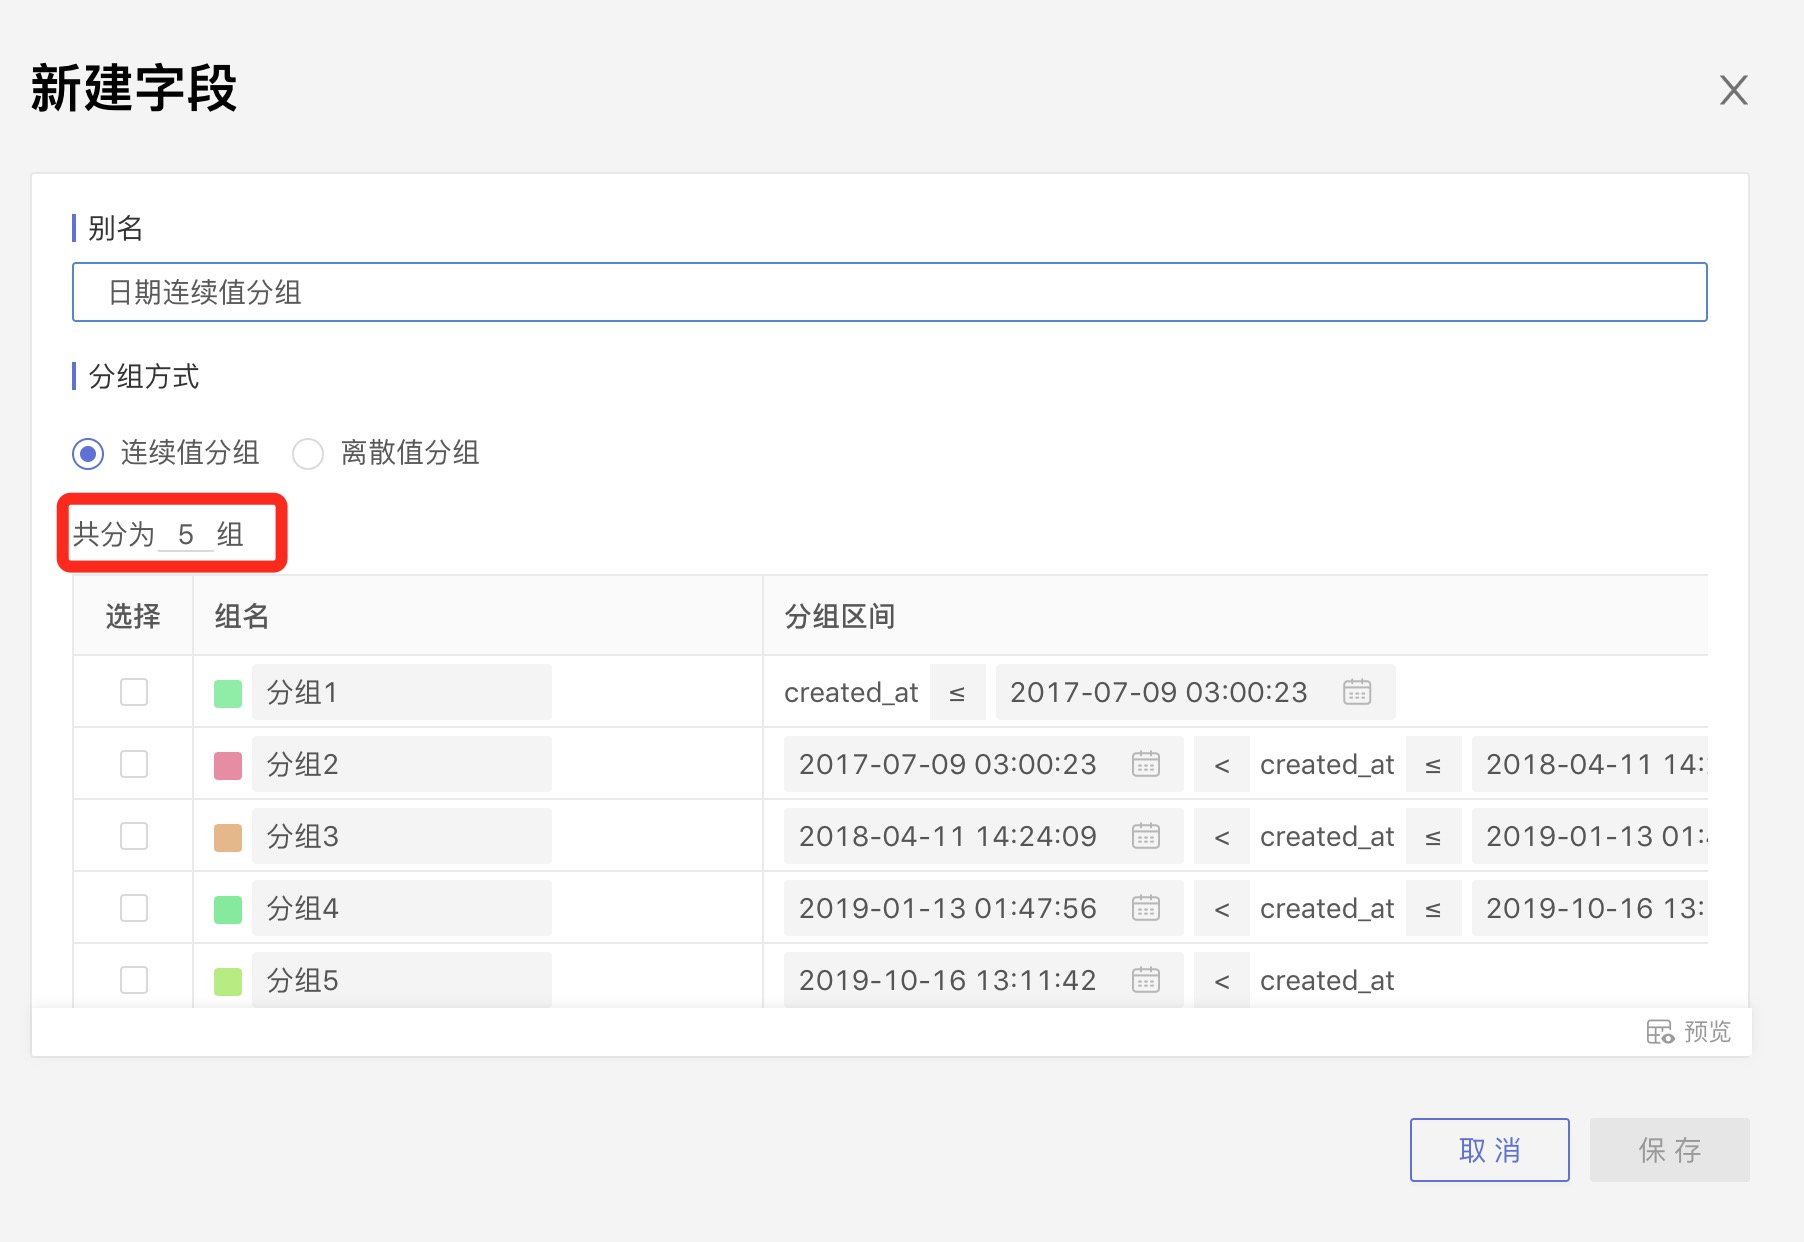
Continuous Value Group
Select a date or number field to do column value grouping. By default, it is continuous value grouping.
The system will default to dividing into 3 groups. You can change the number of groups at Divided into x groups, change the group names, and modify the range values for each group in Group Interval.
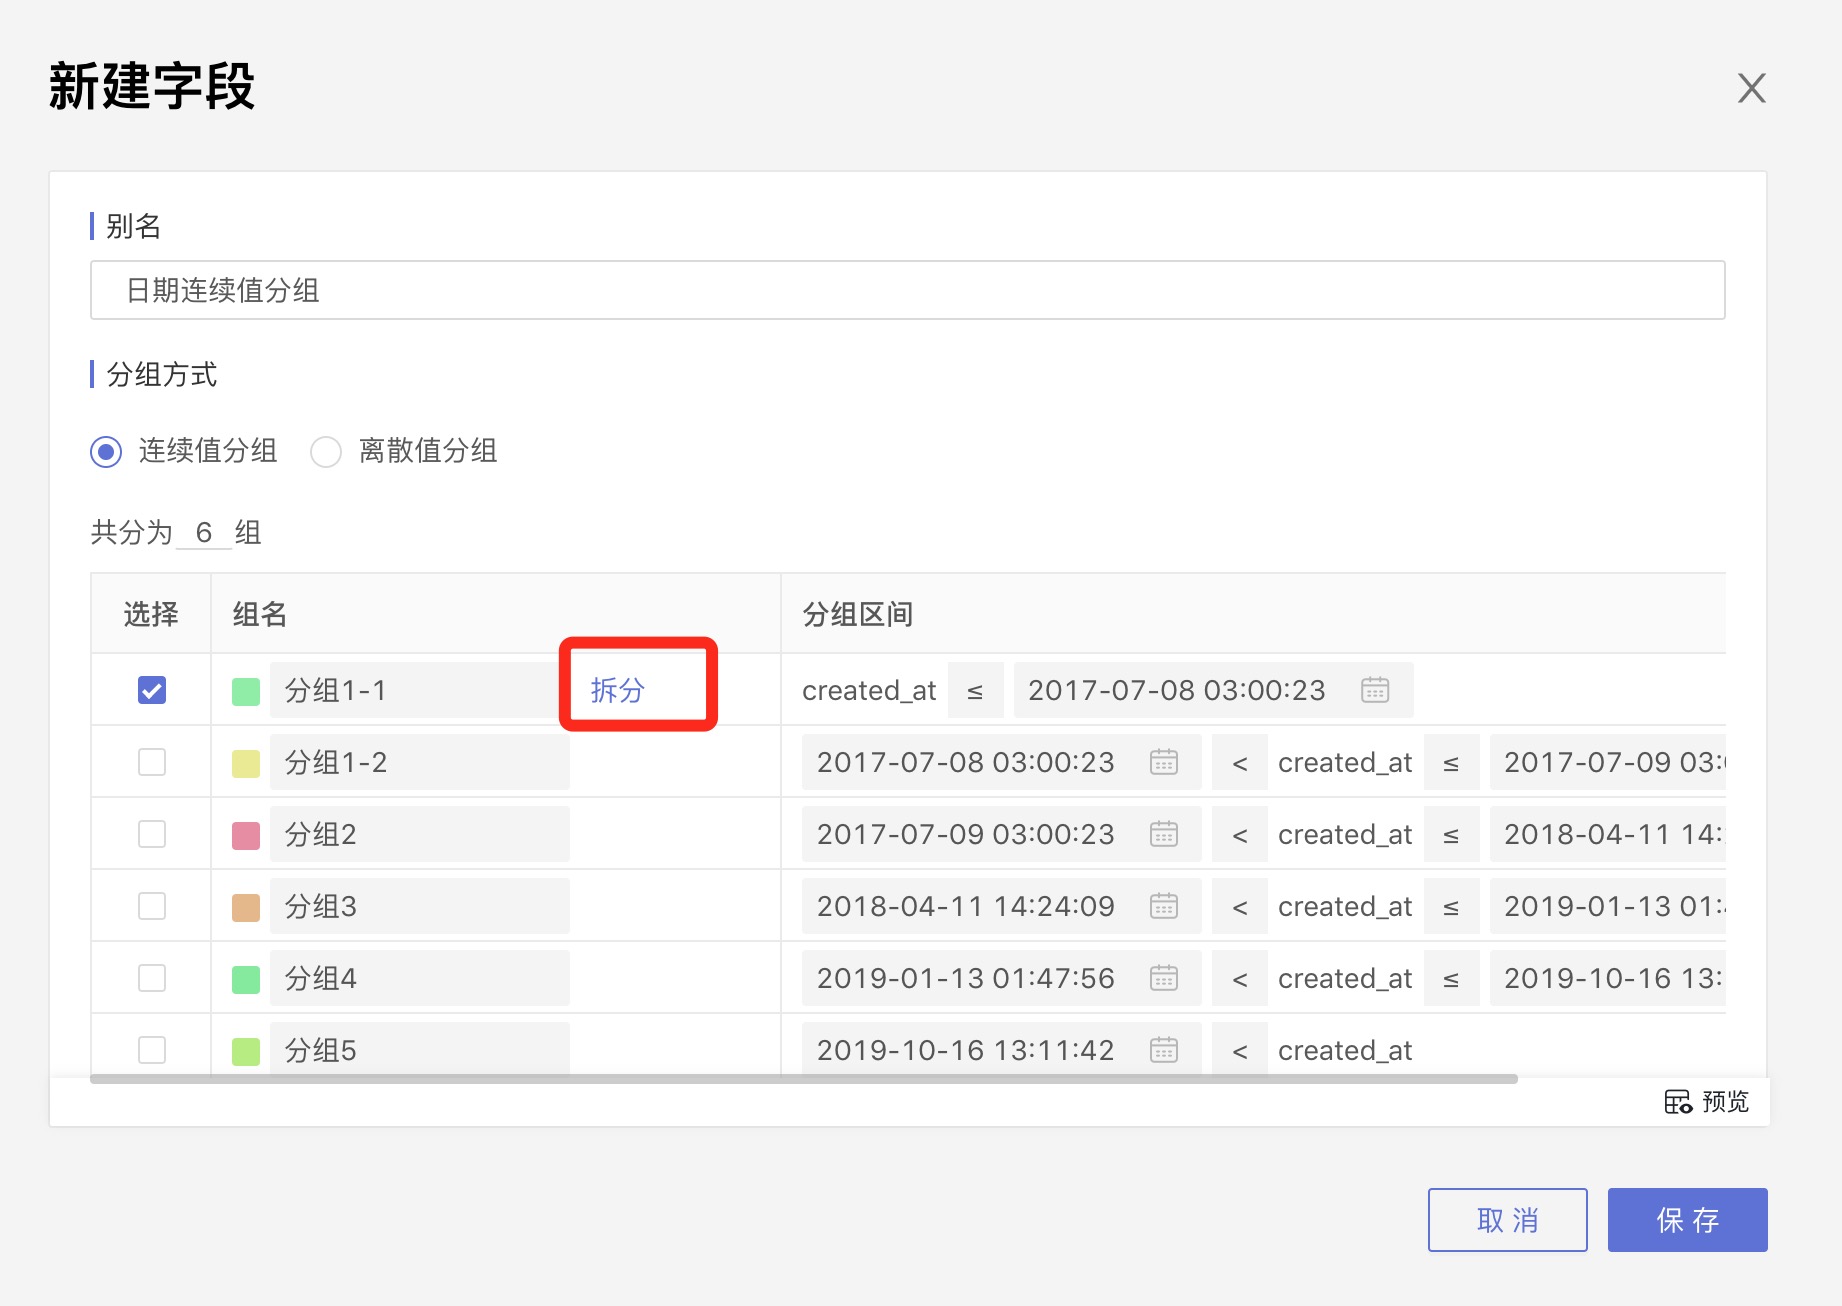
Split
Click Split next to the group name you want to split, and the group will be divided into two groups.
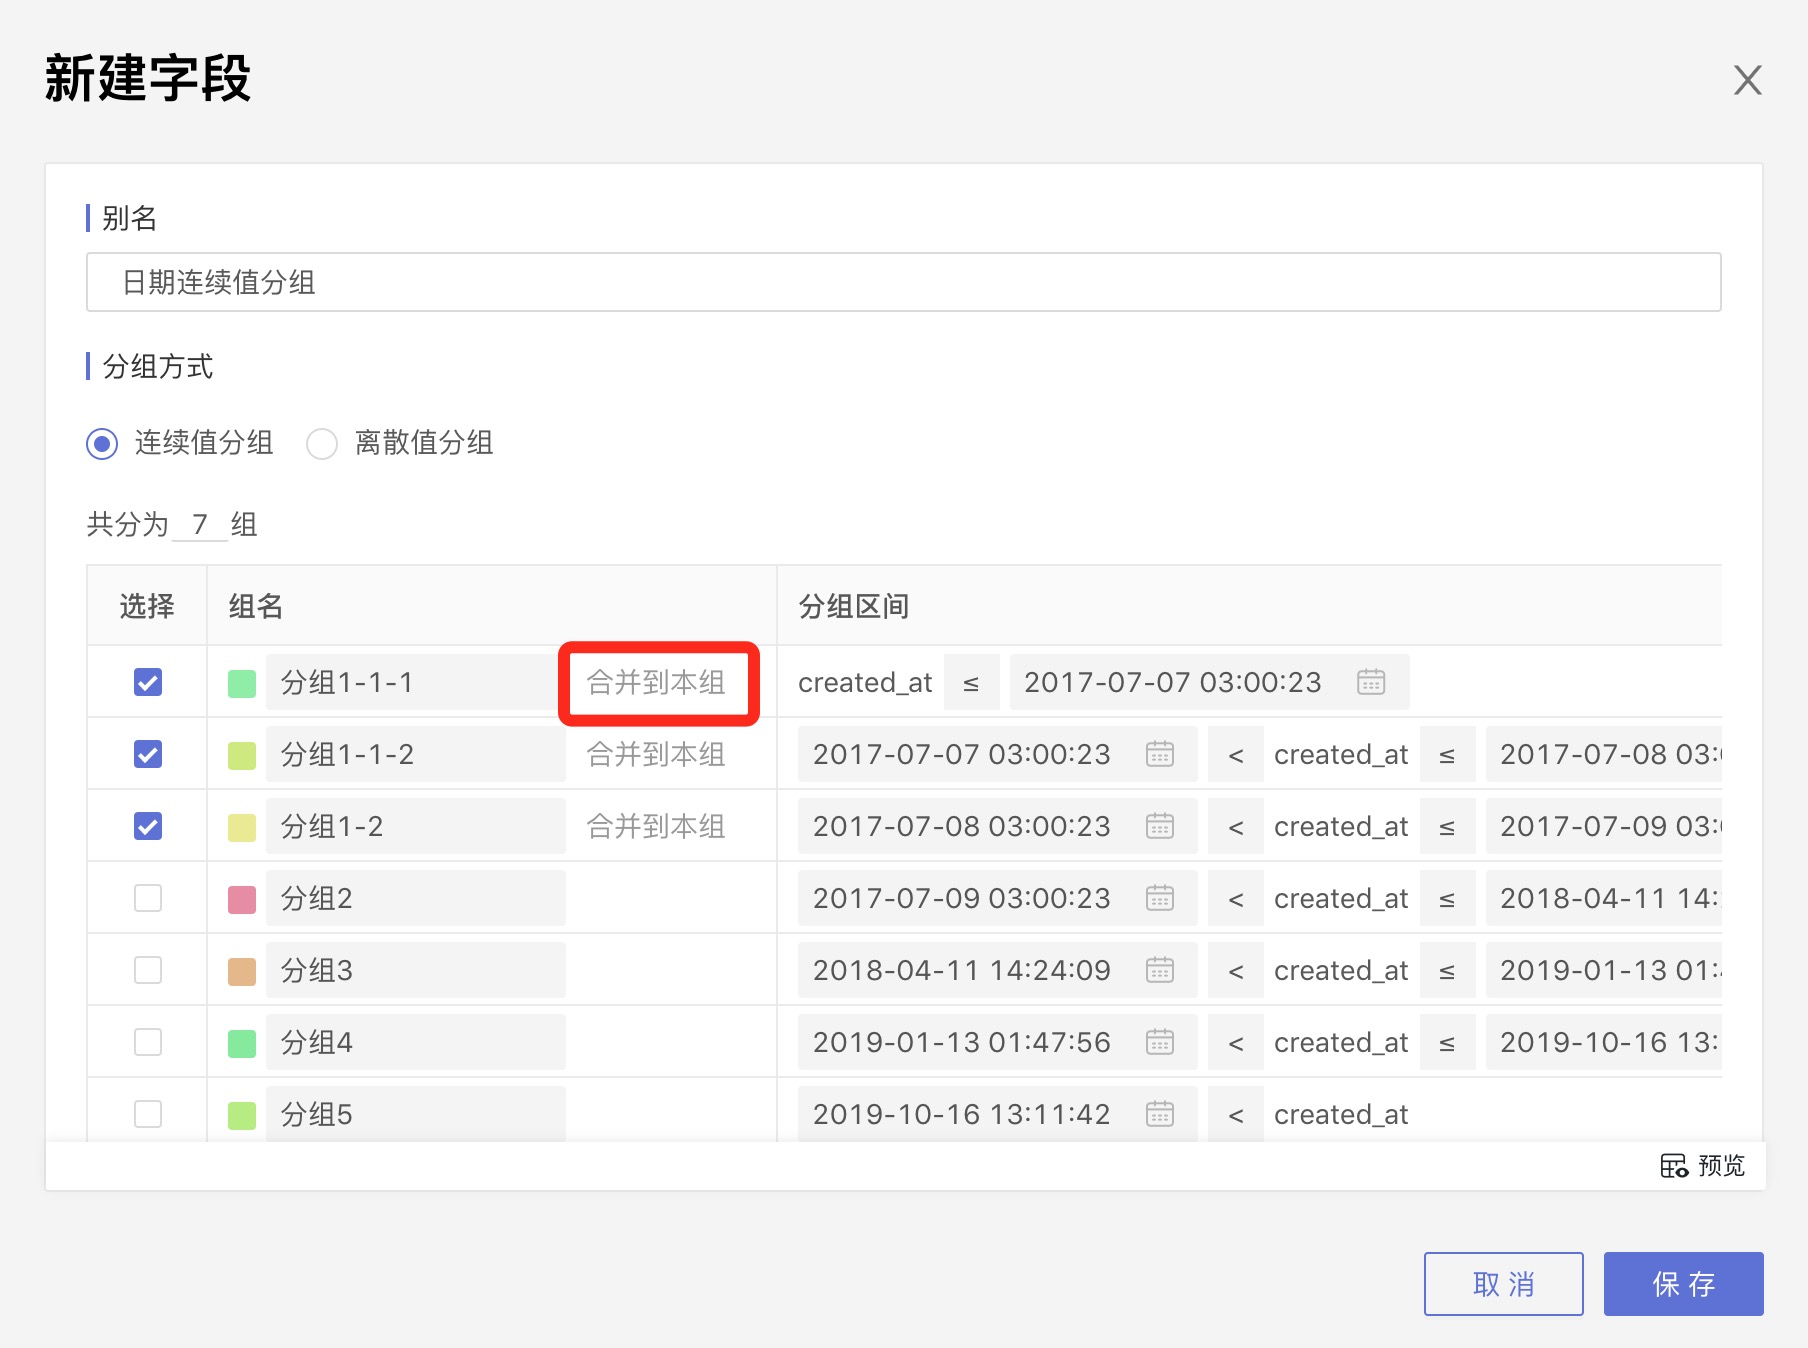
Merge
Select multiple groups, and Merge into this group will appear on the right of the group names. After clicking, the other selected groups will be merged into this group.
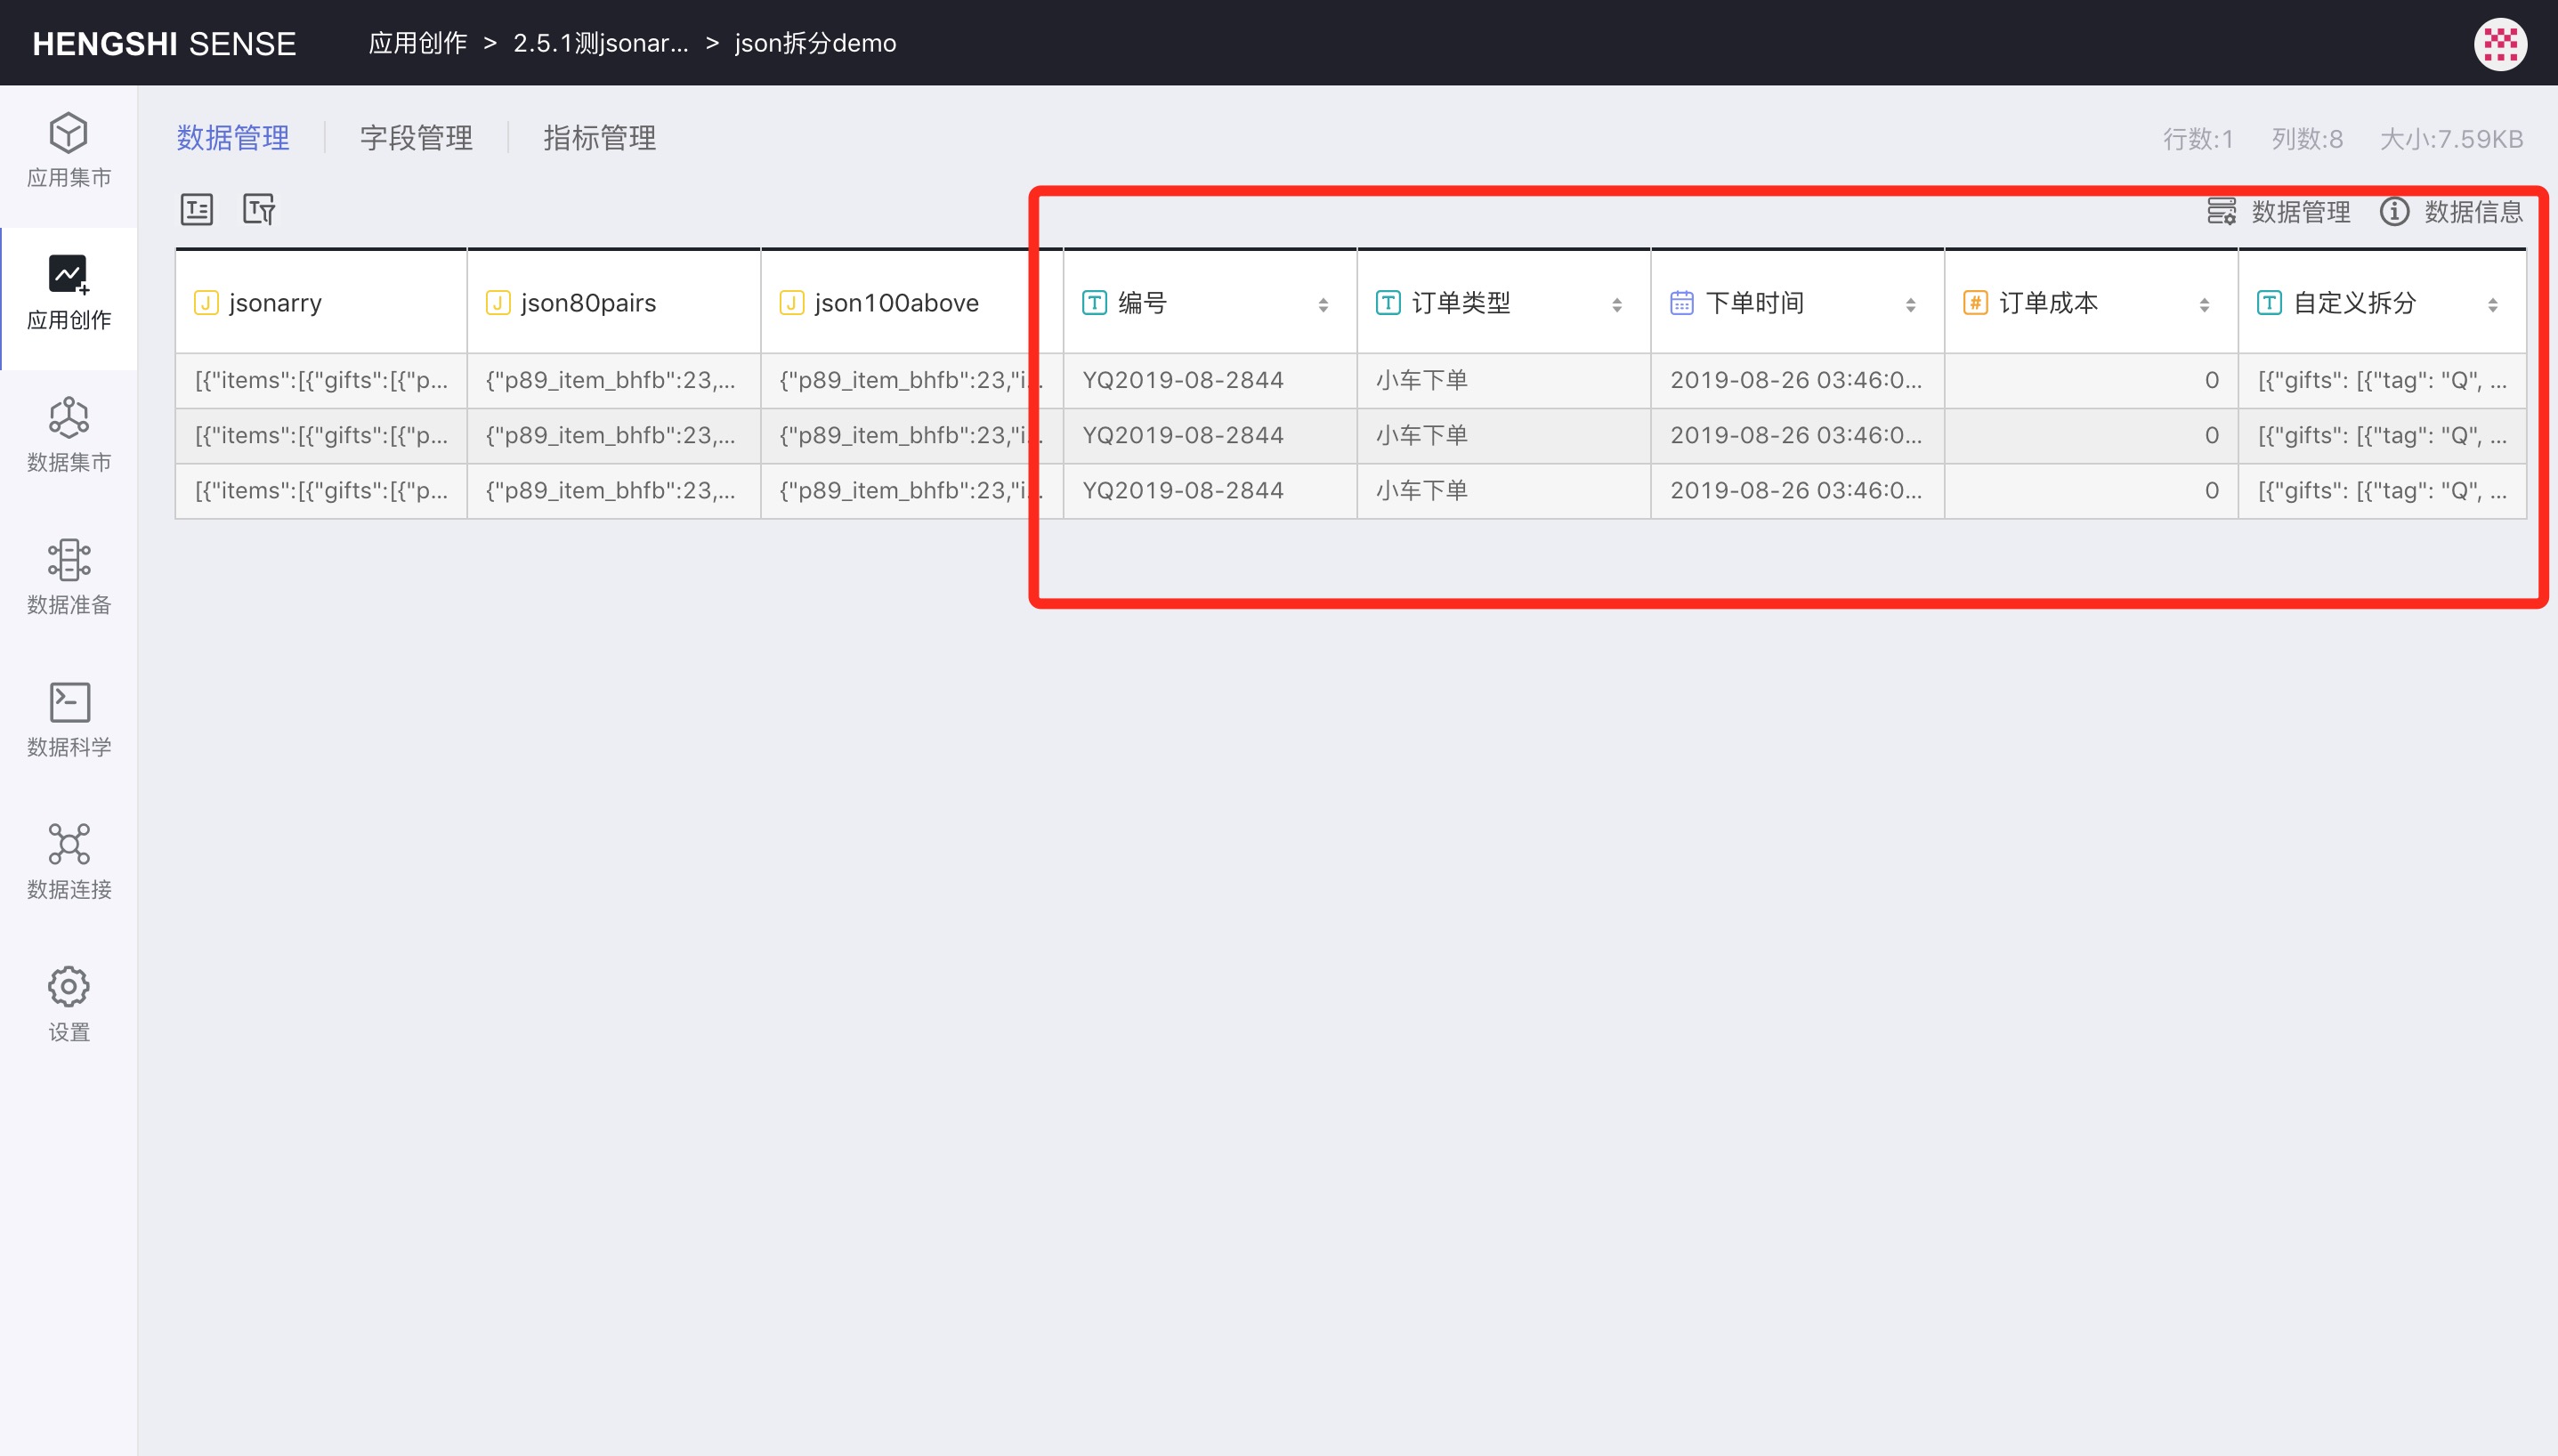
JSON Splitting
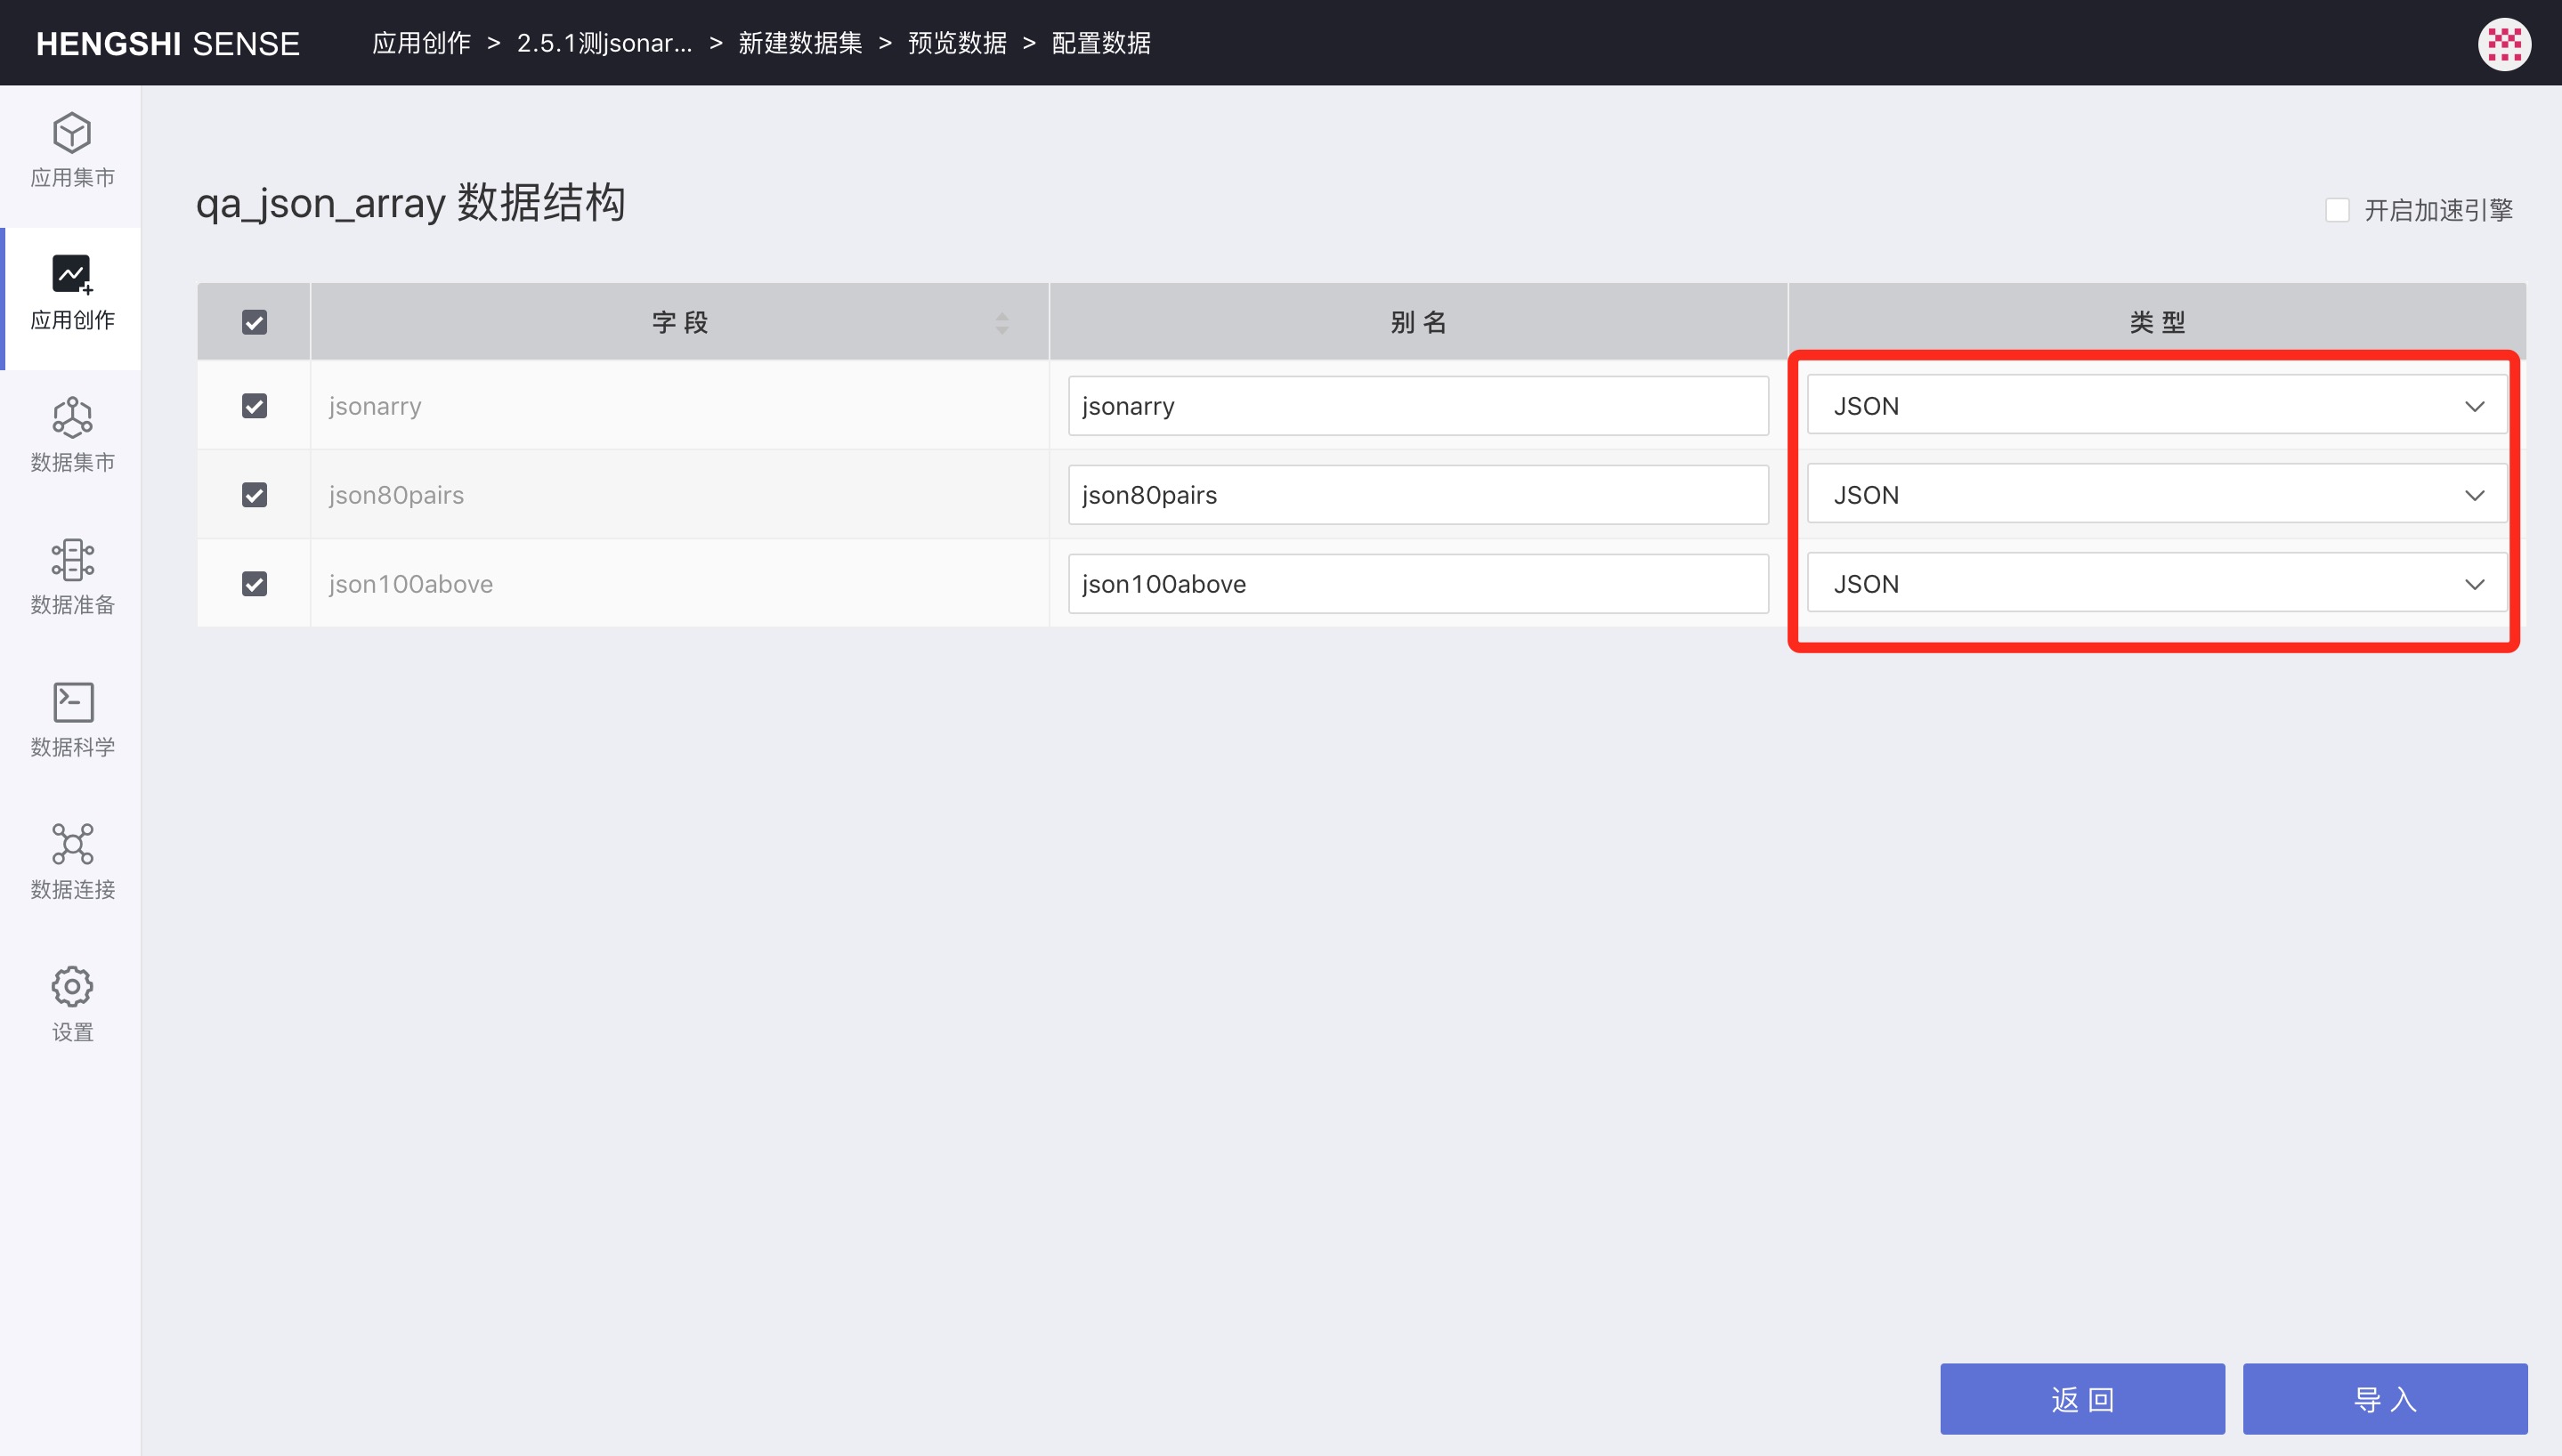
For data sources that support JSON type, JSON fields will be recognized as JSON type,
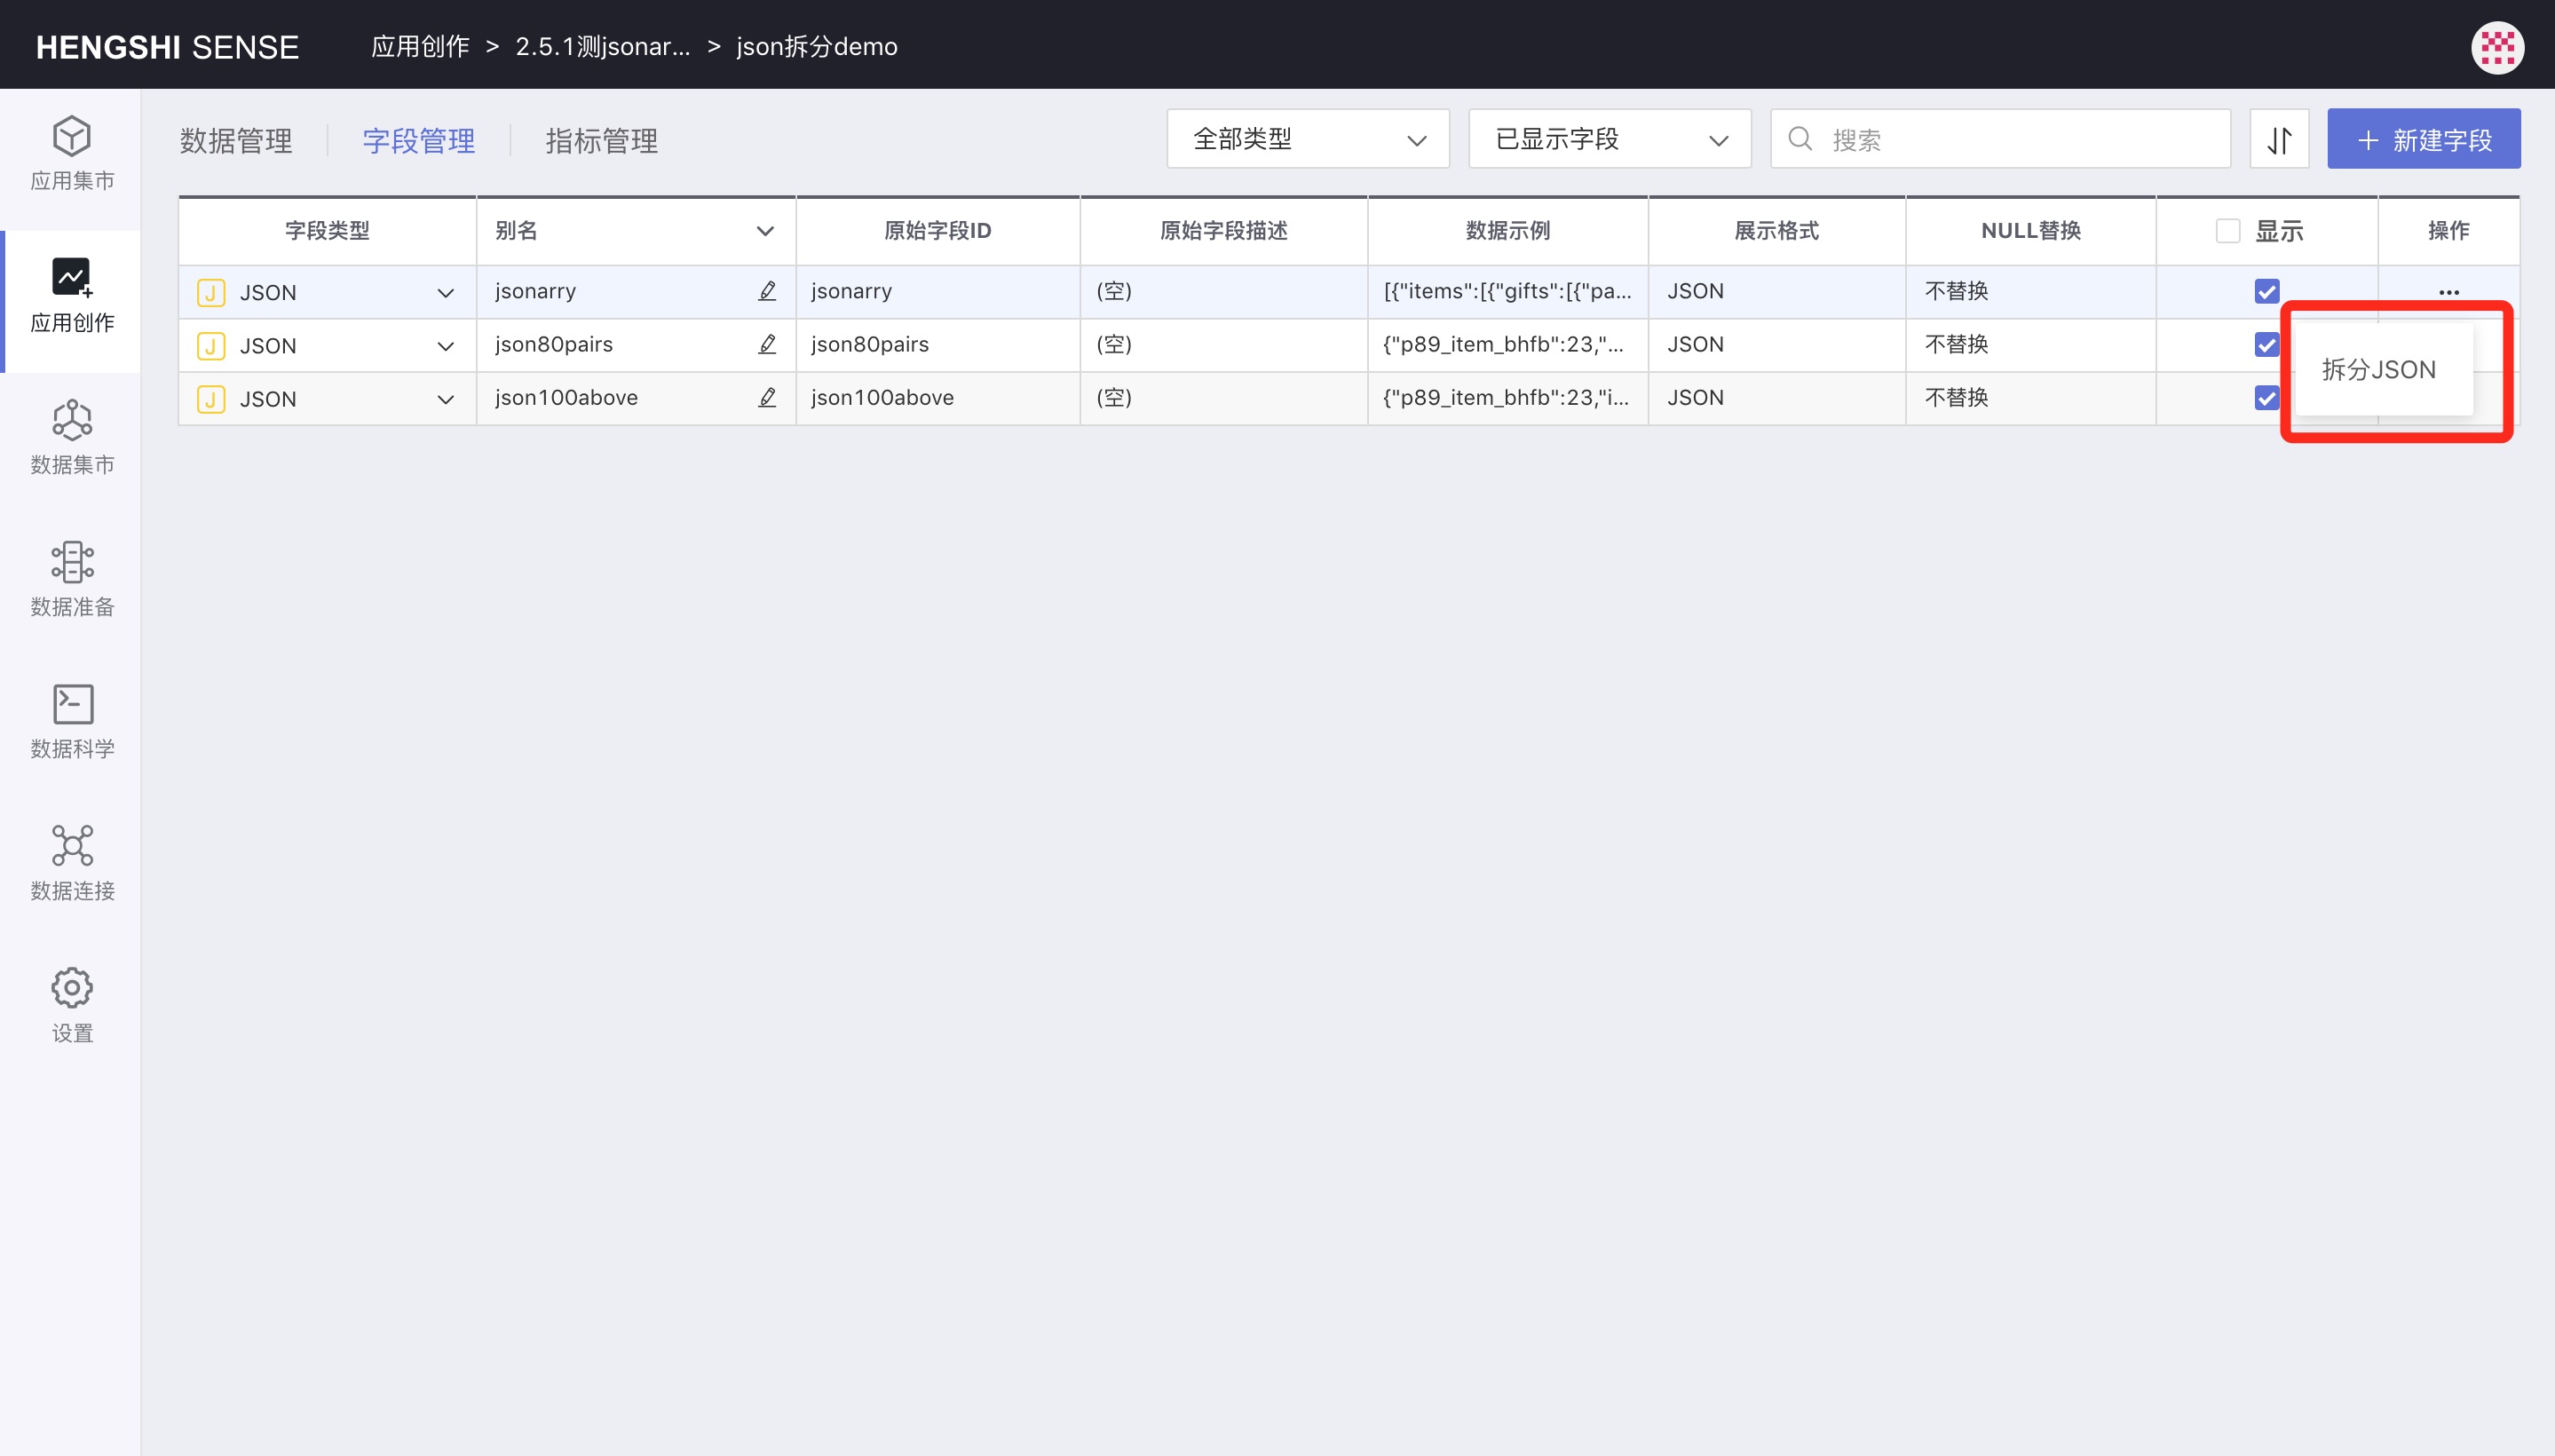
Open the dataset, switch to the Field Management tab, and open the three-dot menu of a JSON field to see JSON Splitting.
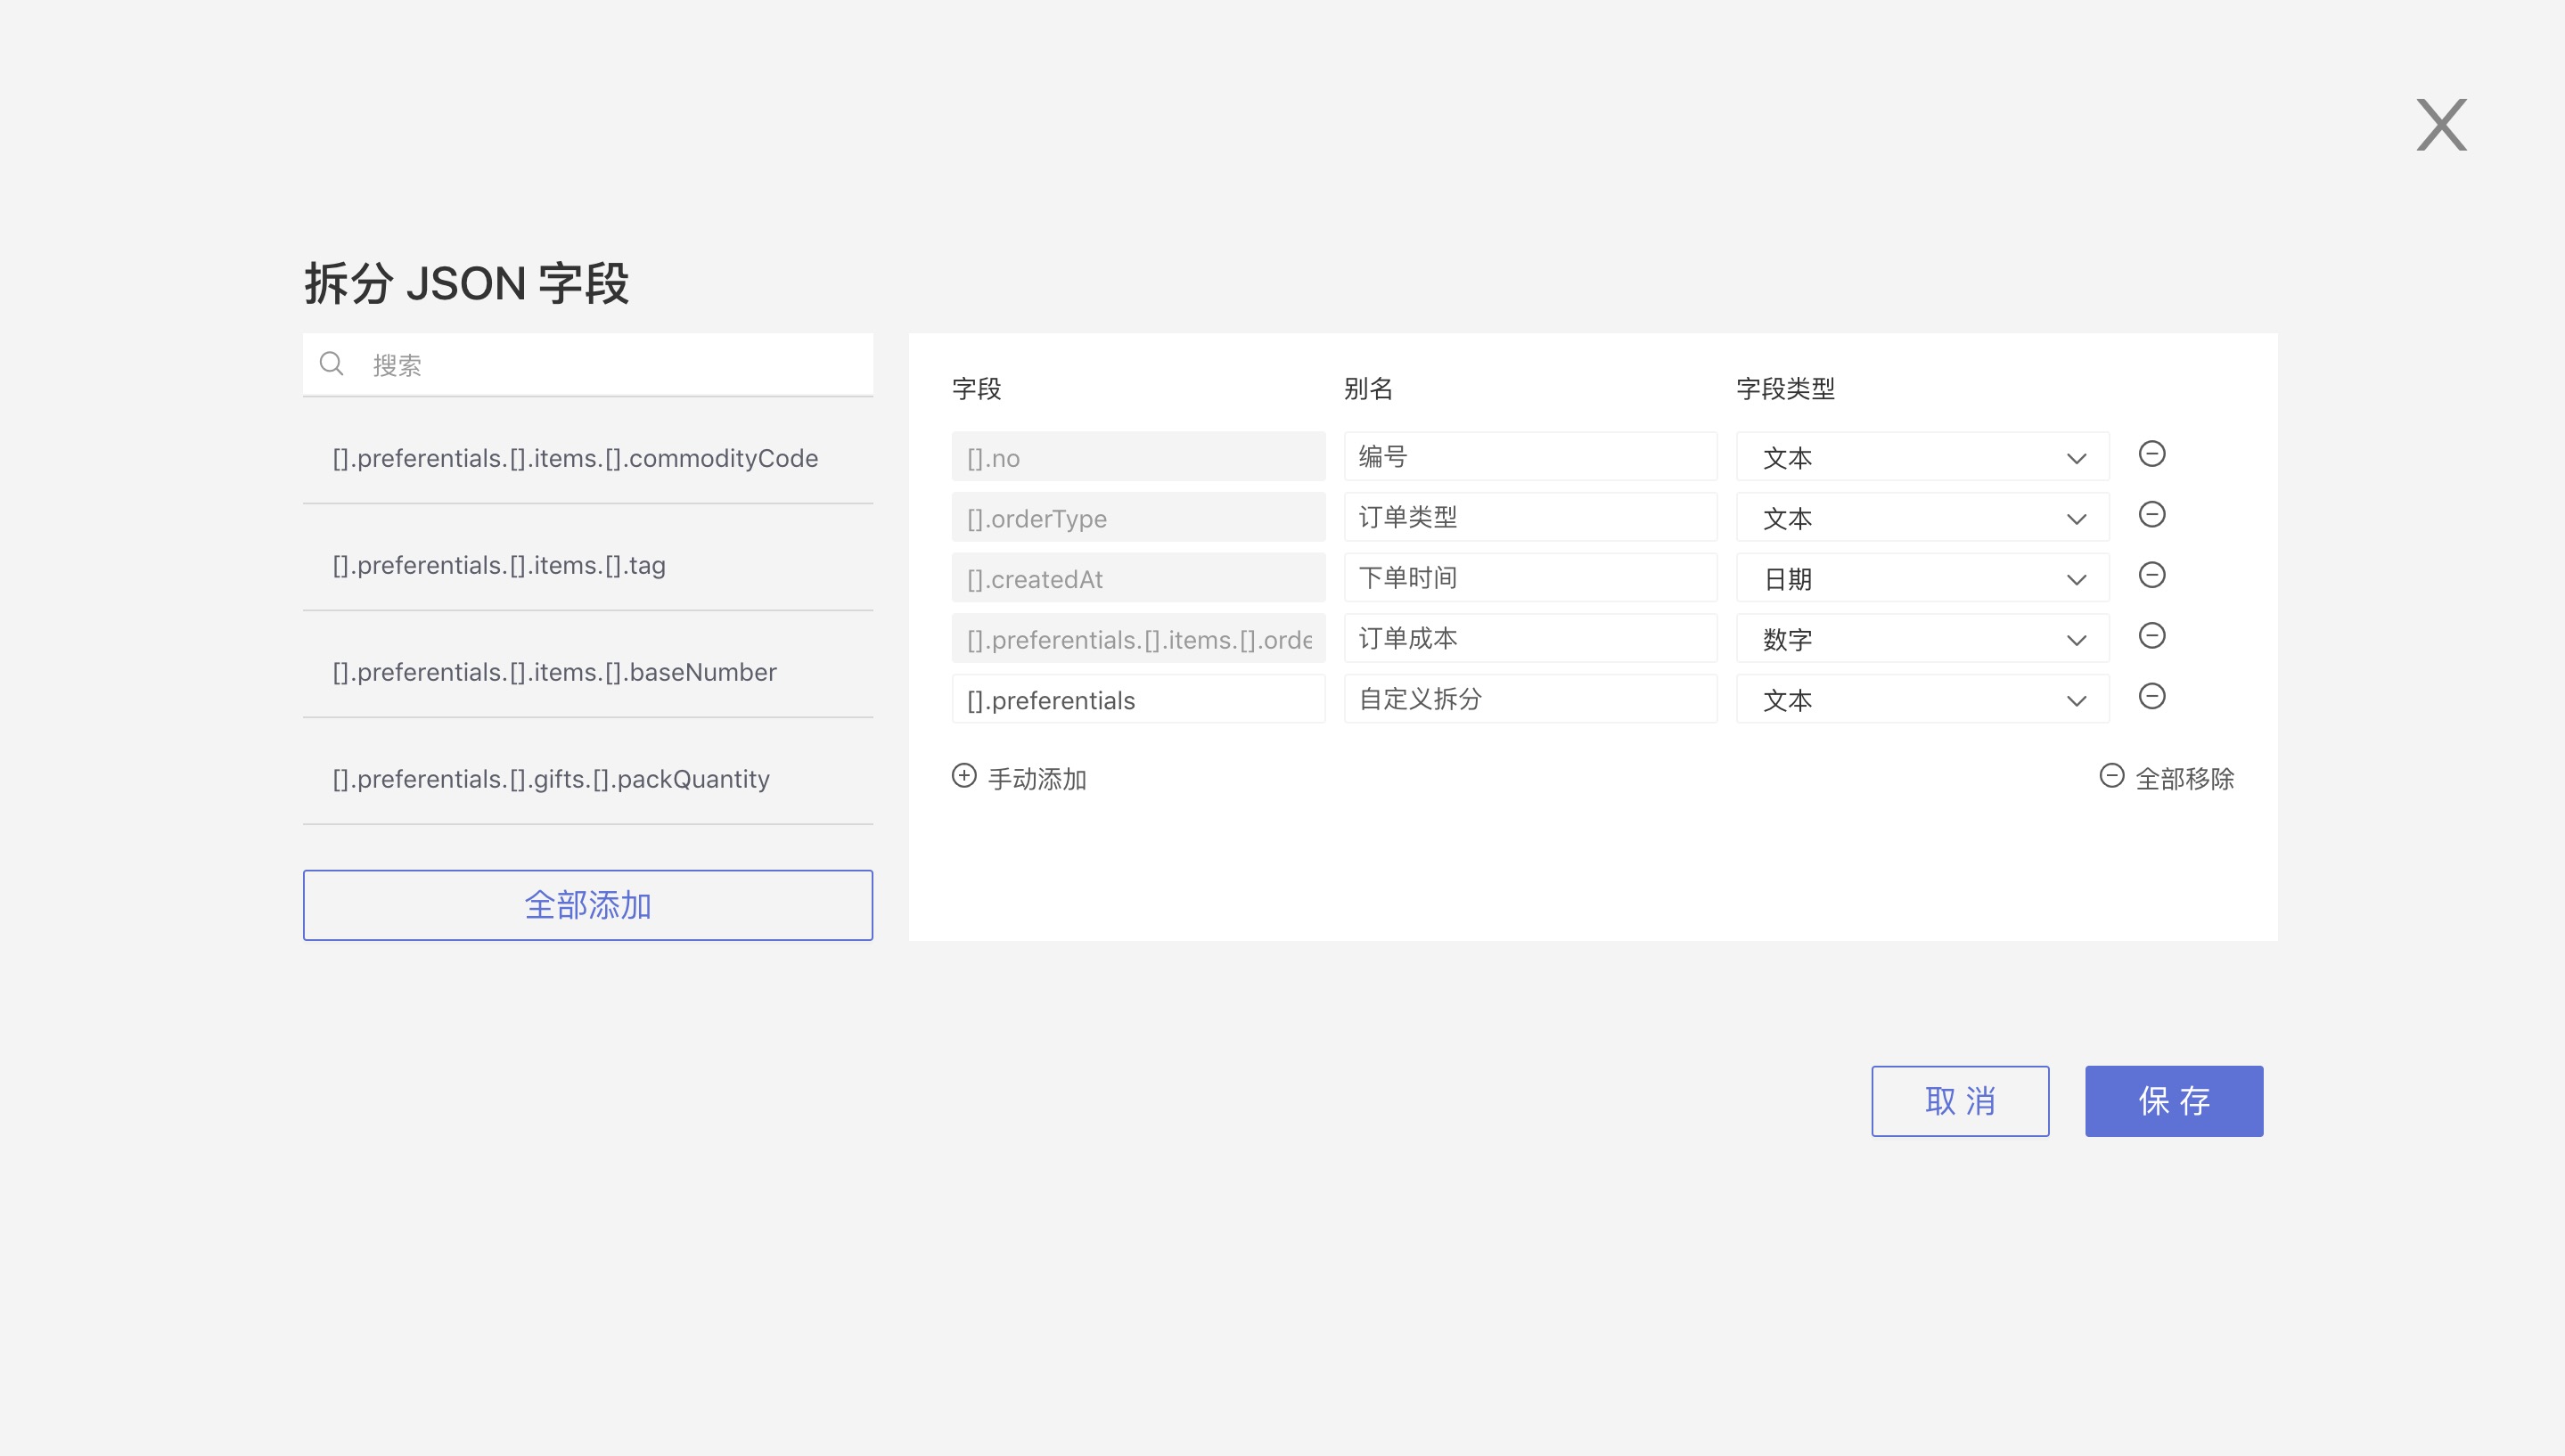
Click JSON Splitting, and the system will automatically identify fields that can be split. You can add them one by one to the right side or move all to the right side by clicking Move All below. On the right side, you can modify the field alias and field type.
If you do not want to split a particular field, you can cancel by clicking the minus sign.
Click Manually Add to enter a JSON path to perform custom splitting.
Click Save, and the split fields will appear in the field management list. Open the dataset to view the split results.
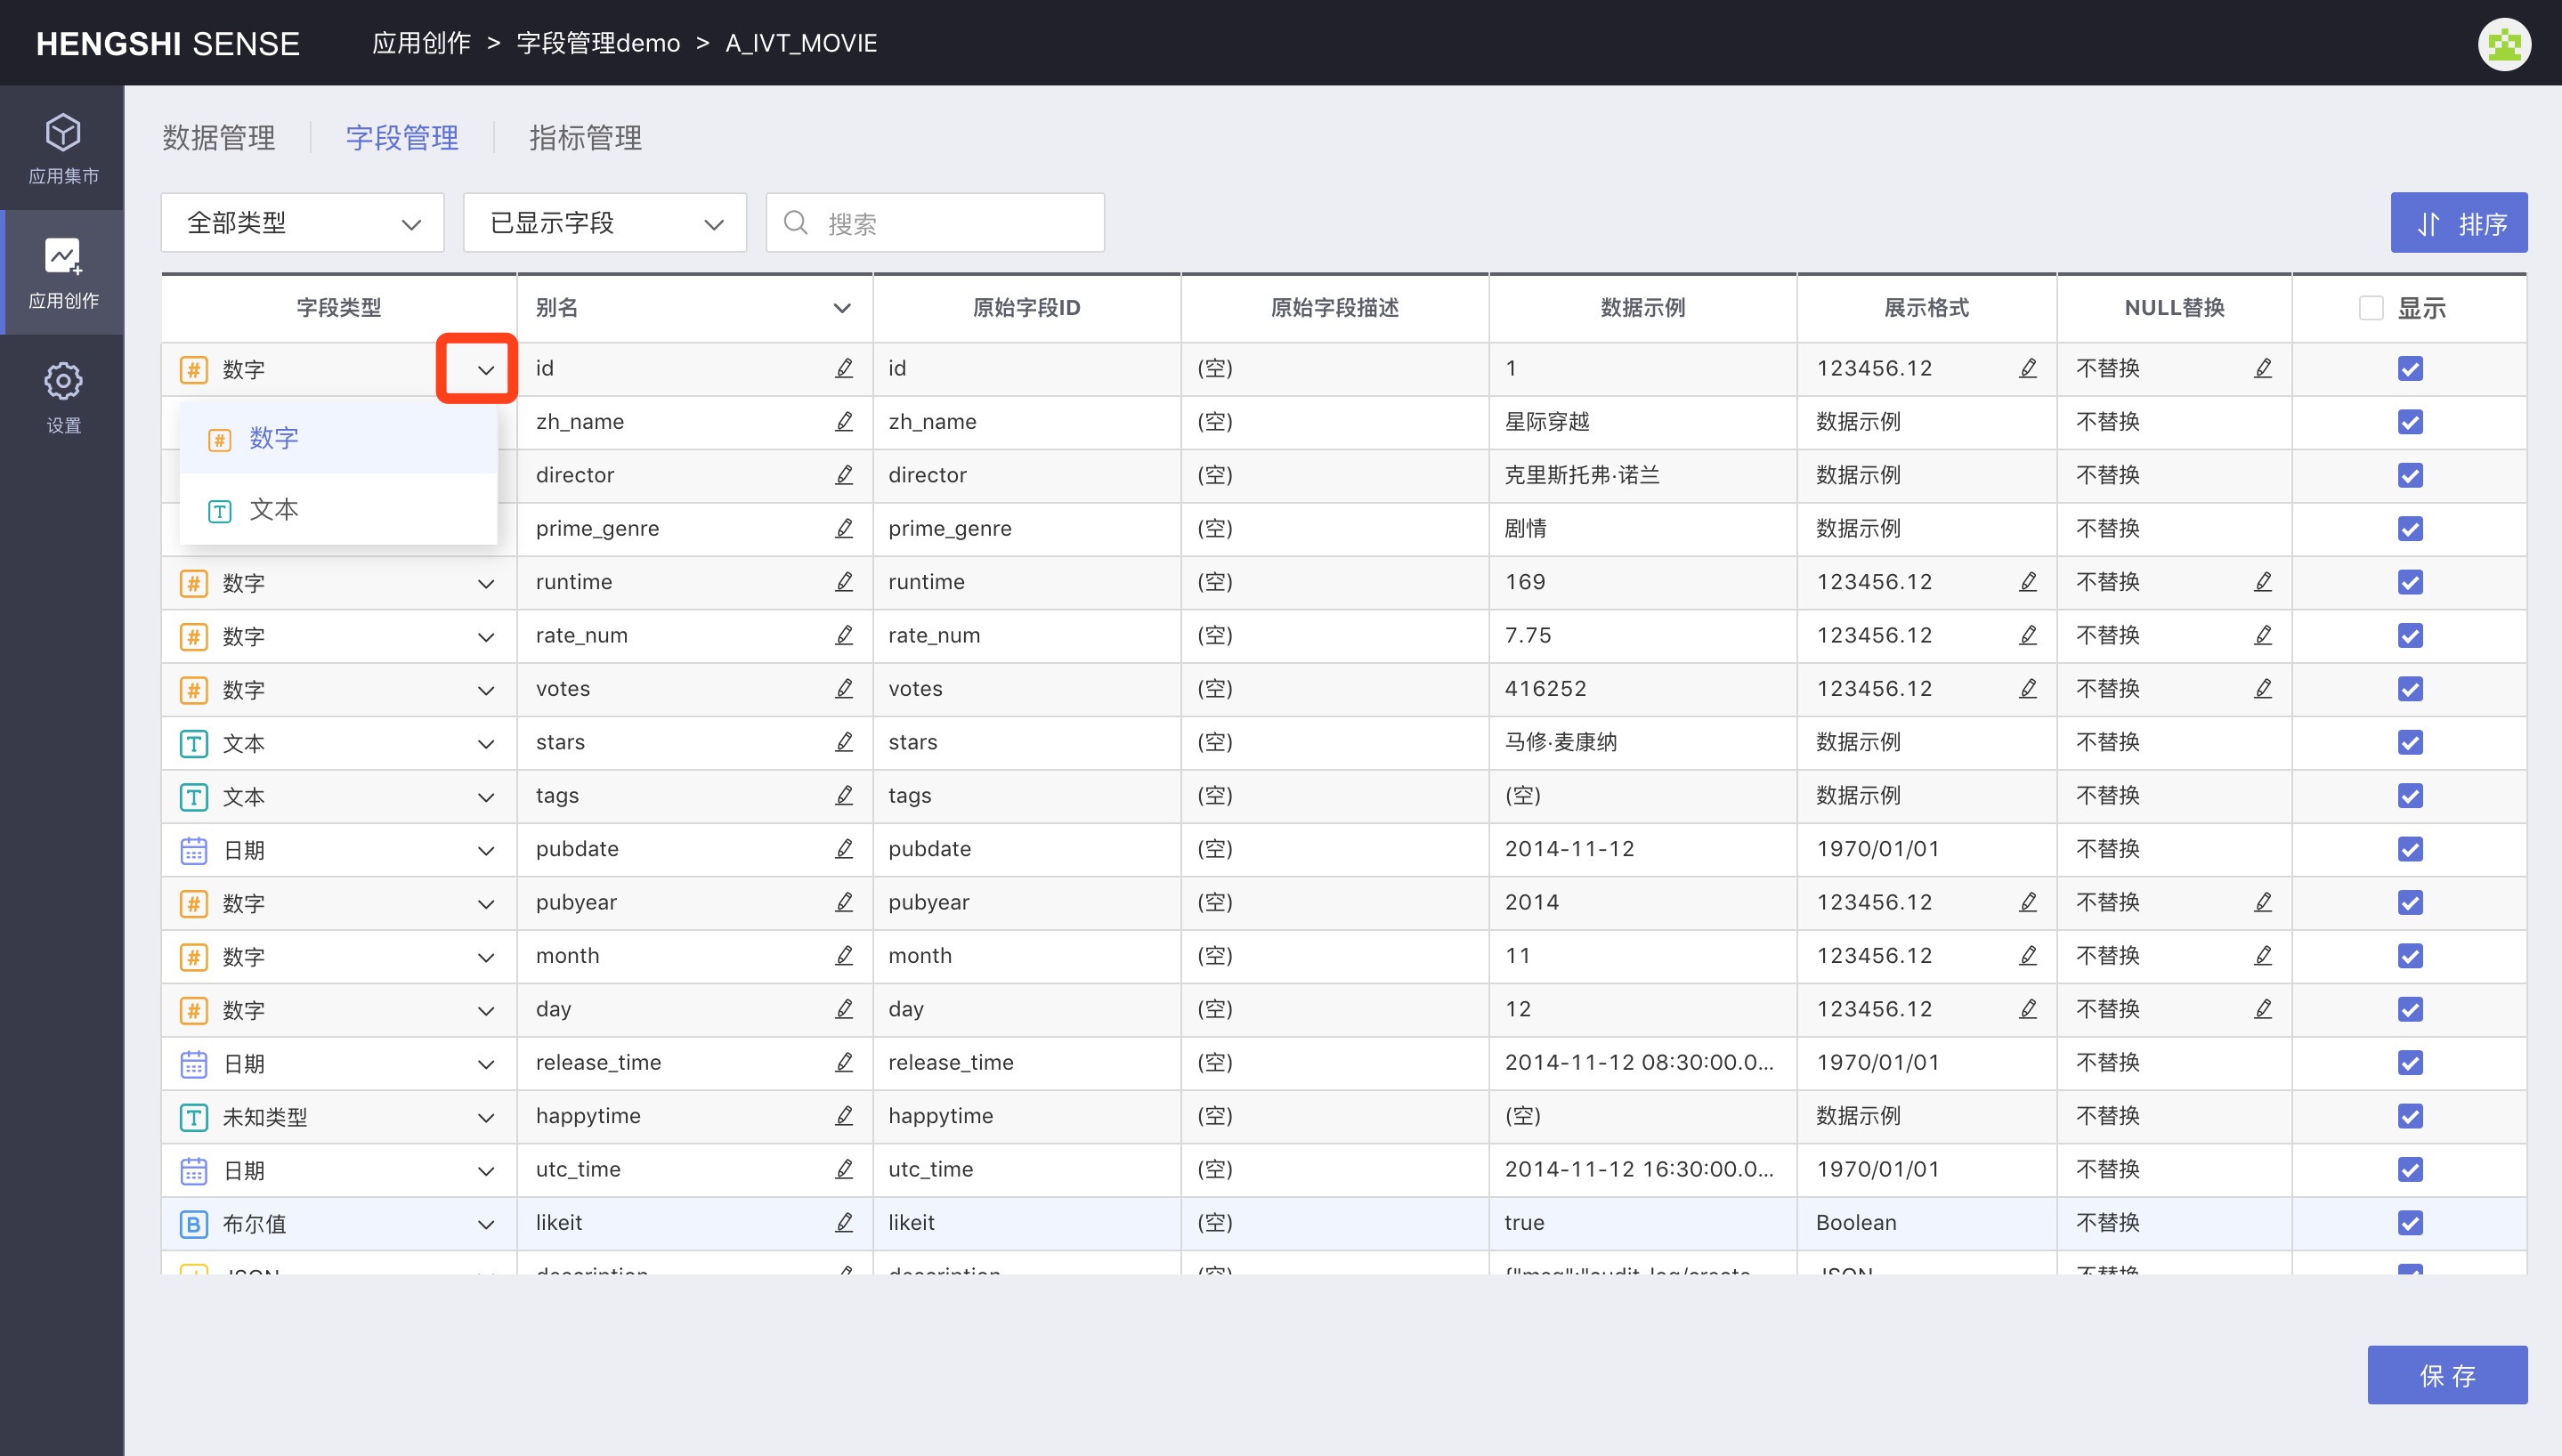
Change Field Type
Click the dropdown menu next to the field name and select the compatible numeric type. After saving, the field type will be changed to the selected type.
You can only change the data column type if it hasn't been referenced (referenced means it has been used in charts, dashboards, new fields/metrics, other datasets).
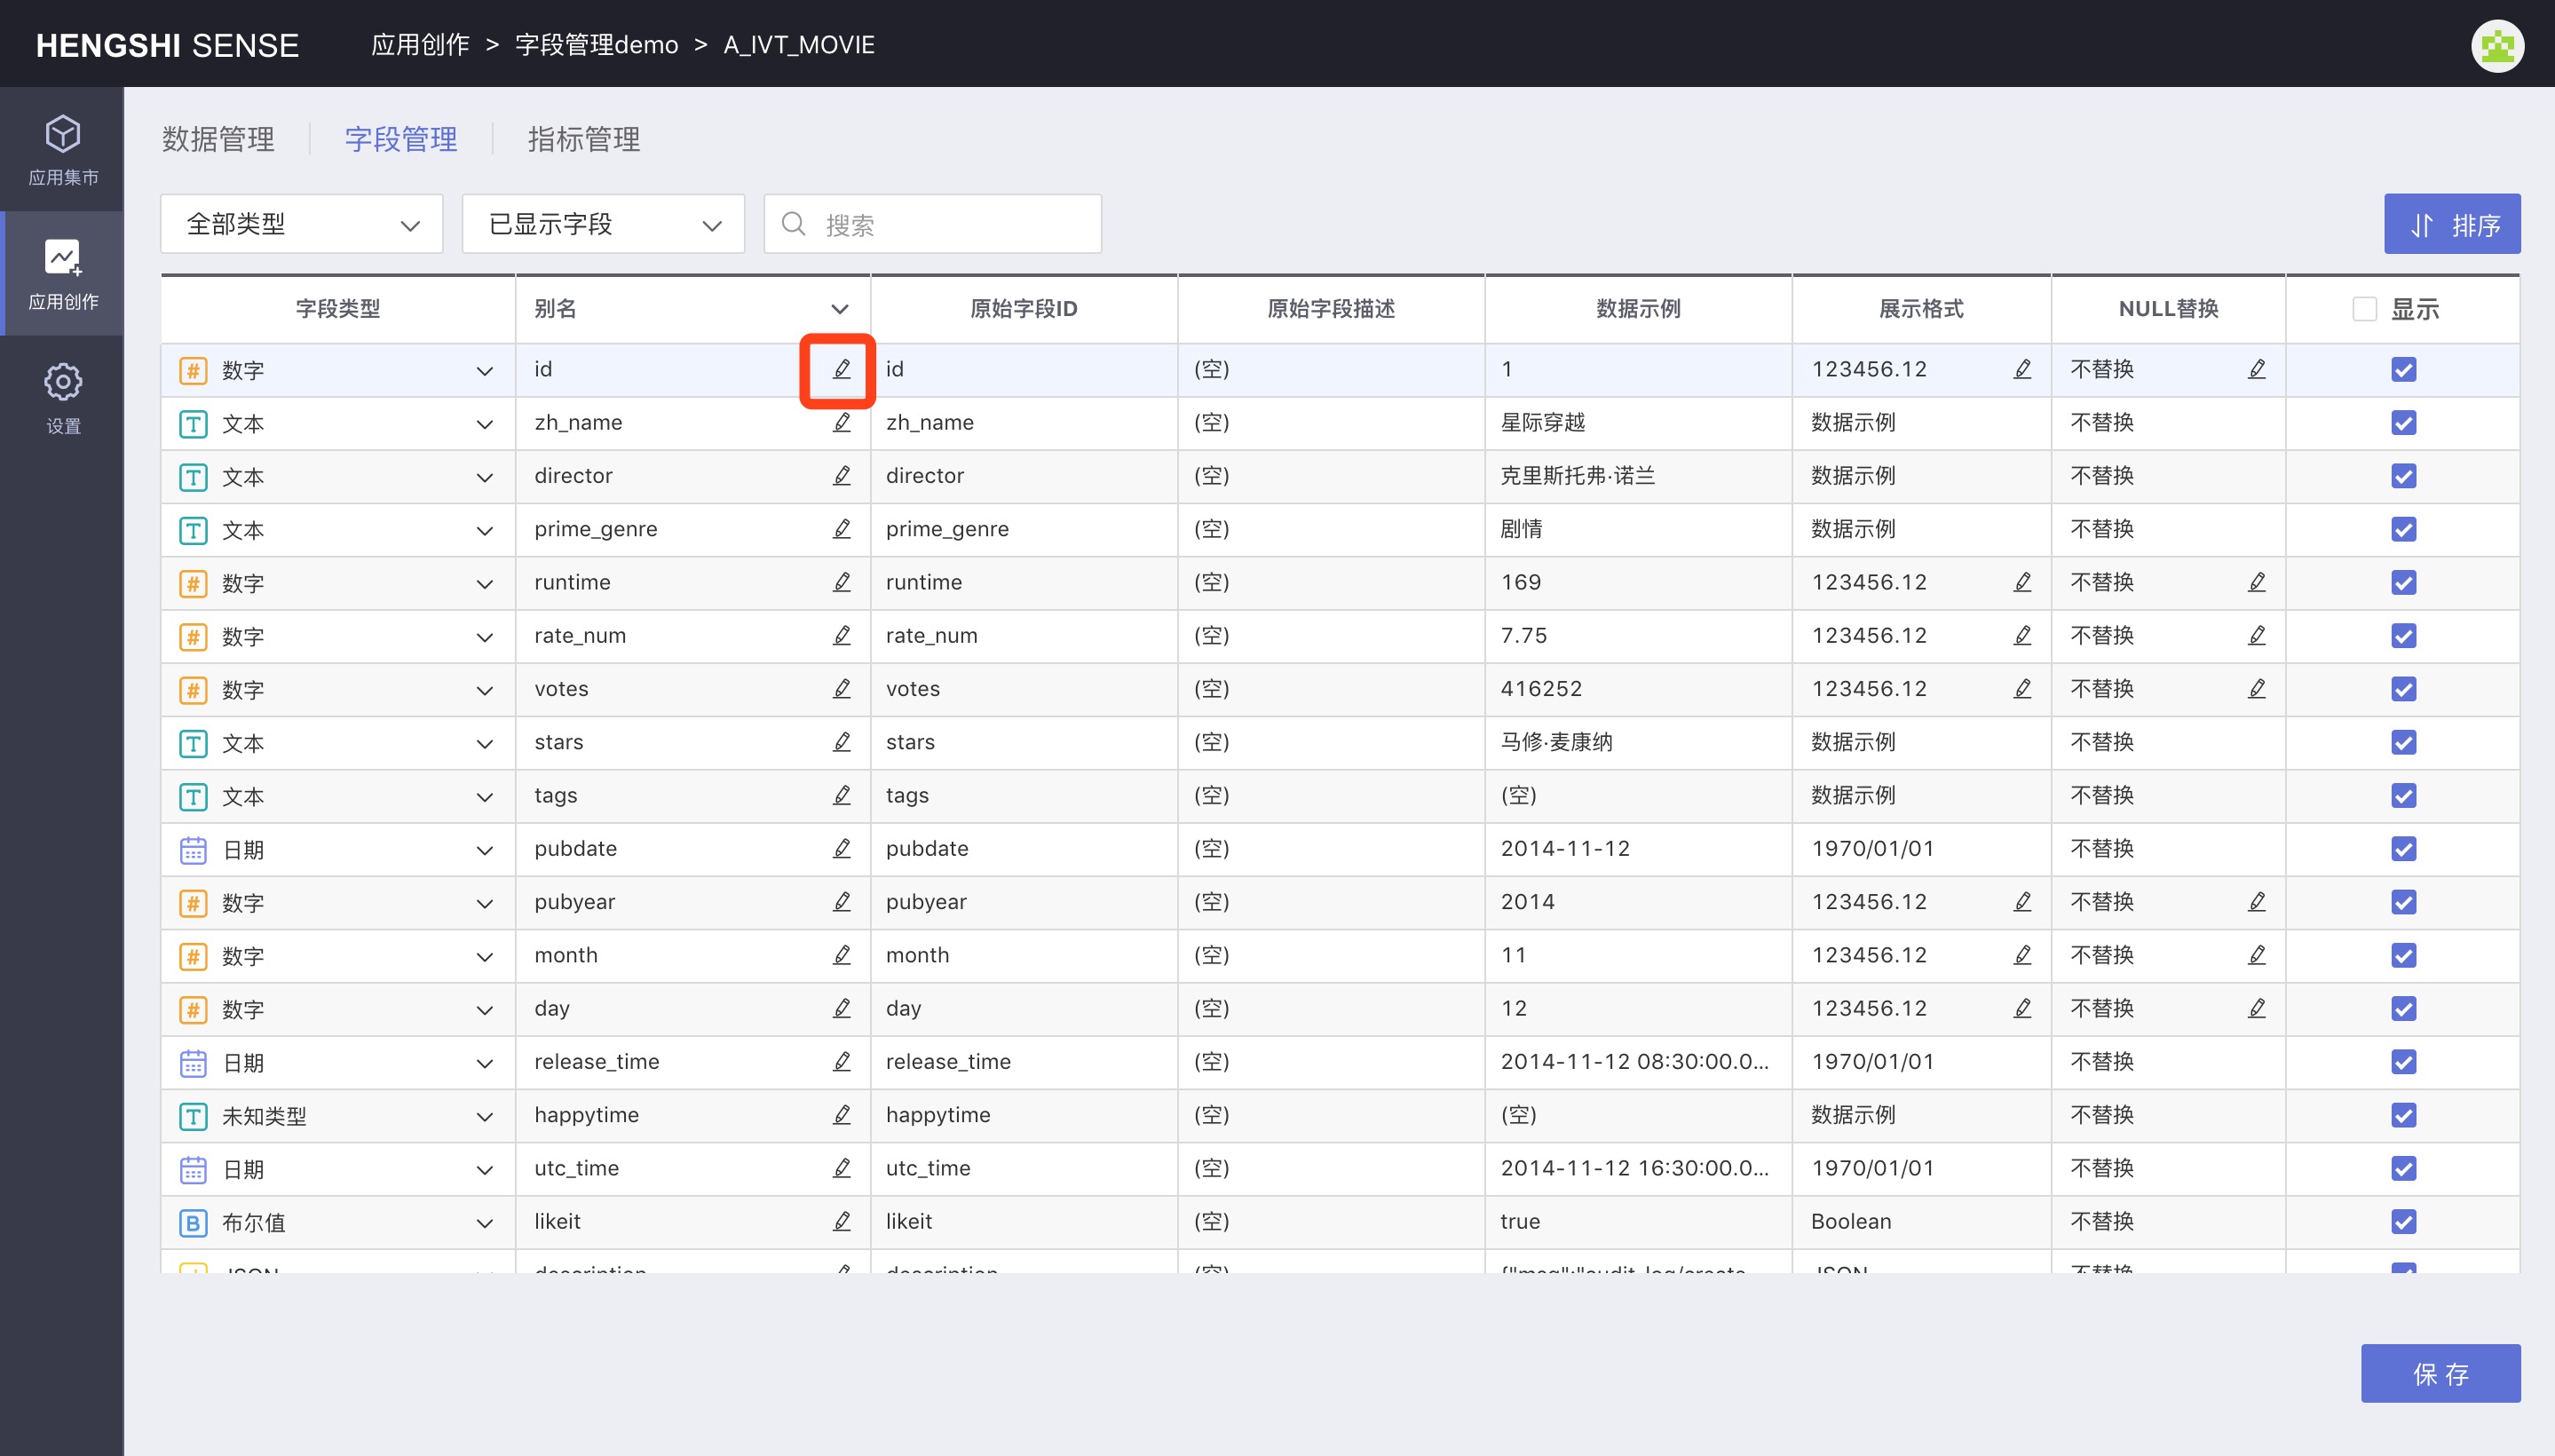
Change Field Name
Click the edit button after the current field name, enter the new name in the input box that appears, and save for it to take effect.
Batch Change Field Names
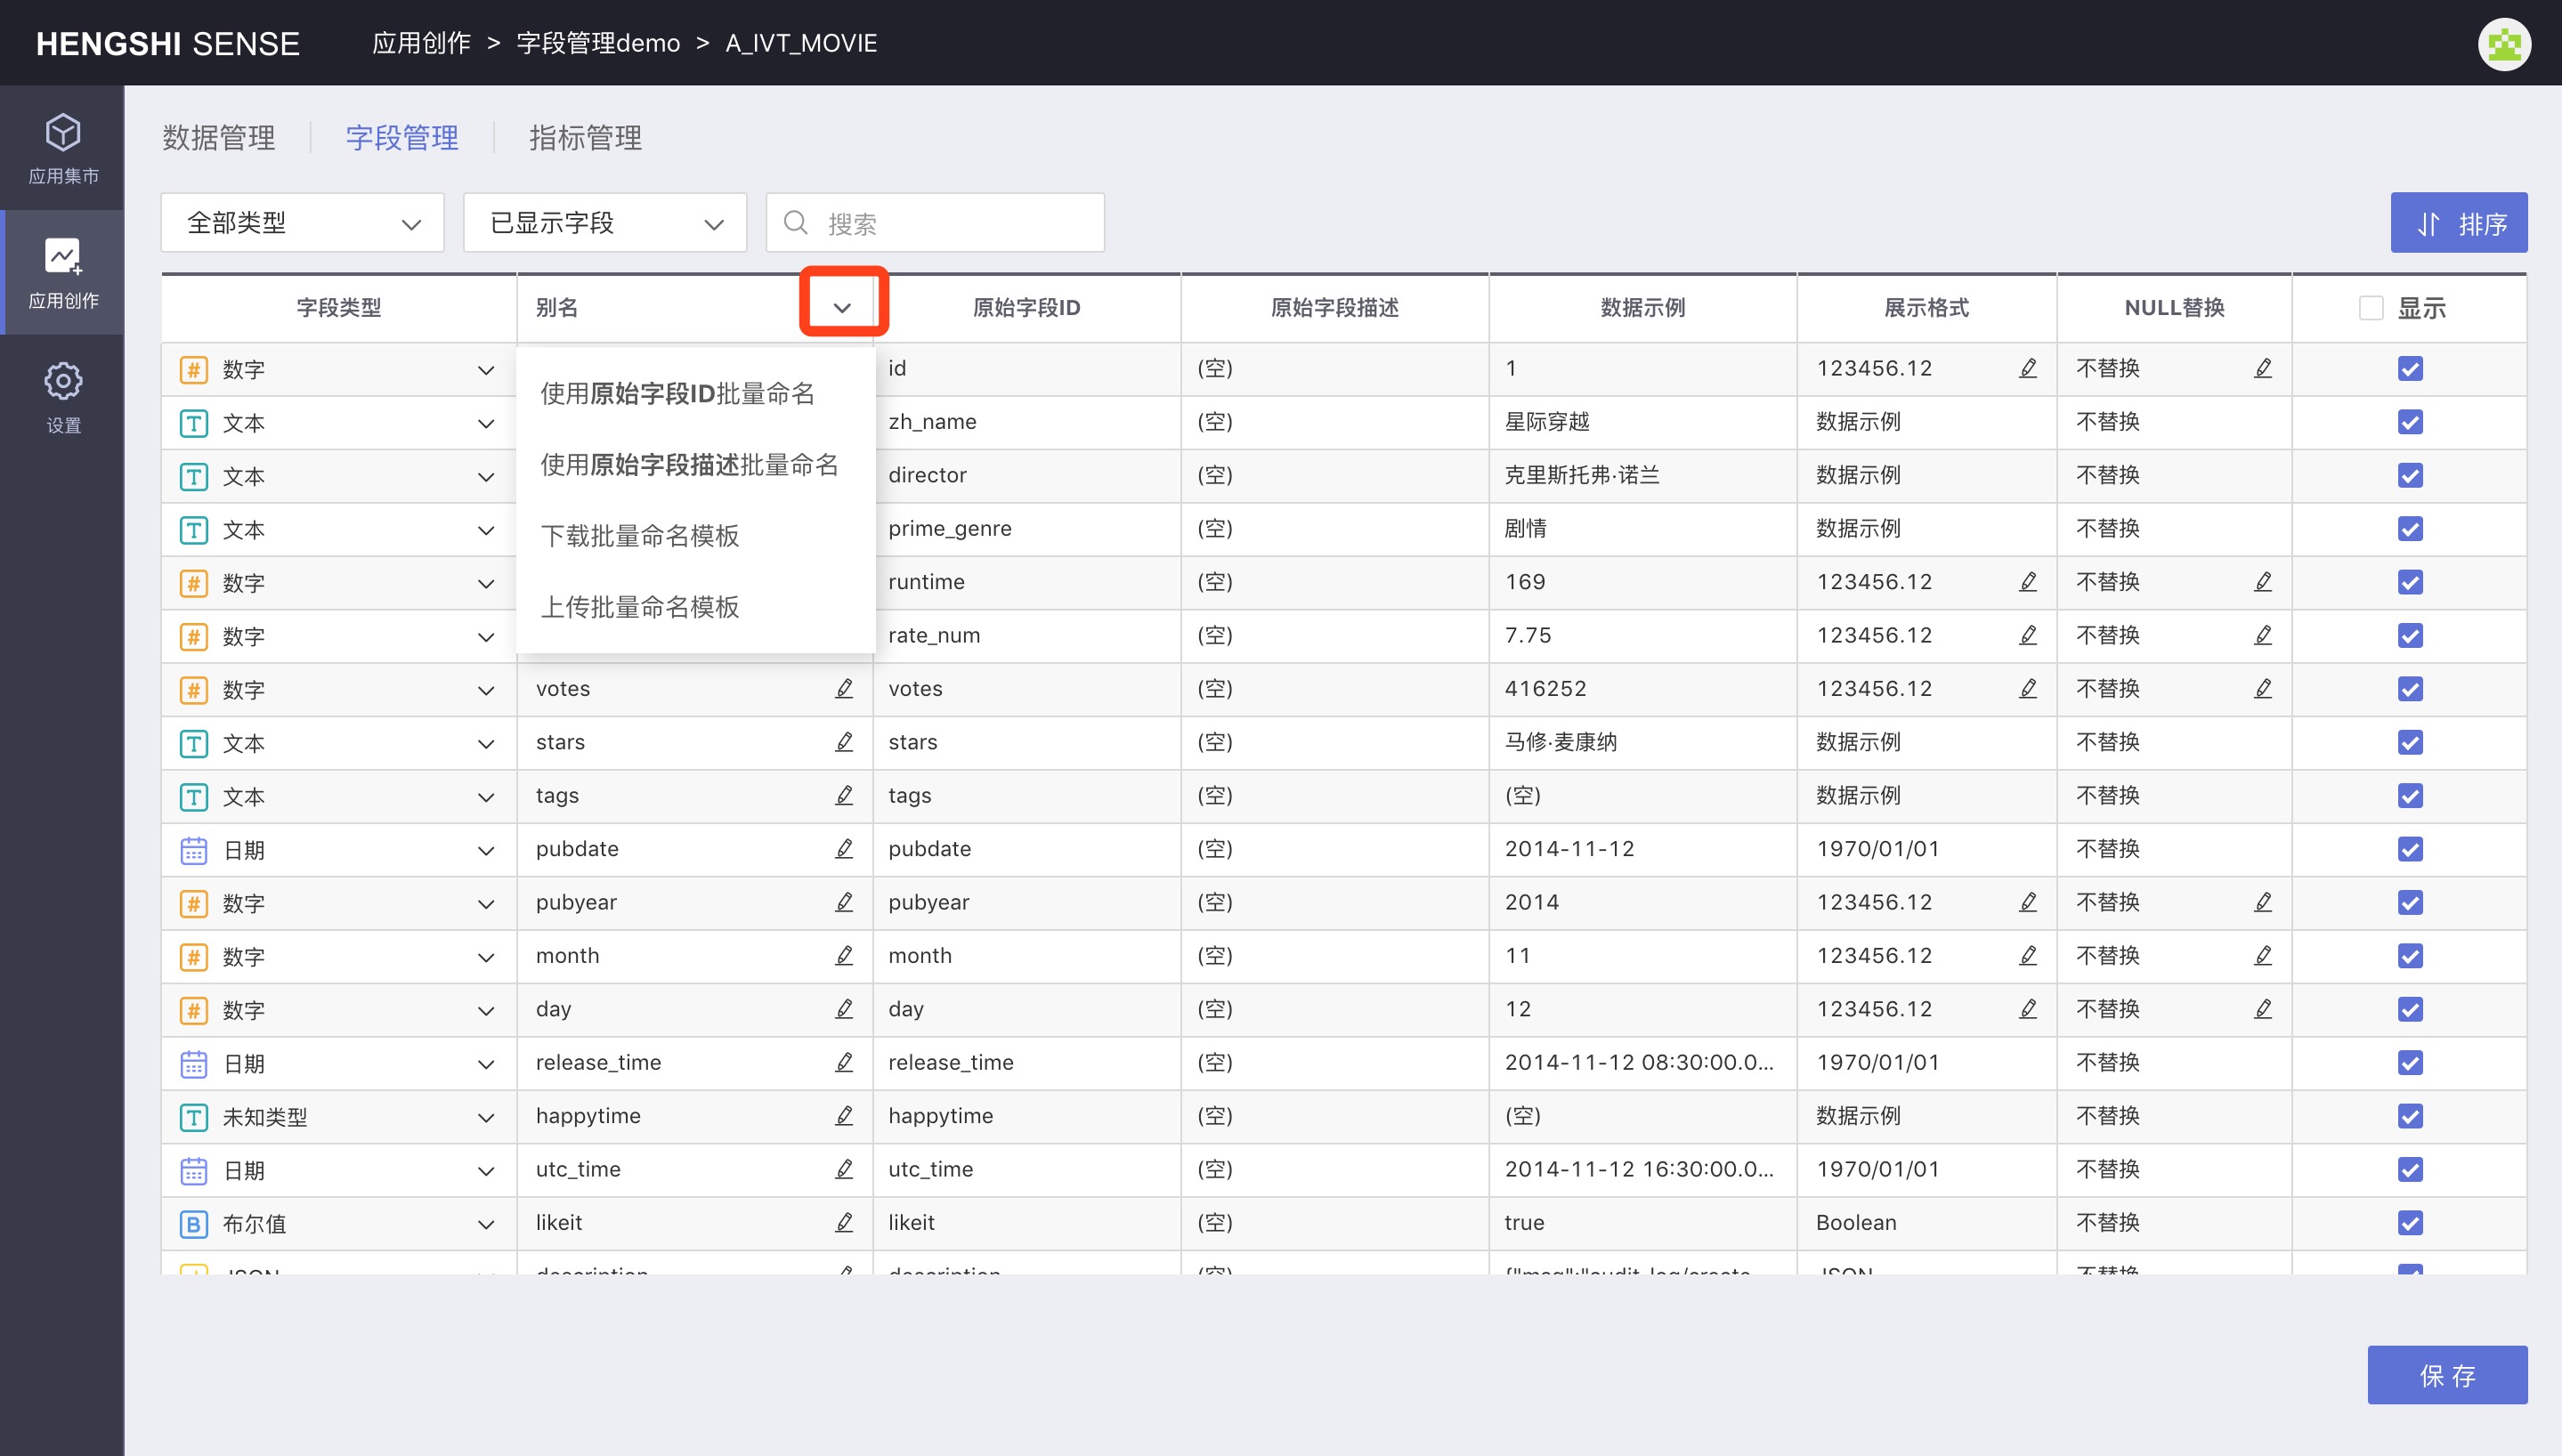
Batch Naming Using Original Field ID
Click Batch Naming Using Original Field ID. The Original Field ID value will fill into Alias. Click save to take effect.
Batch Naming Using Original Field Description
In field management, the Original Field Description column shows comments added for the field in the original database. Click Batch Naming Using Original Field Description. The Original Field Description value will fill into Alias. Click save to take effect.
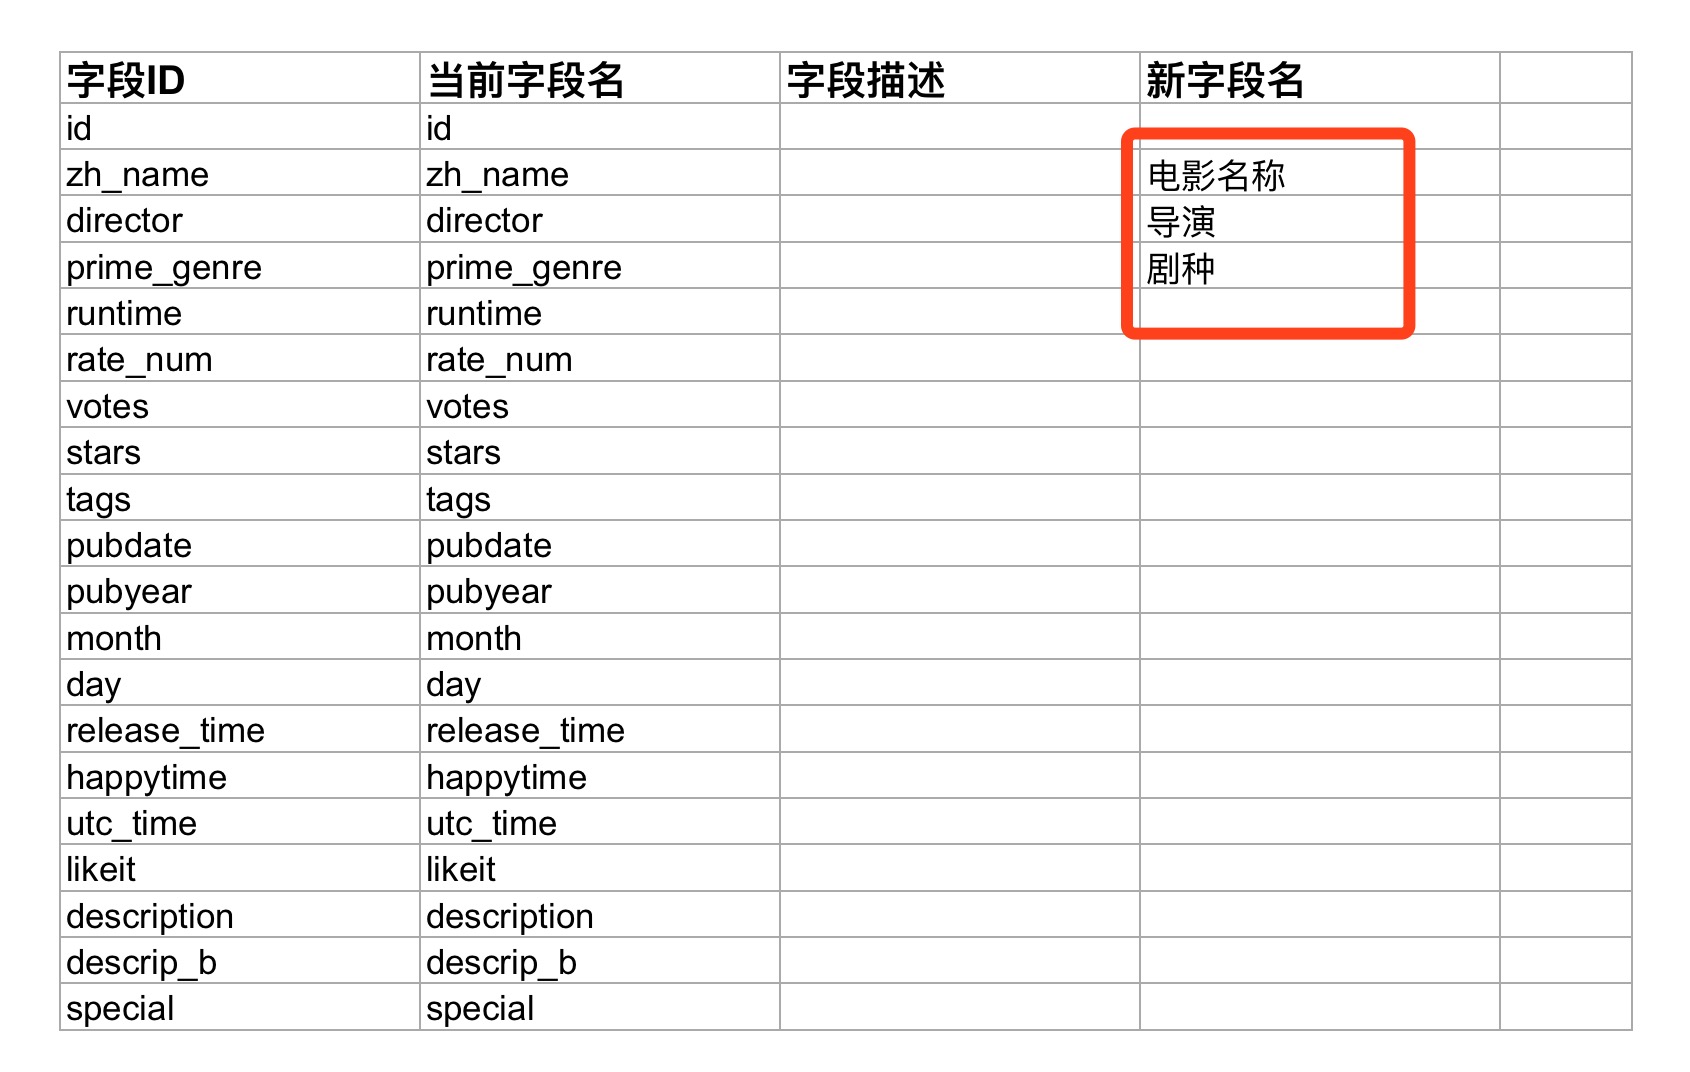
Download Batch Naming Template
Click Download Batch Naming Template to download an Excel template file locally. You can enter new names in the New Field name, then upload.
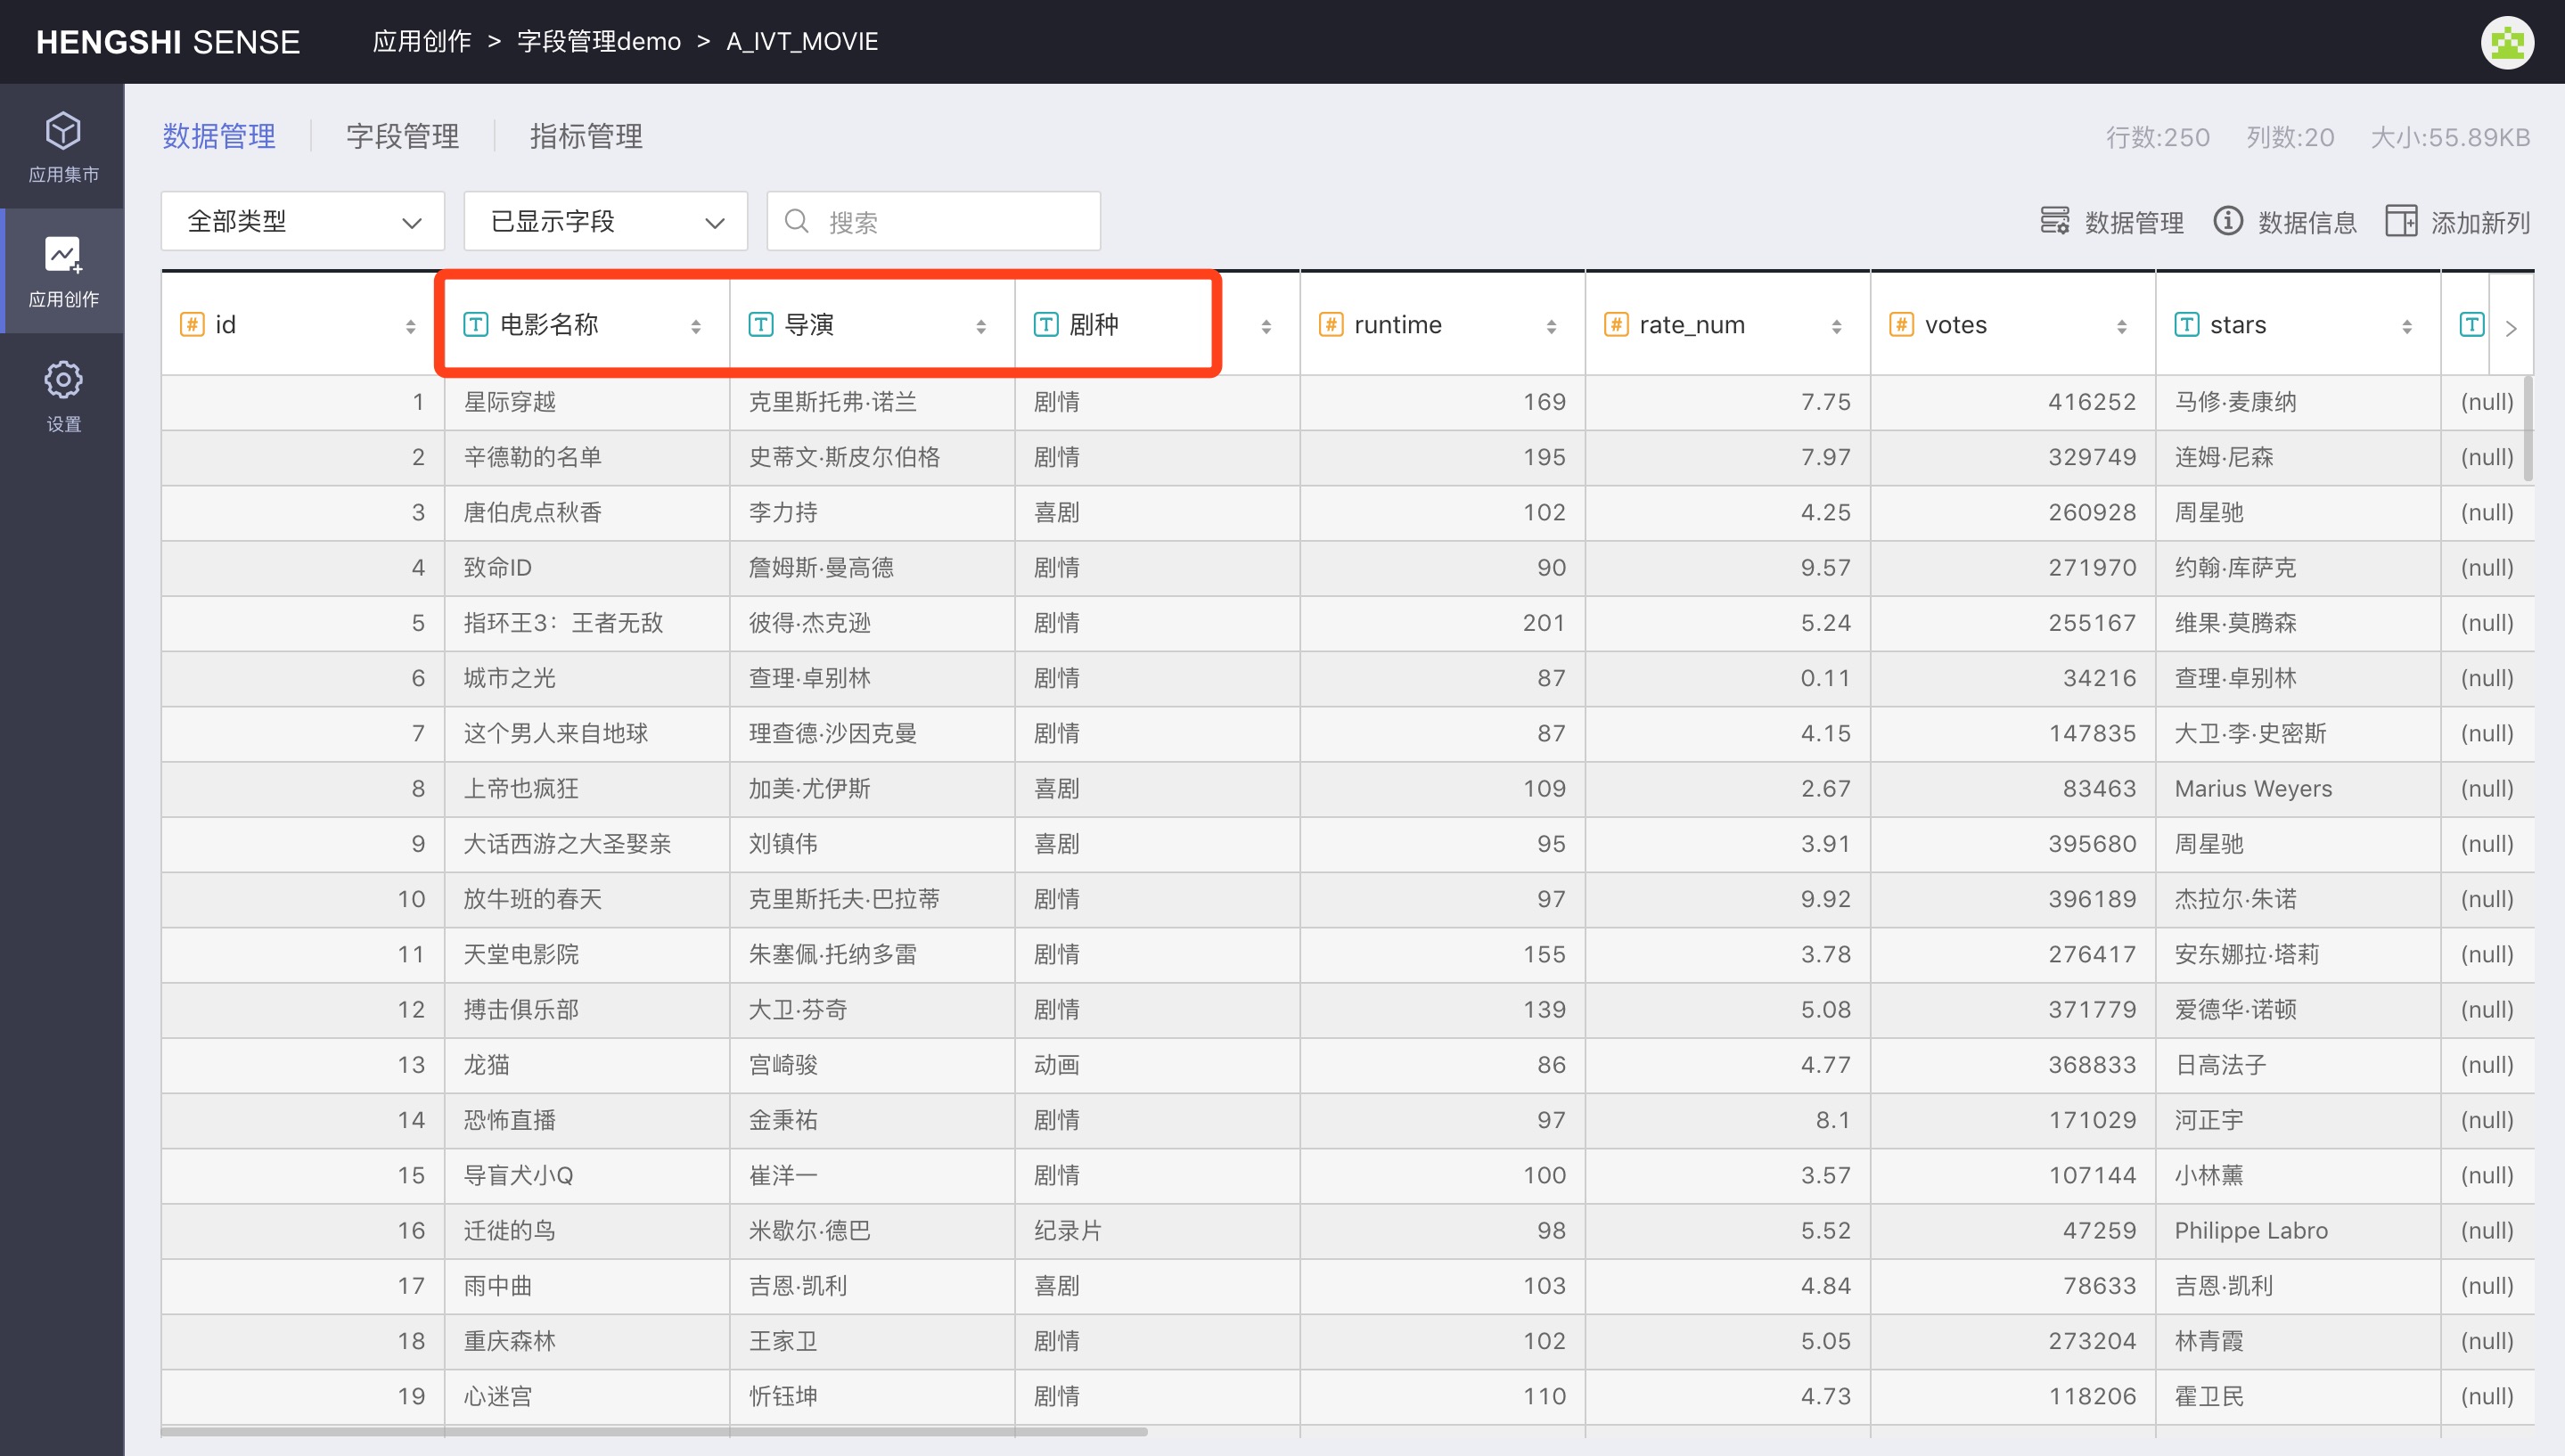
Upload Batch Naming Template
Click Upload Batch Naming Template to upload the modified template file. After successful upload, the field names will take effect immediately.
Numeric Display Format
Click the edit button in the Display Format of a numeric field to pop up the display format window, which allows you to set various numeric formats that will affect how field values are displayed in datasets and charts.
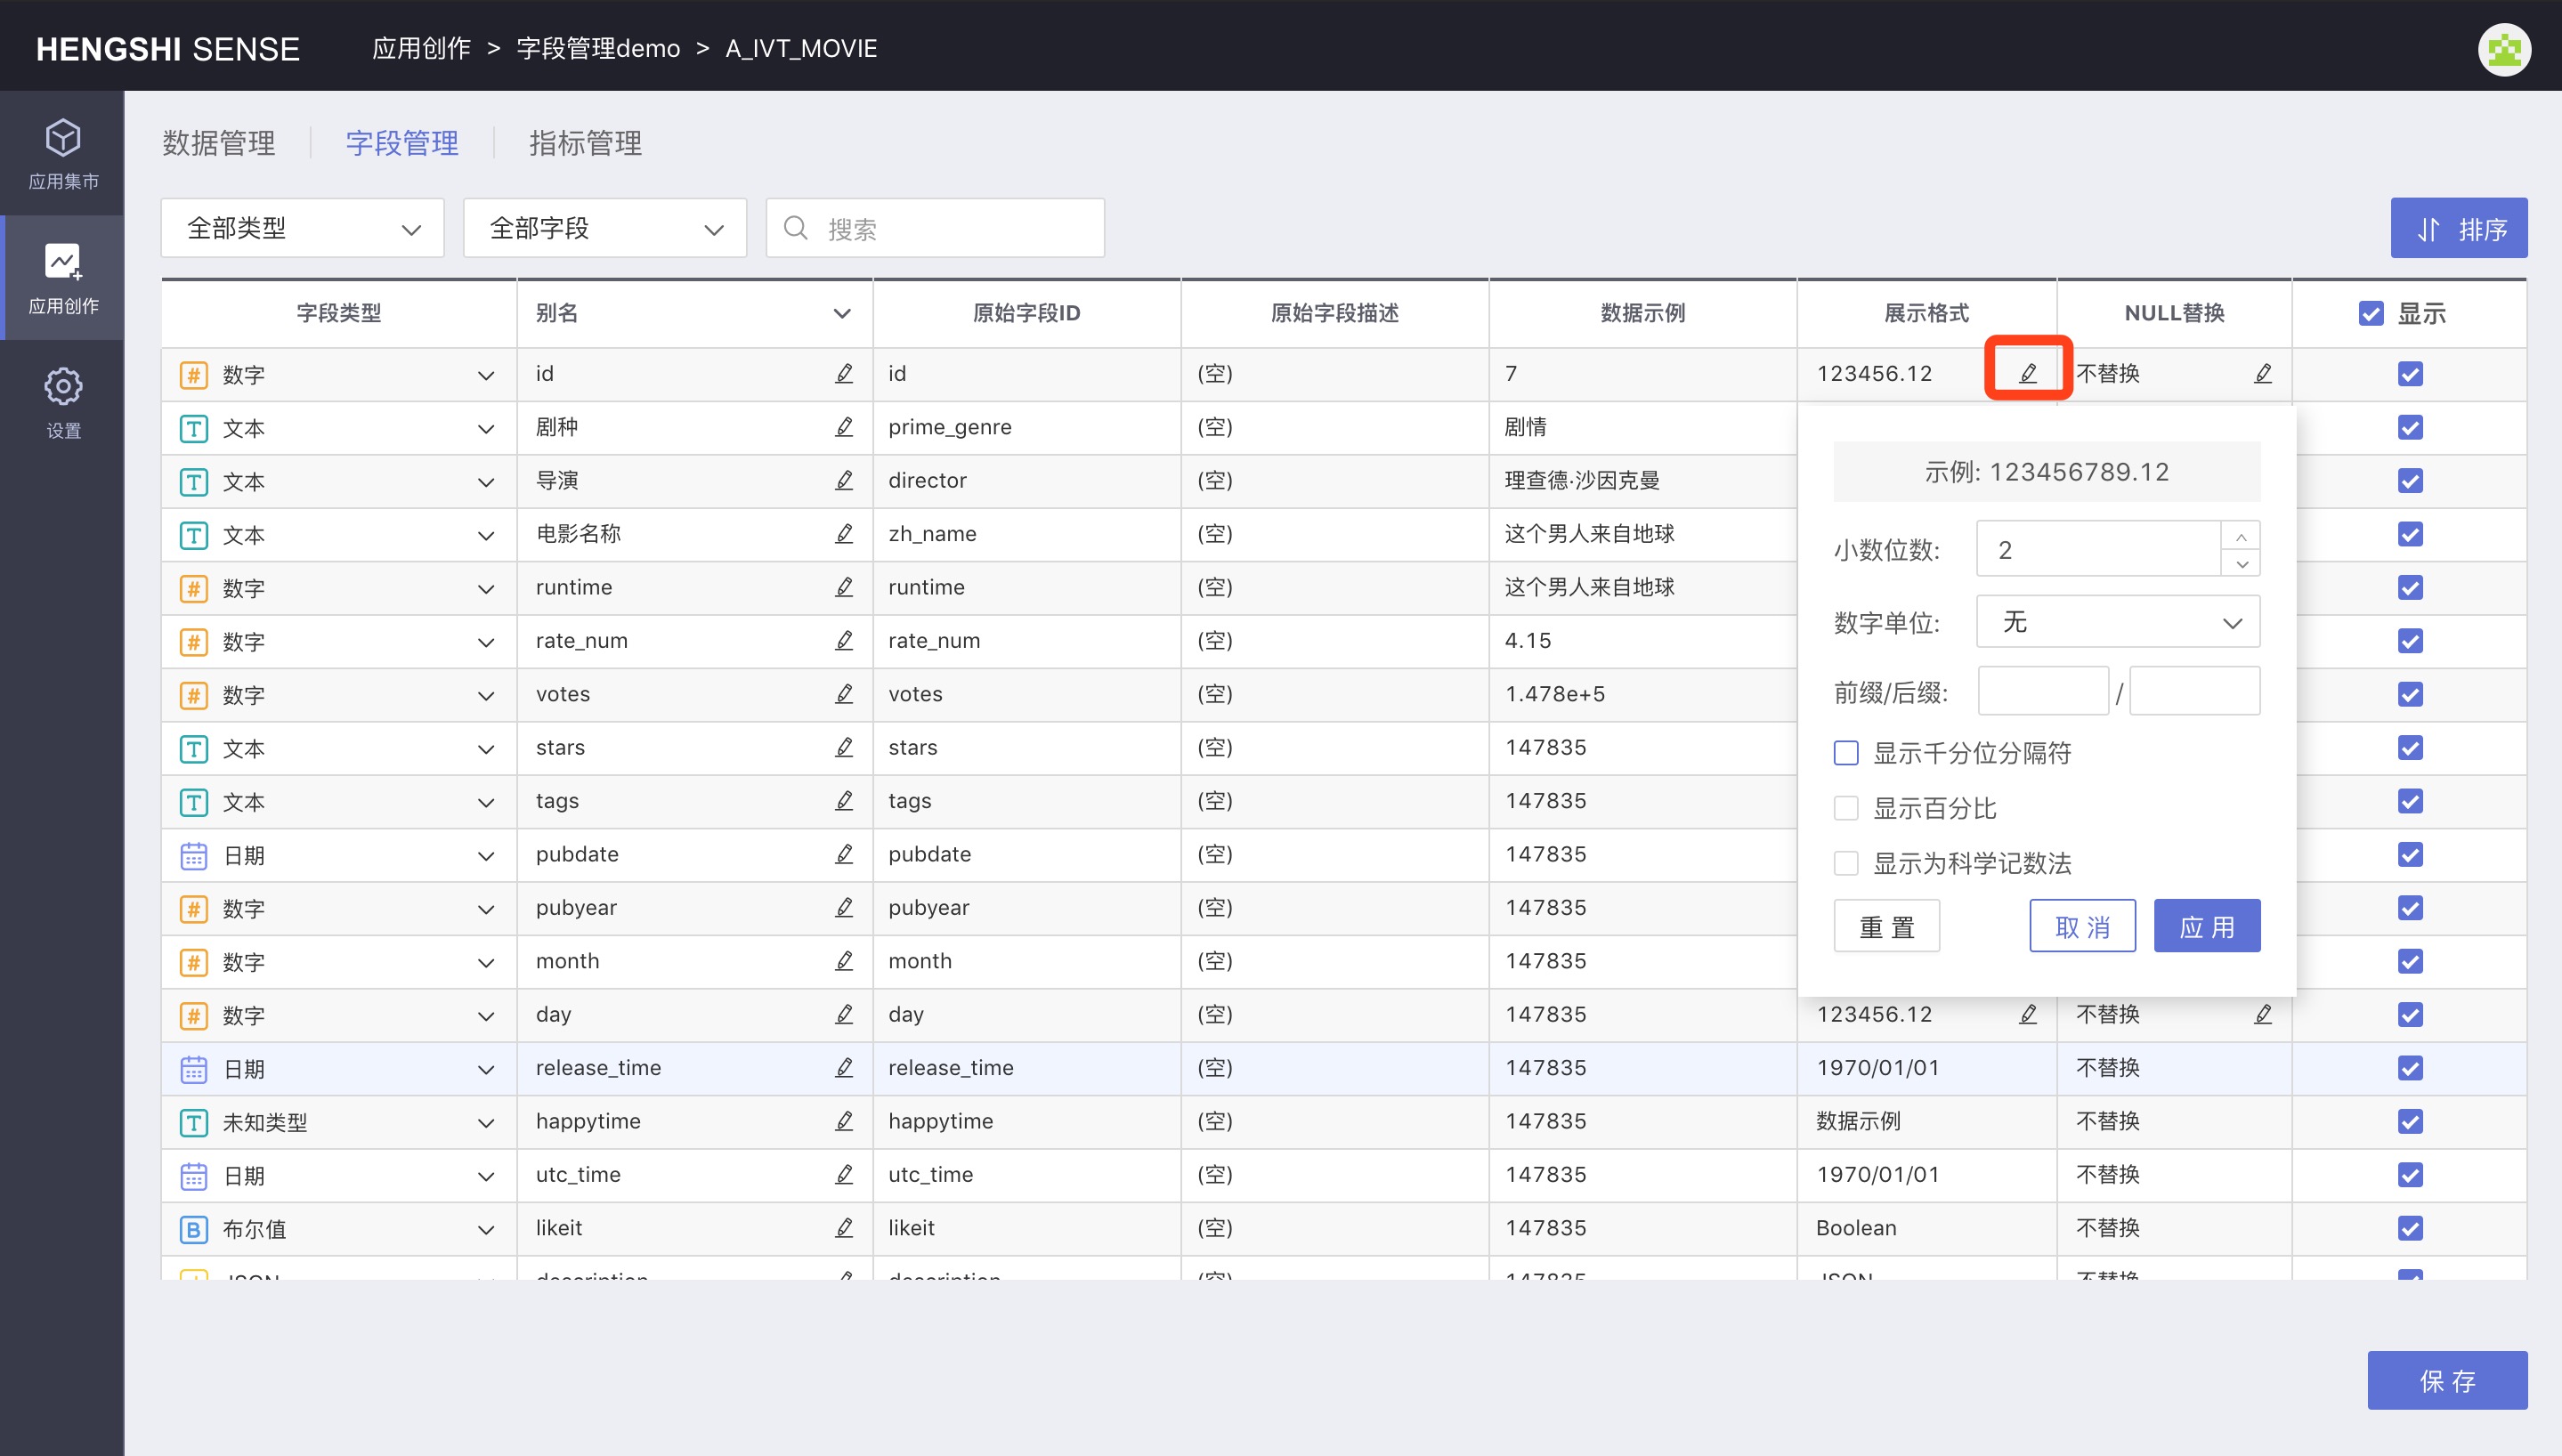
Number of Decimal Places
Set to 2 by default. You can increase or decrease the number by clicking the up and down arrows.
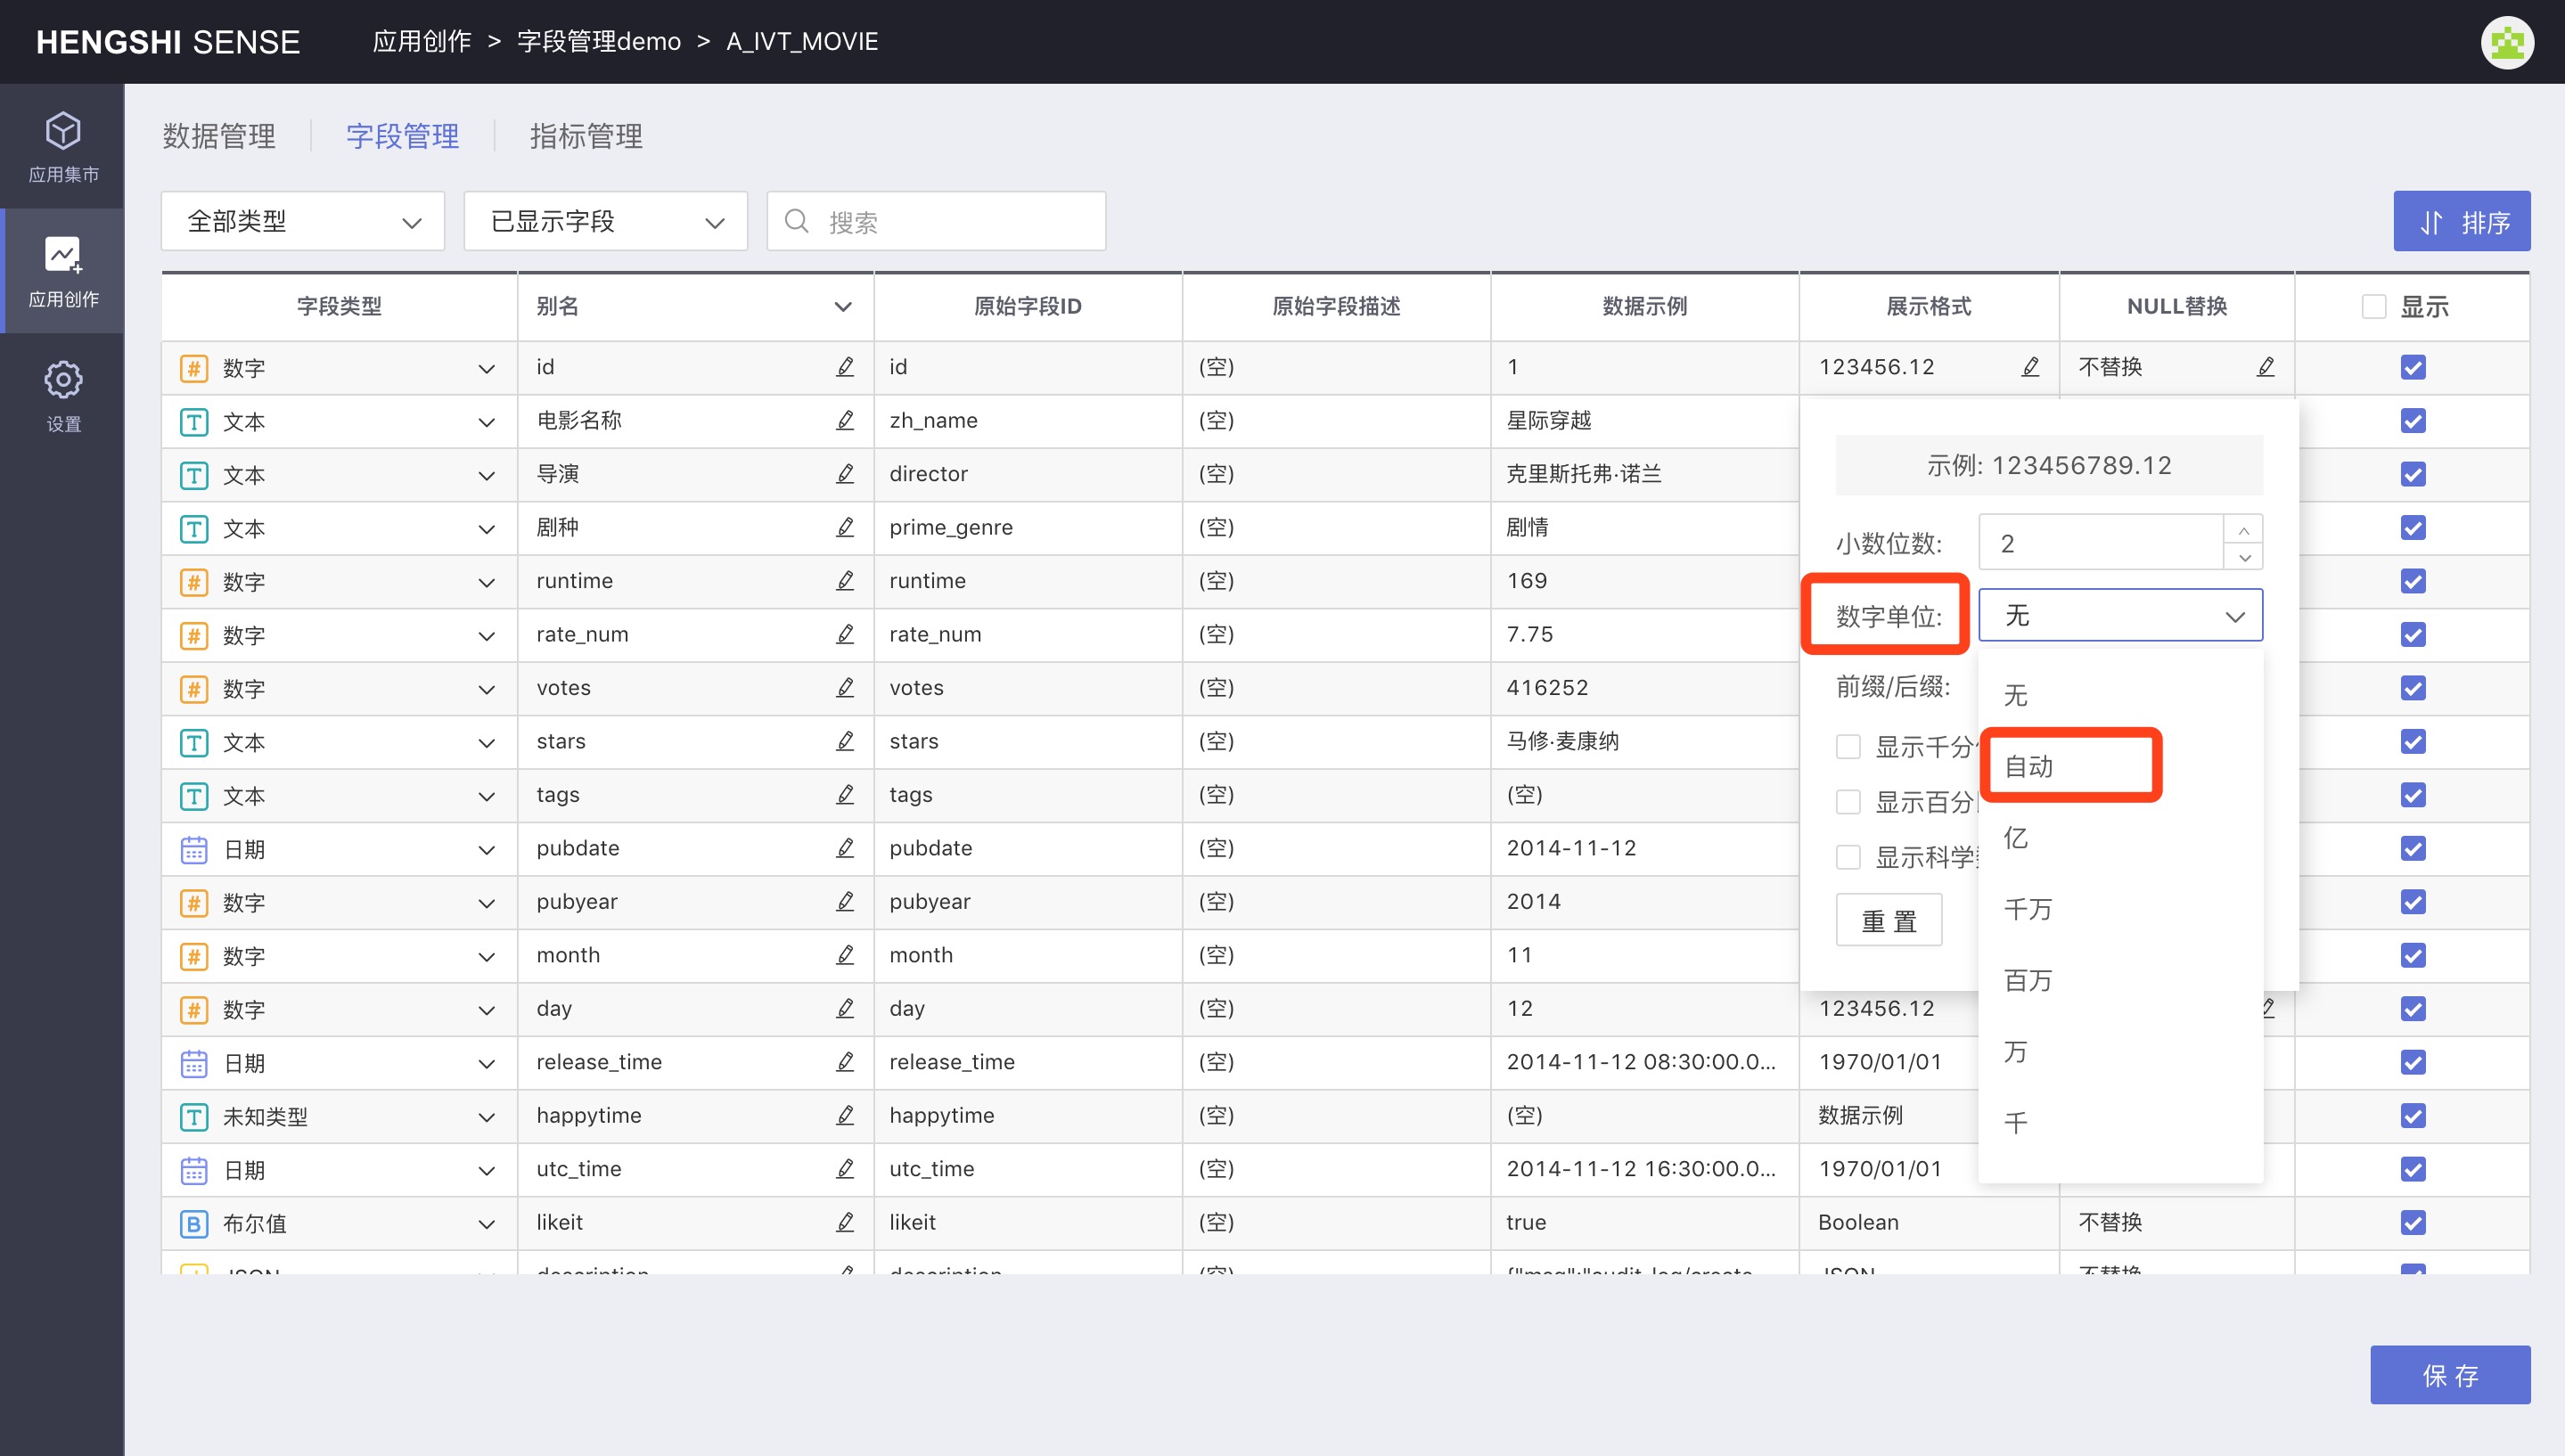
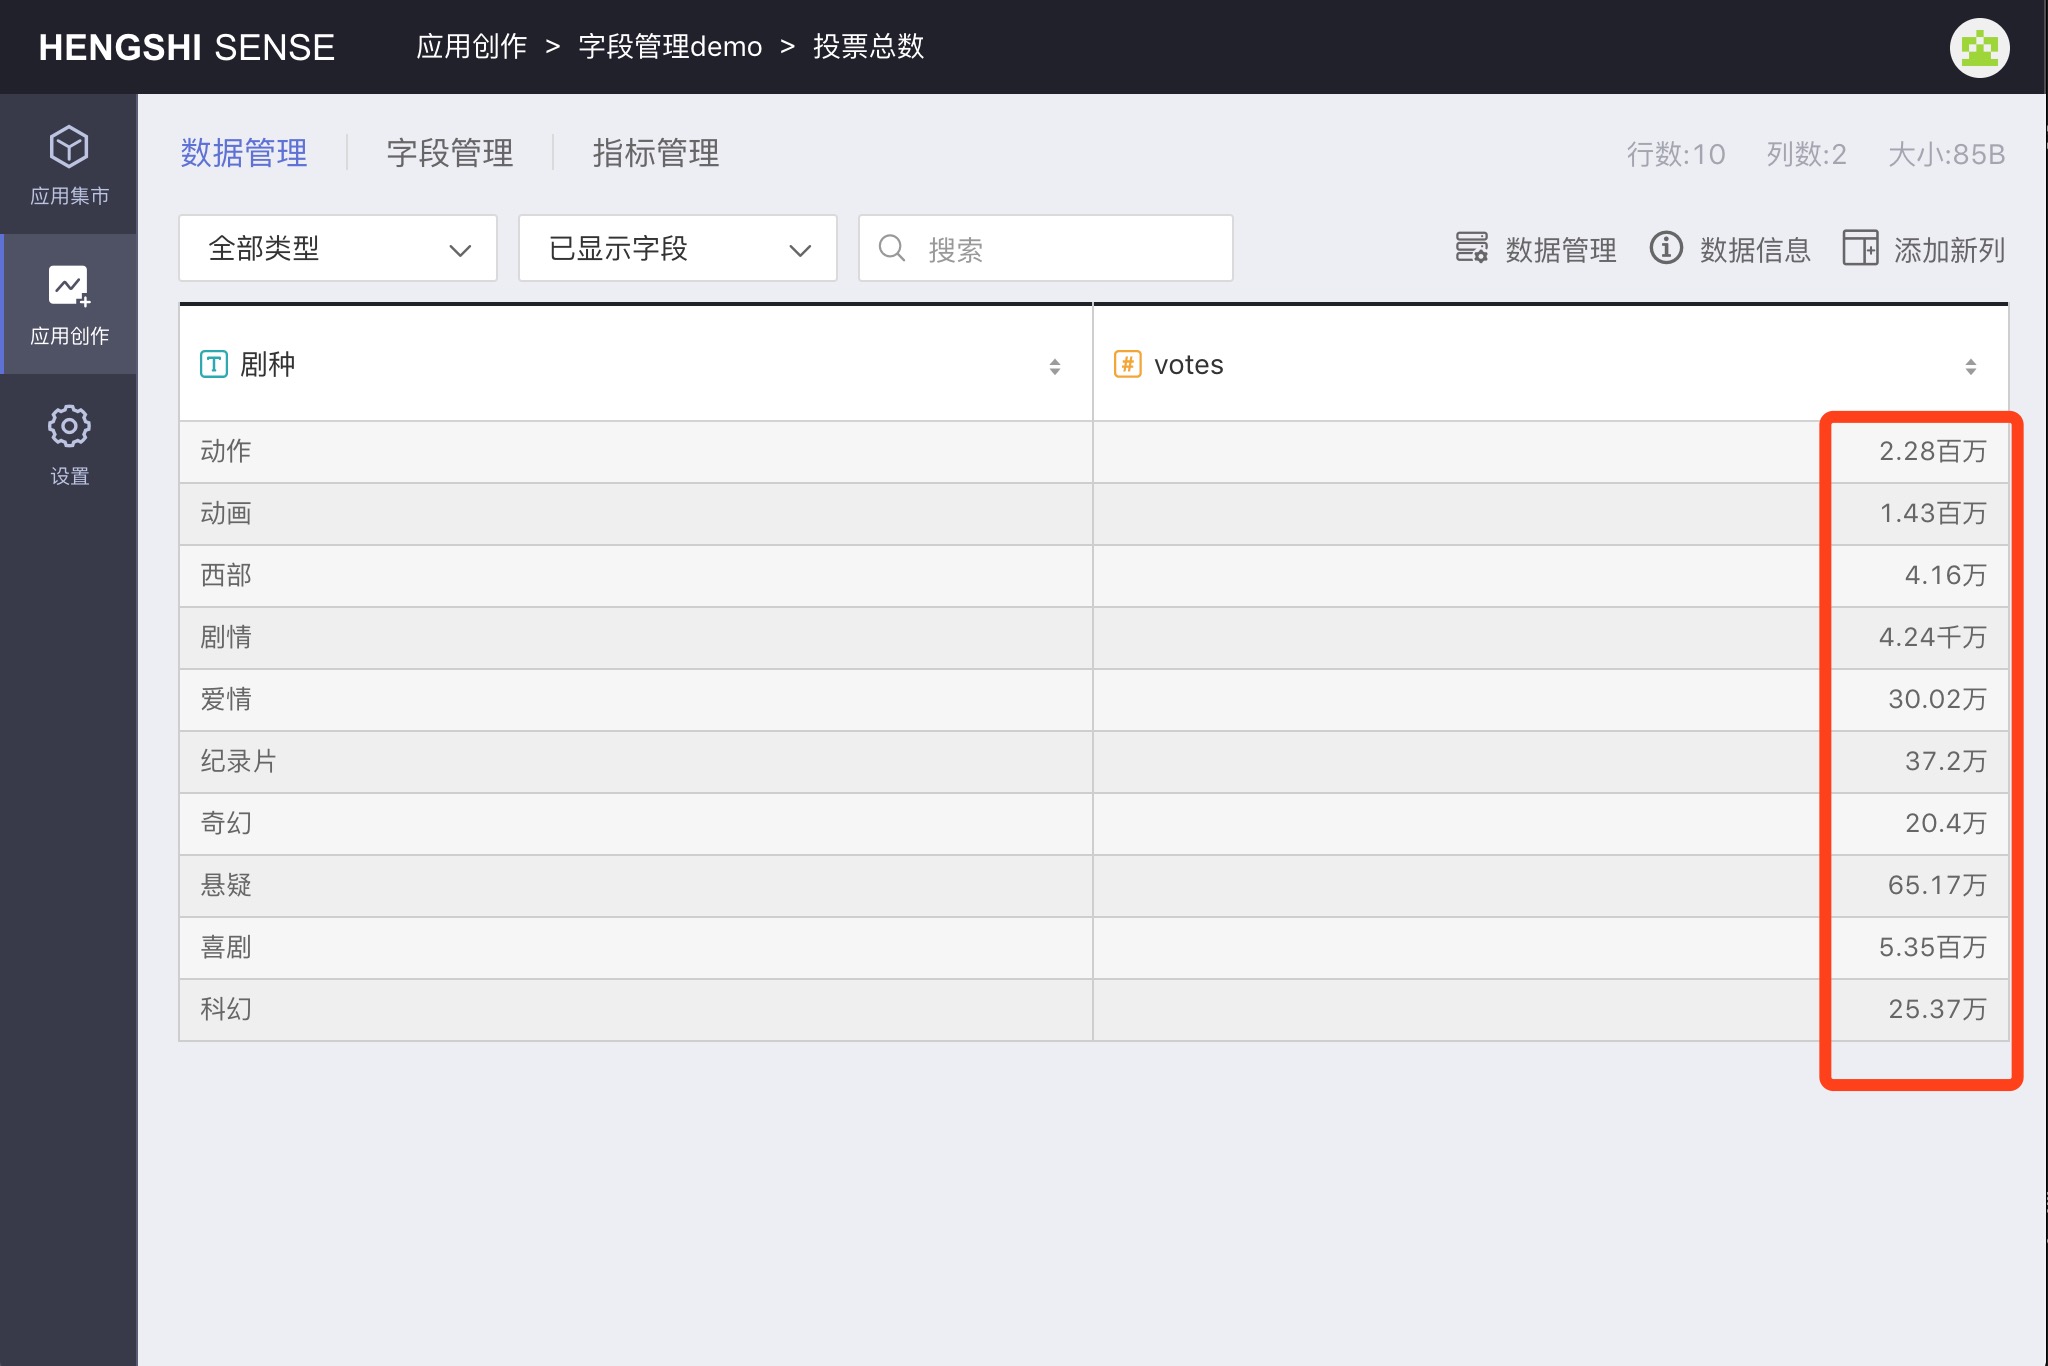
Numeric Units
Users can choose a fixed unit, such as thousands, tens of thousands, or billions. You can also select Auto, and the system will display the corresponding unit based on the magnitude of the number, as in the votes column shown in the image below, where the numbers have different units.
Prefix/Suffix
Enter a prefix/suffix. It will be added before and after the field value.
Display Thousands Separator
When selected, numbers will be displayed with a comma as the thousands separator, e.g., 1,000,000.123.
Display as Percentage
Display the number in % format, e.g., 0.54 displayed as 54%.
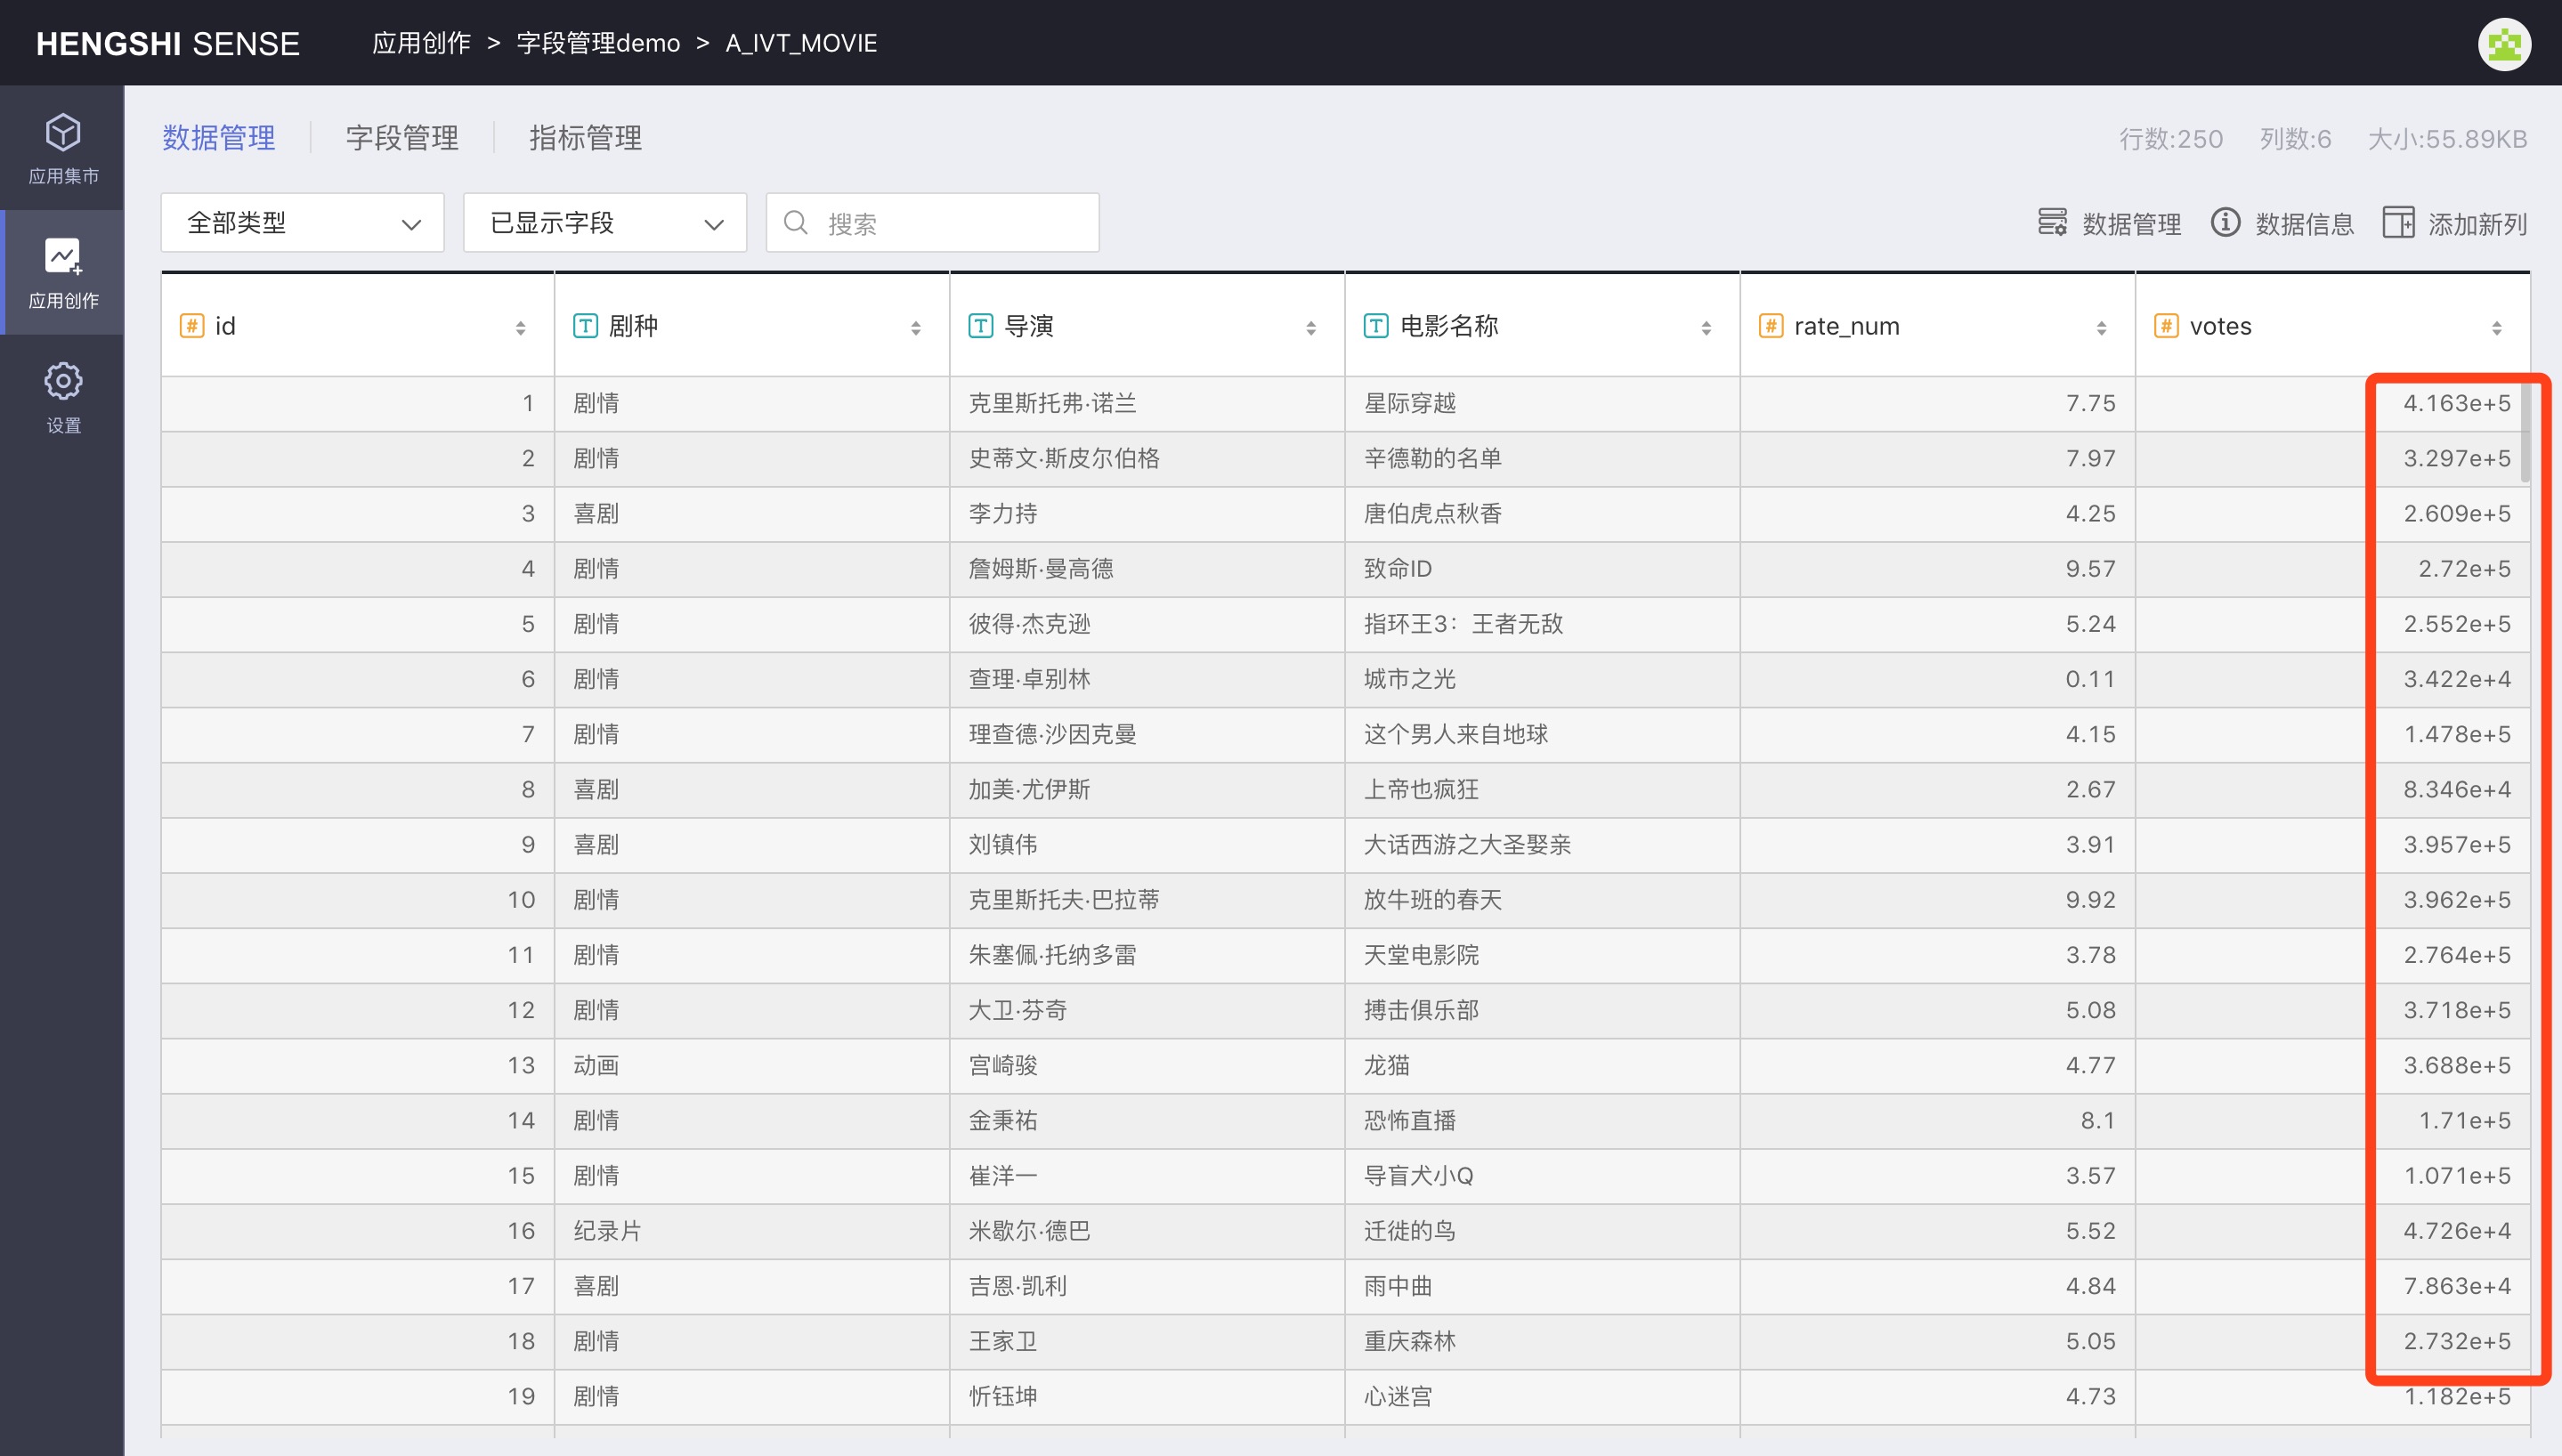
Display as Scientific Notation
Display numbers in scientific notation.
Reset
Click the Reset button to clear all set formats and reset to the initial default format, then click Apply -> Save to take effect.
Apply
Click the Apply button for the set format to be temporarily saved in the display format. If you do not click Apply and reopen Display Format, it will remain in the original format.
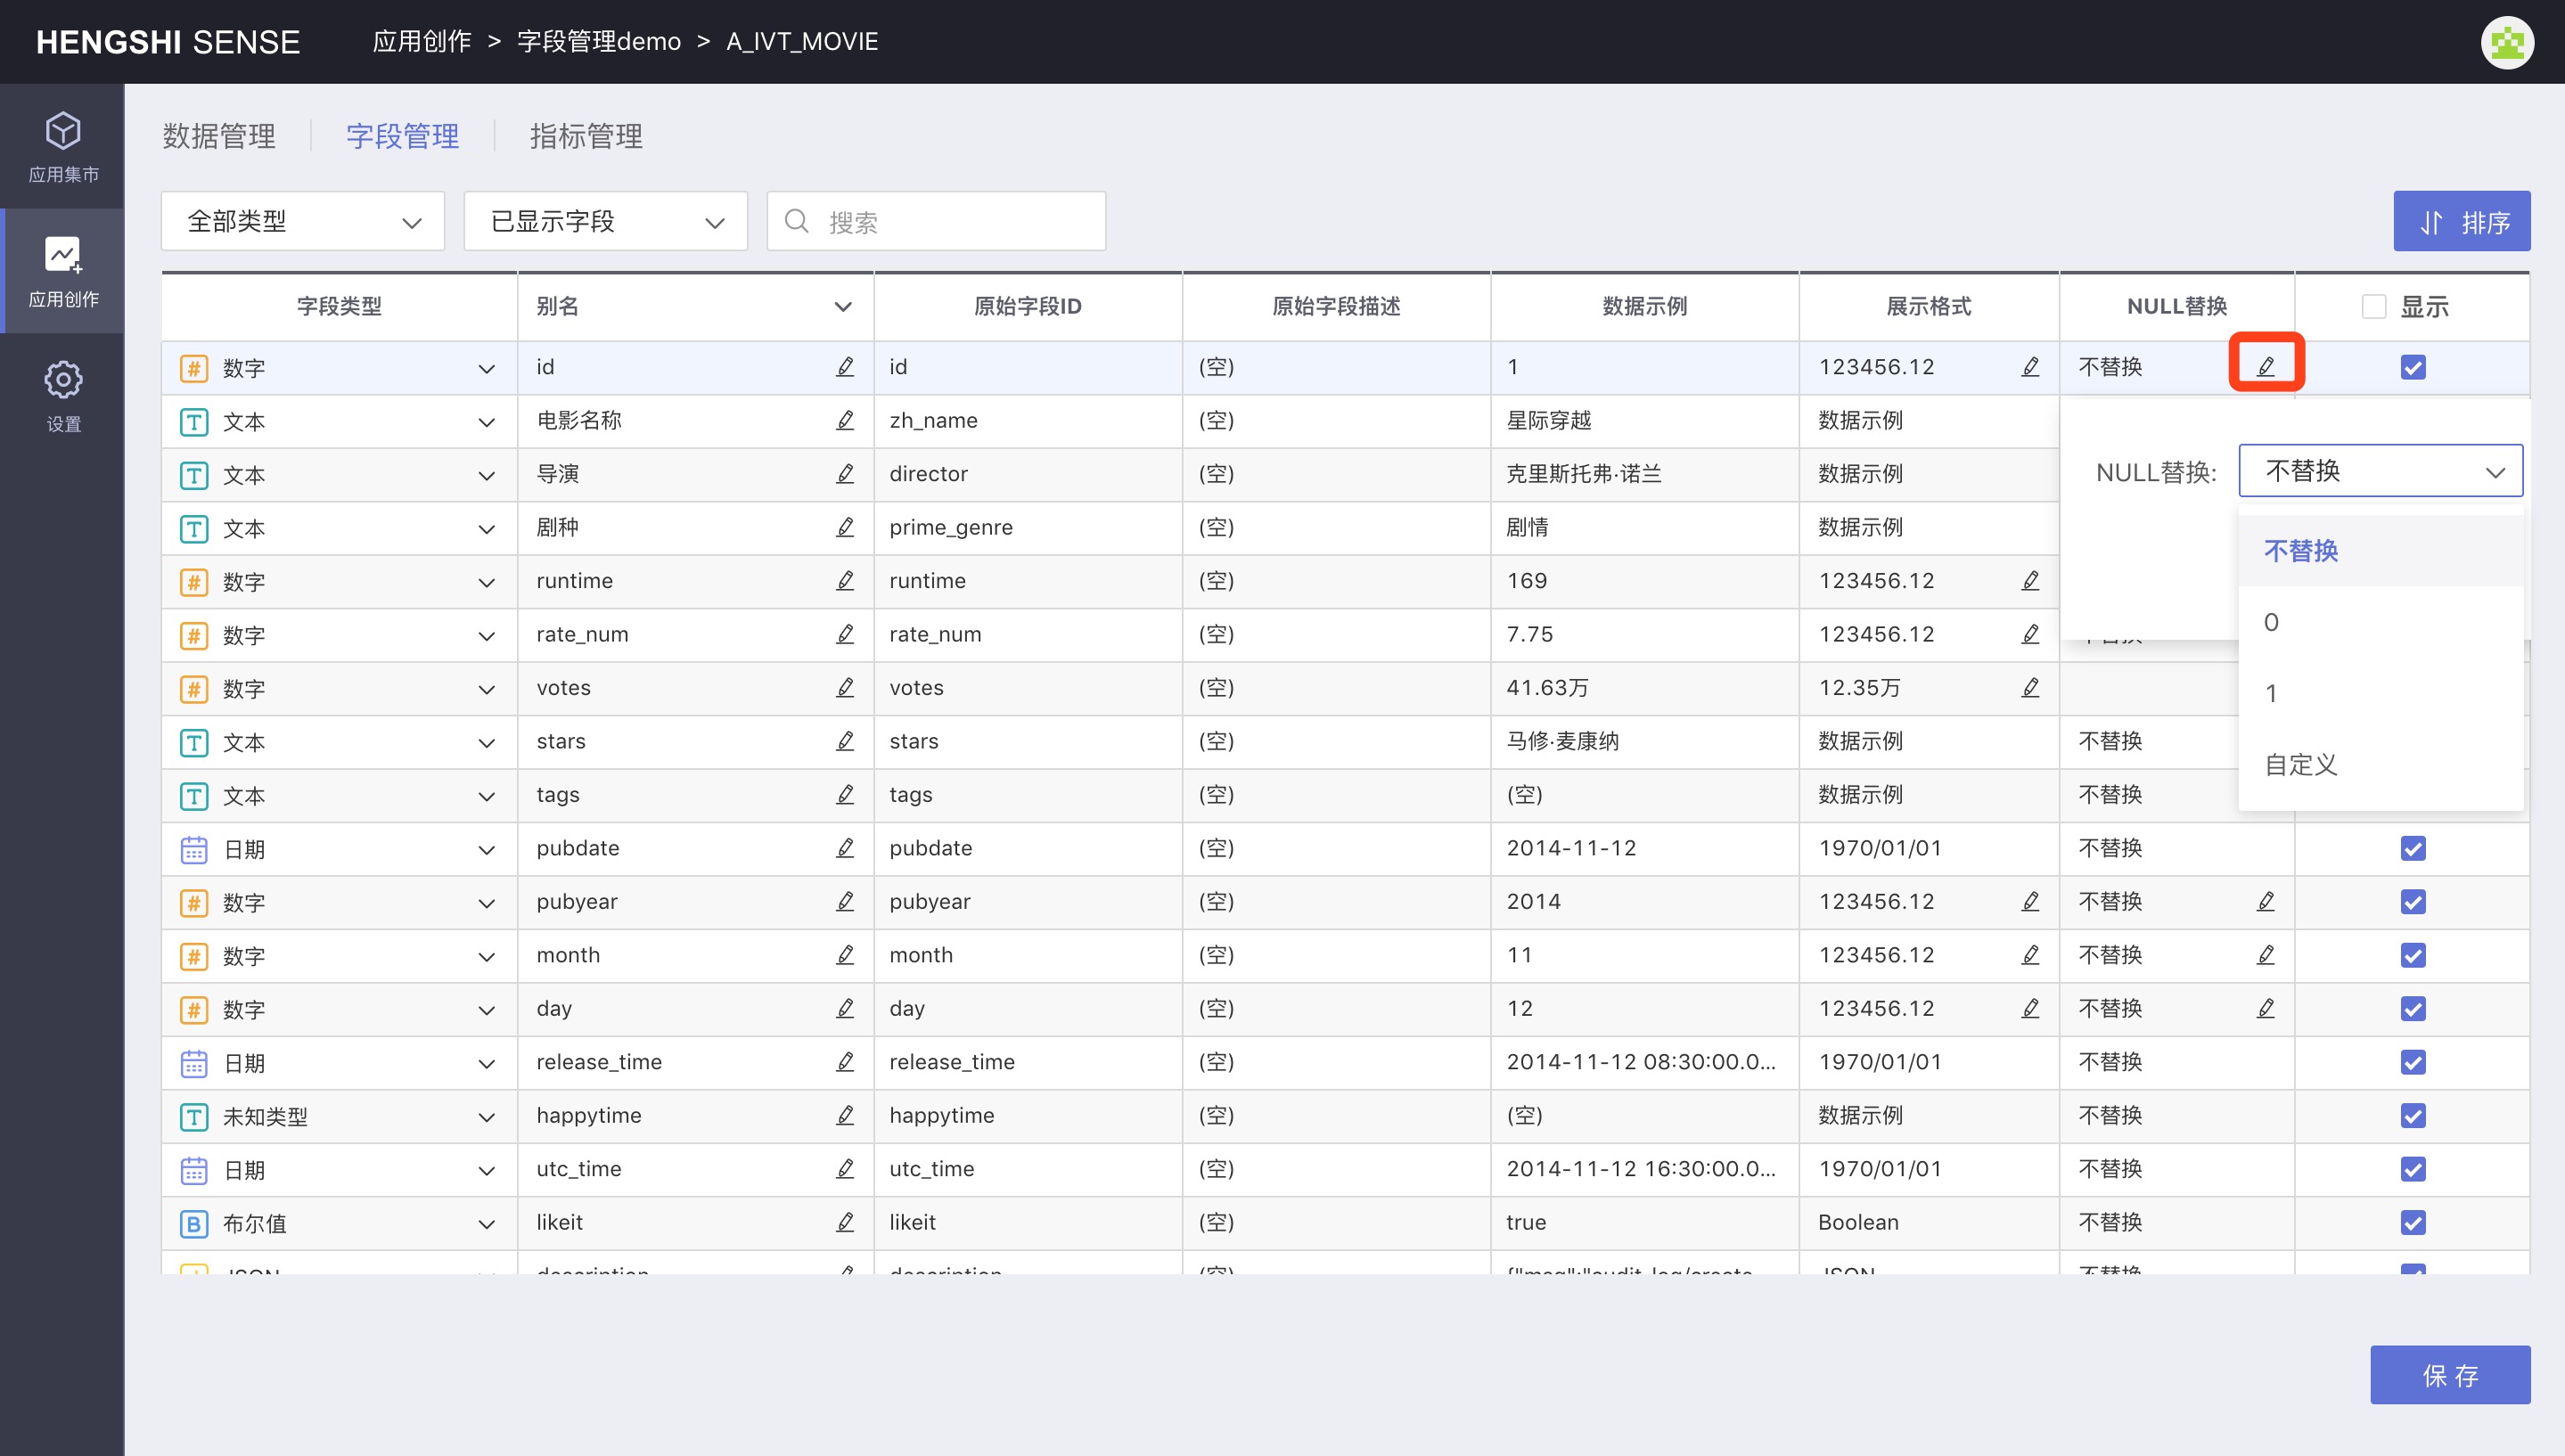
NULL Replacement
You can set to replace NULL values in a numeric column with 0,1 or another custom value. After setting, in all places where the column is used, whether in datasets/charts, the NULL value will display as the set value, and it will be used in calculations as well. This is to circumvent the issue in databases where computations with NULL result in NULL.
Set Visibility
Field hiding mainly serves two purposes:
- For the convenience of users viewing the data they care about. For example, if a new column is generated from an original column, the user may only need to view the new column, then the original column can be hidden.
- To speed up the process. When using a dataset for multi-stage processing, you can hide the fields that are not needed, and when generating a new dataset, fewer fields will be used, speeding up processing.
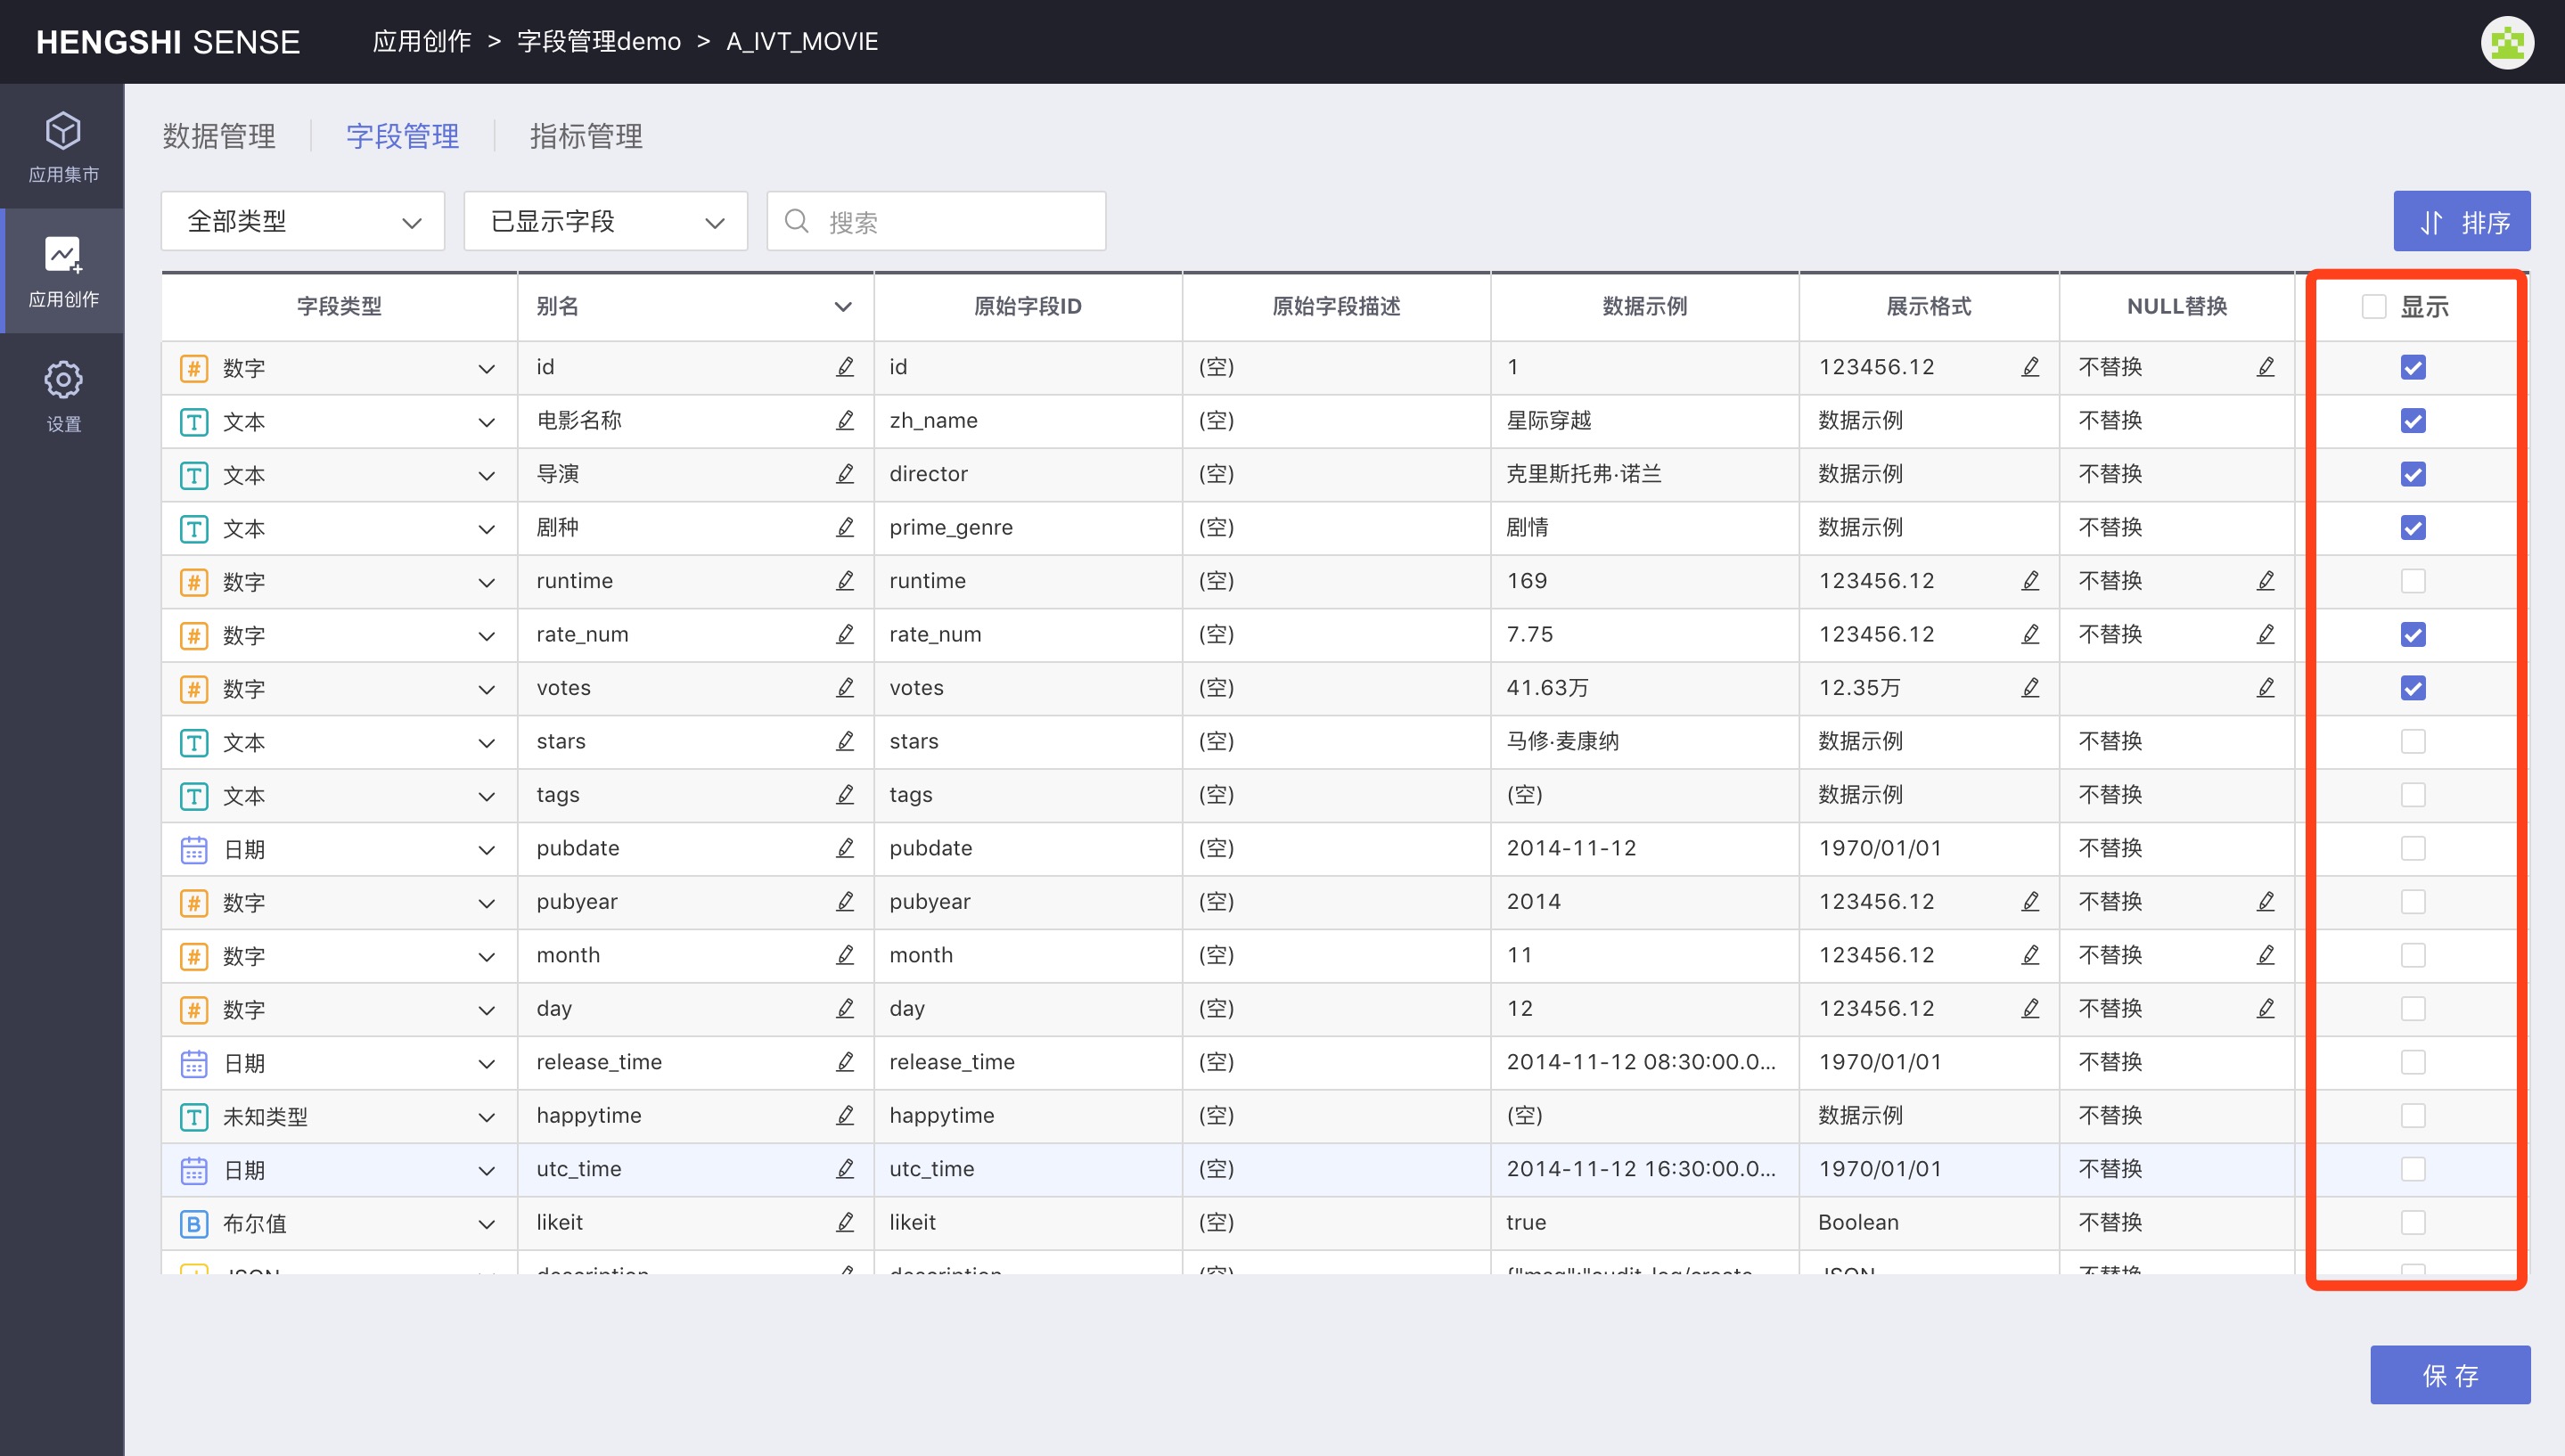
As shown above, deselect the fields you need to hide and save to complete the hiding of fields.
In addition to being managed in field management, hidden fields can also be operated on the data structure setting page when creating datasets.
Some considerations for hiding fields:
- Hidden fields cannot be used for plotting but can be used to add new fields and calculate metrics.
- Fields used in filters when creating datasets can be hidden.
- Fields with row permissions set in access control cannot be hidden.
- Fields used in charts cannot be hidden.
- Fields used in dashboard filters cannot be hidden.
- Fields used to create joined datasets, aggregate datasets, or merge/append datasets cannot be hidden.
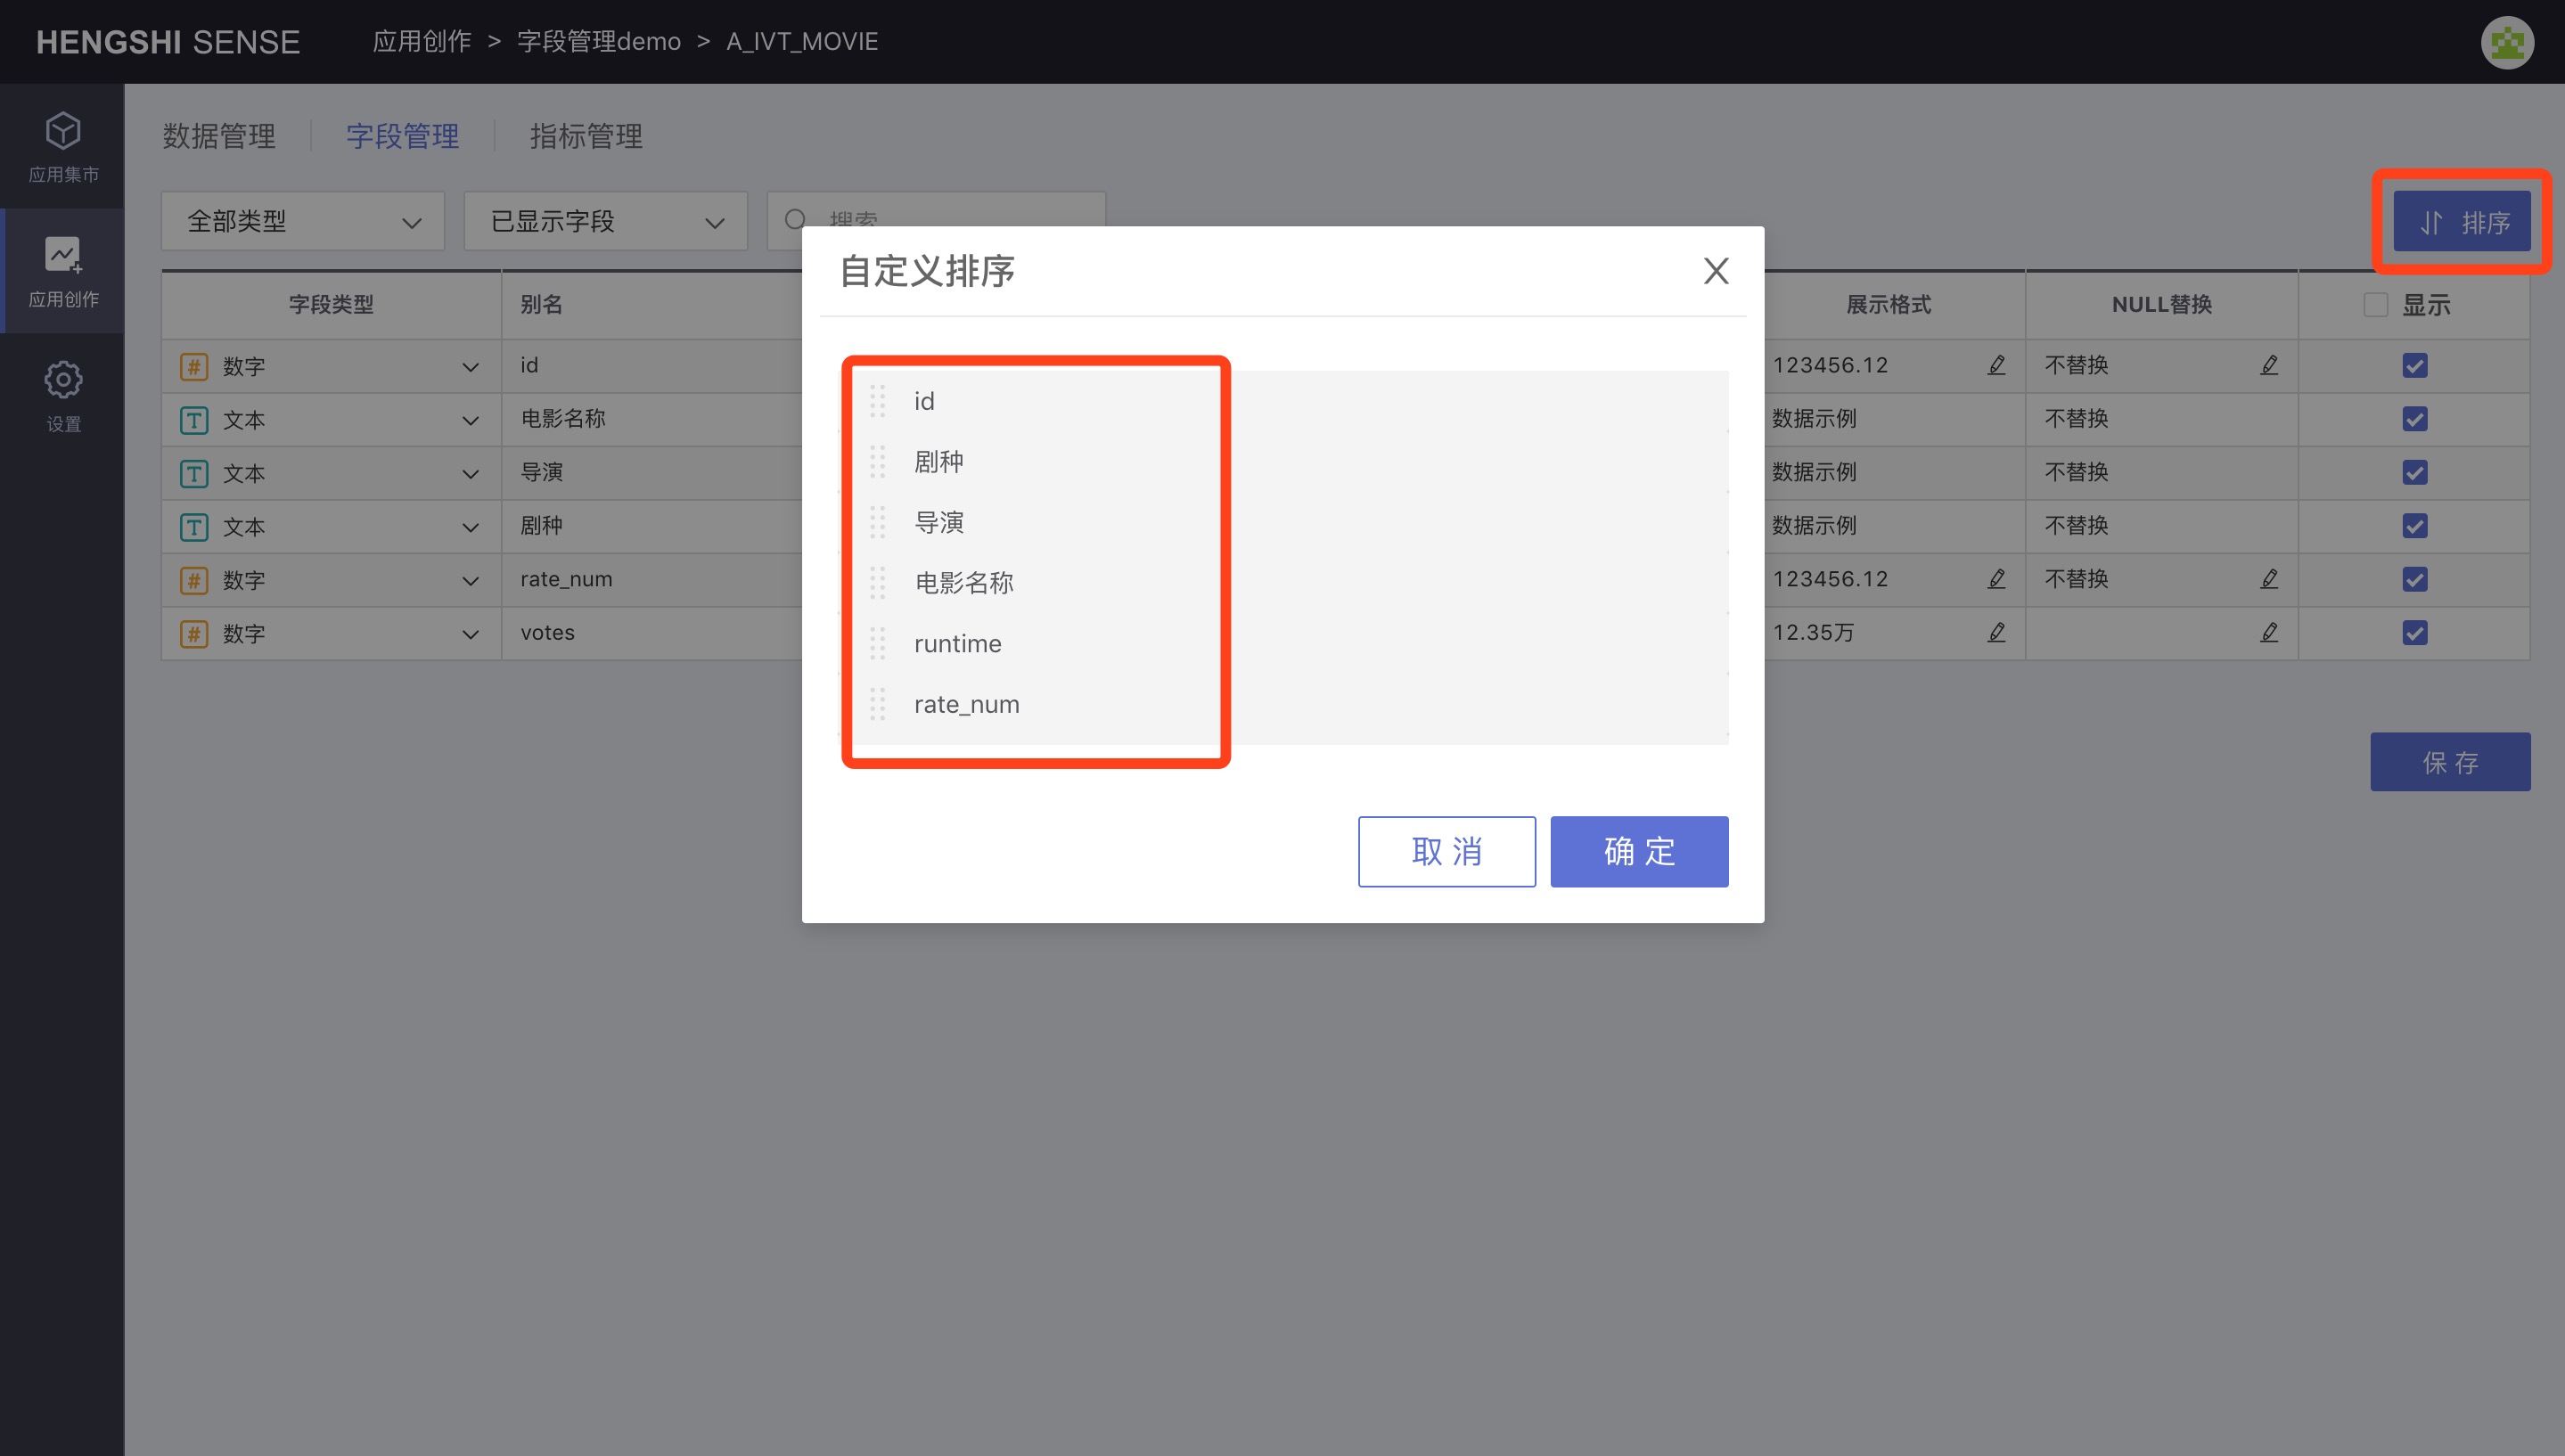
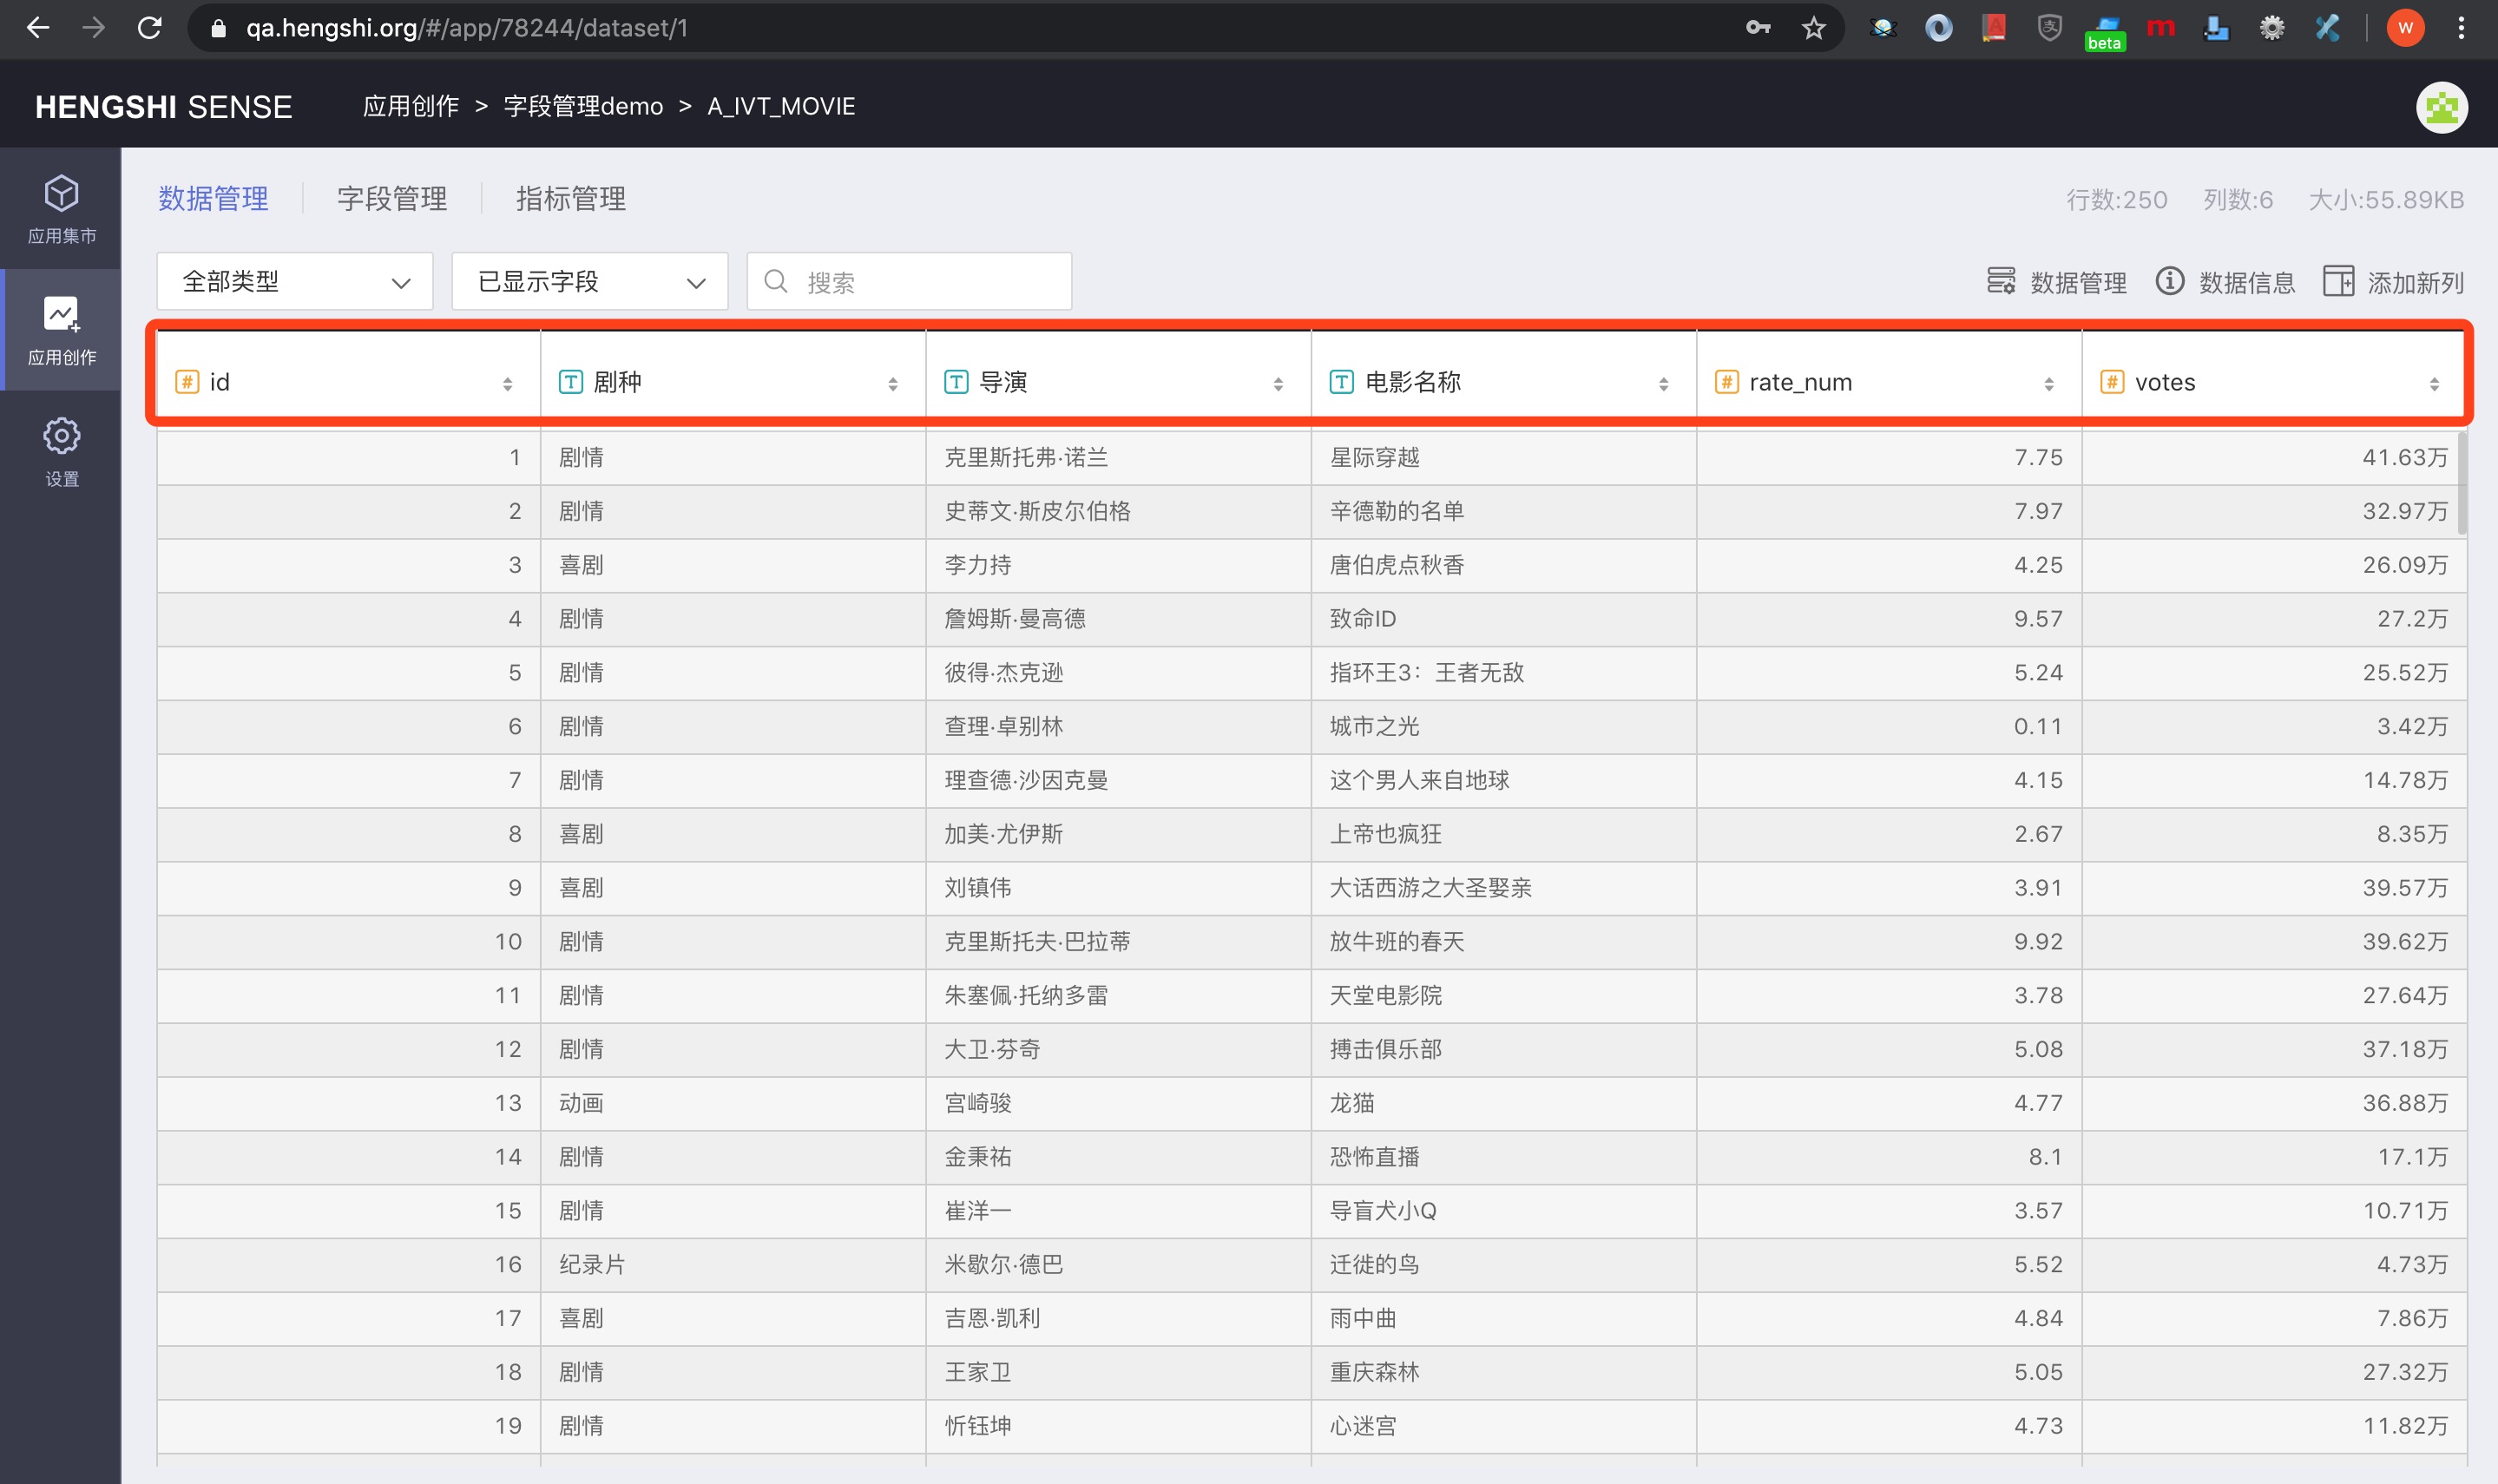
Field Sorting
Click Sort to pop up the Custom Sort window. You can drag fields to reorder them. After sorting, fields will be displayed in the set order in both Field Management and Data Management.
Sorting can only sort the displayed columns; hidden columns do not participate in sorting.
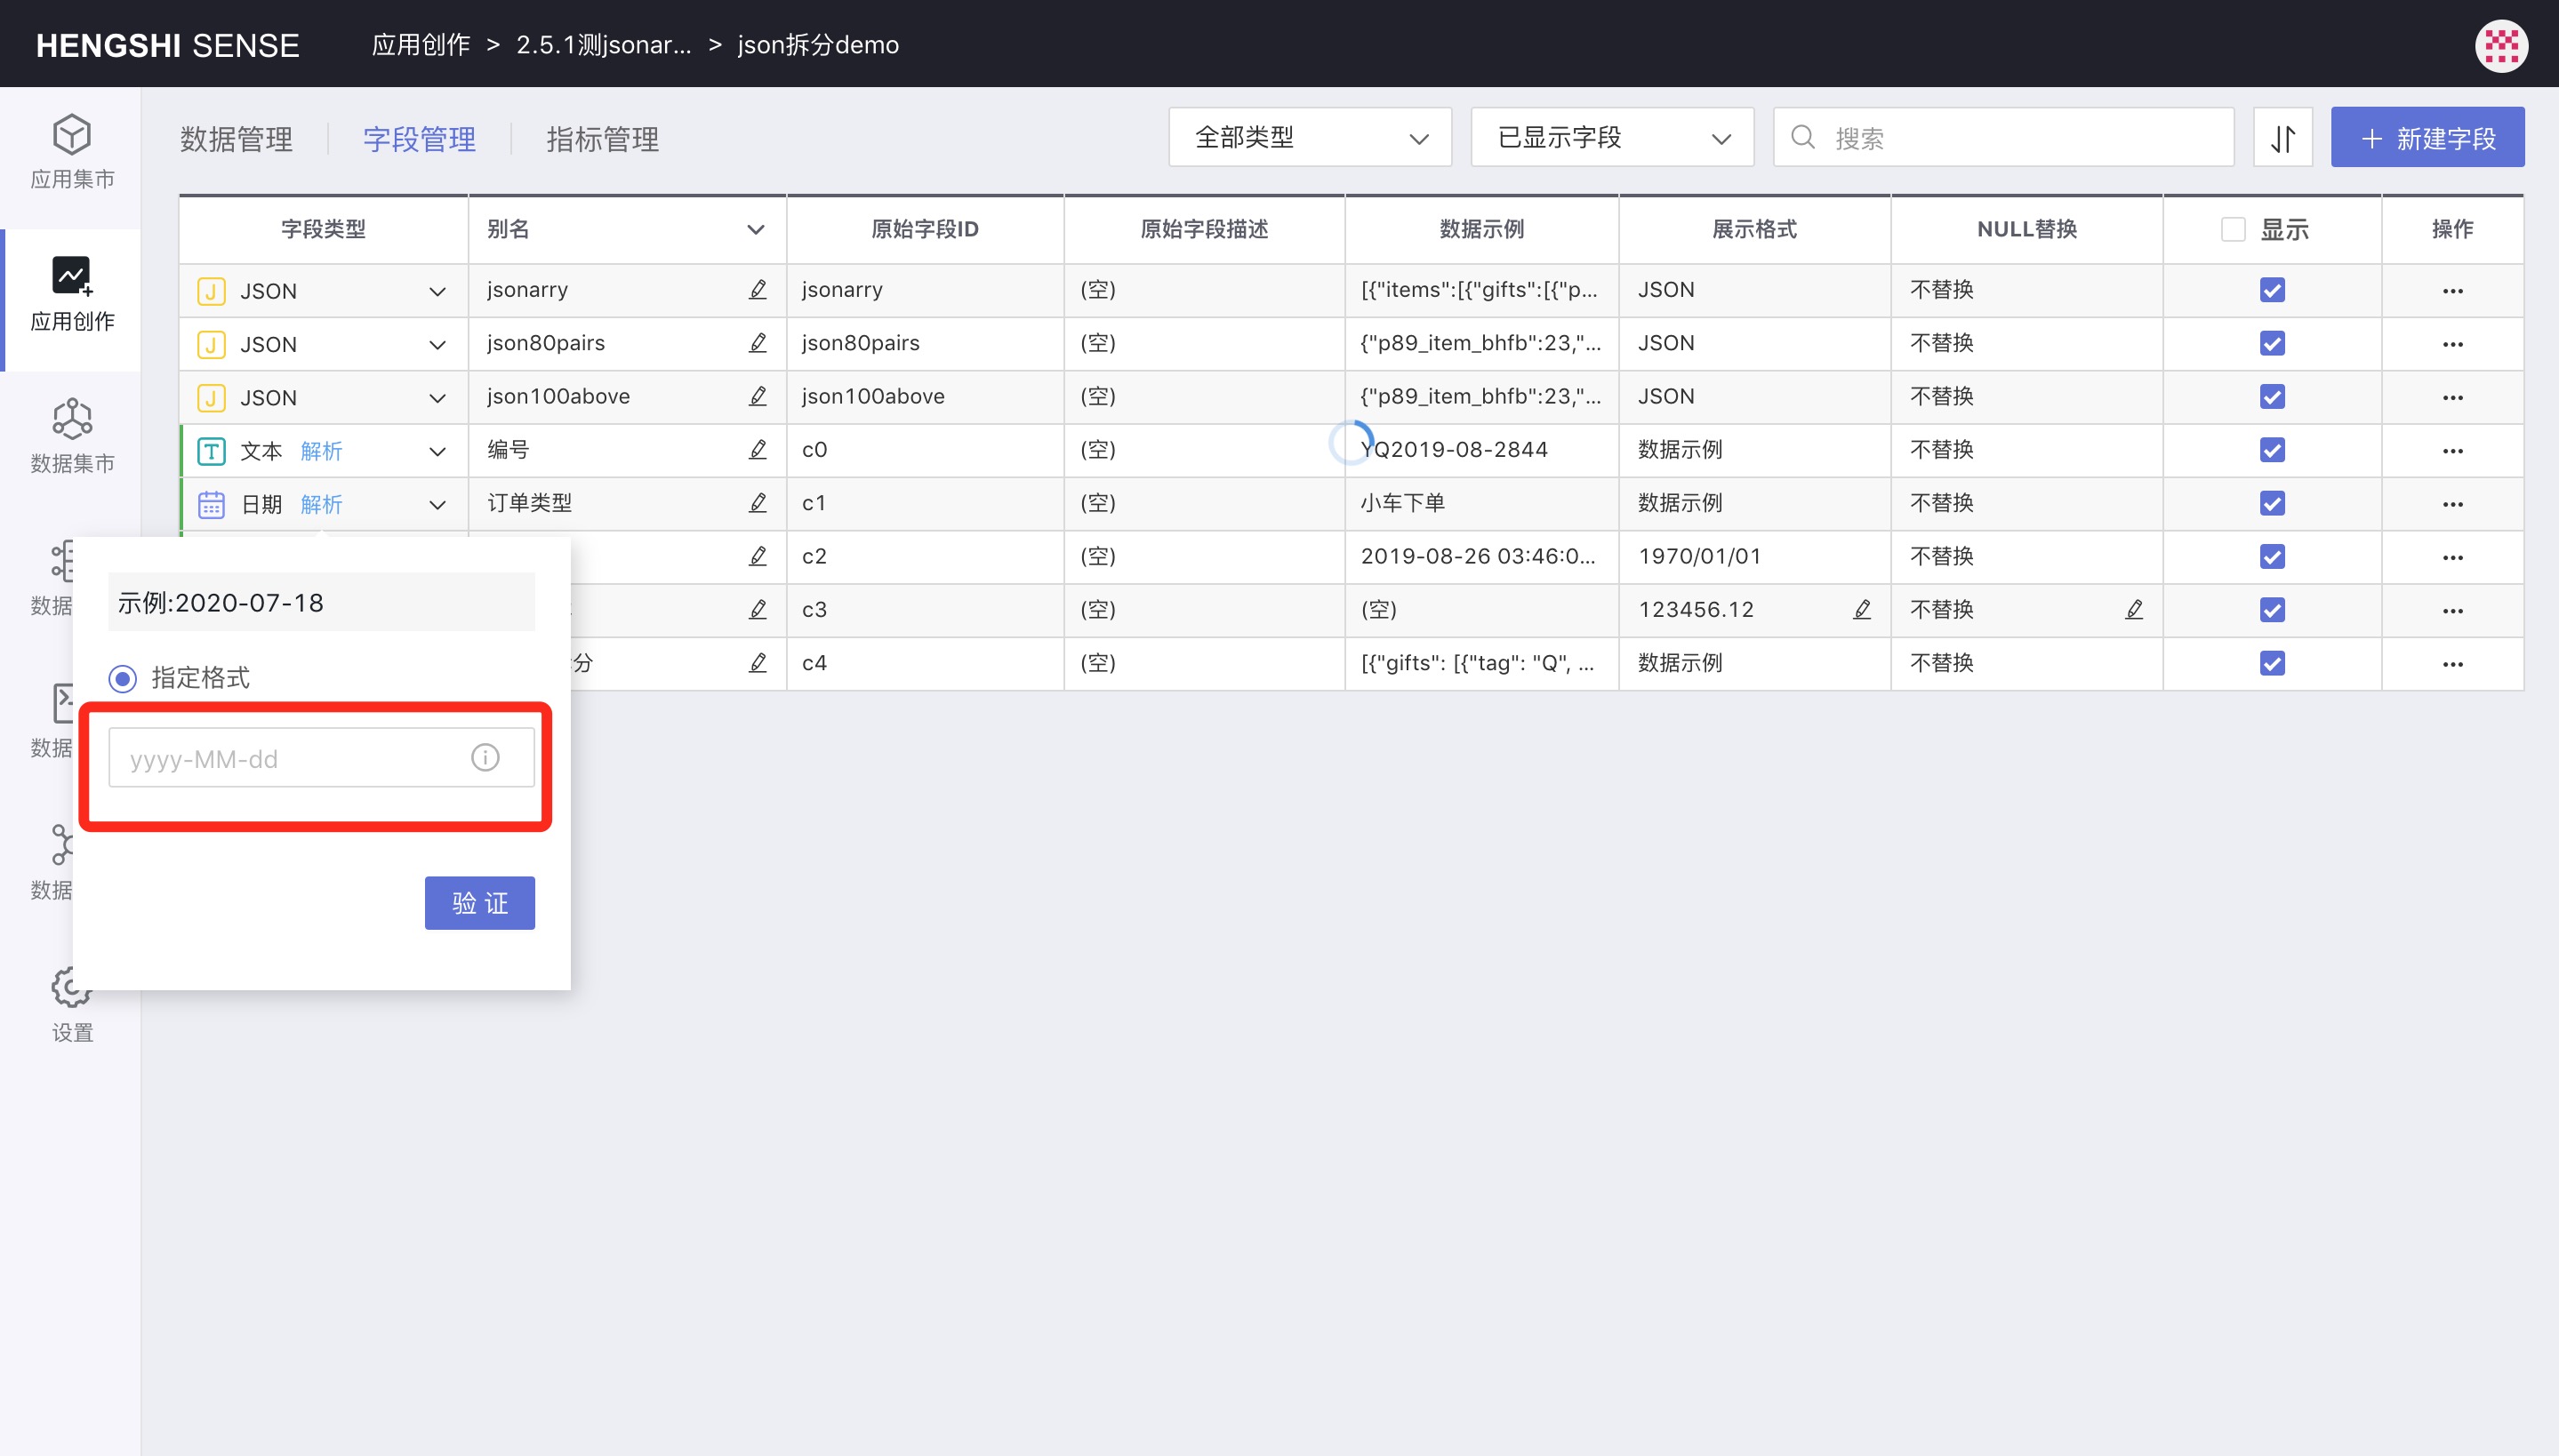
Date Parsing
For fields not automatically recognized as date types by the system, you can manually change the field from text to date type. Then manually specify the format.
Please refer to the documentation Date Time Parsing Format for a complete description of the format strings.