Hengshi Documentation
Table of Contents generated with DocToc
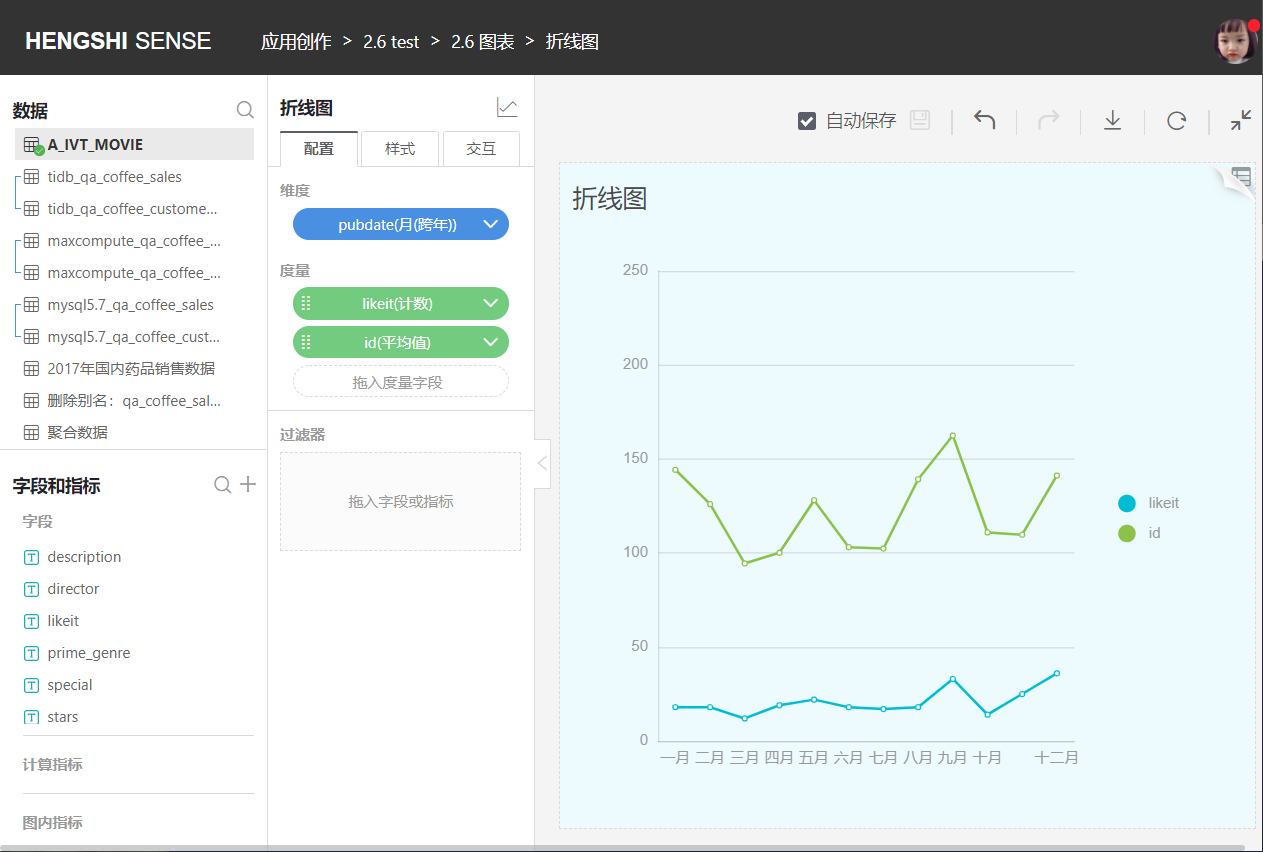
Line Chart
Line charts typically display the changing trend of one or more metrics based on the time dimension, and can be used in conjunction with bar charts.
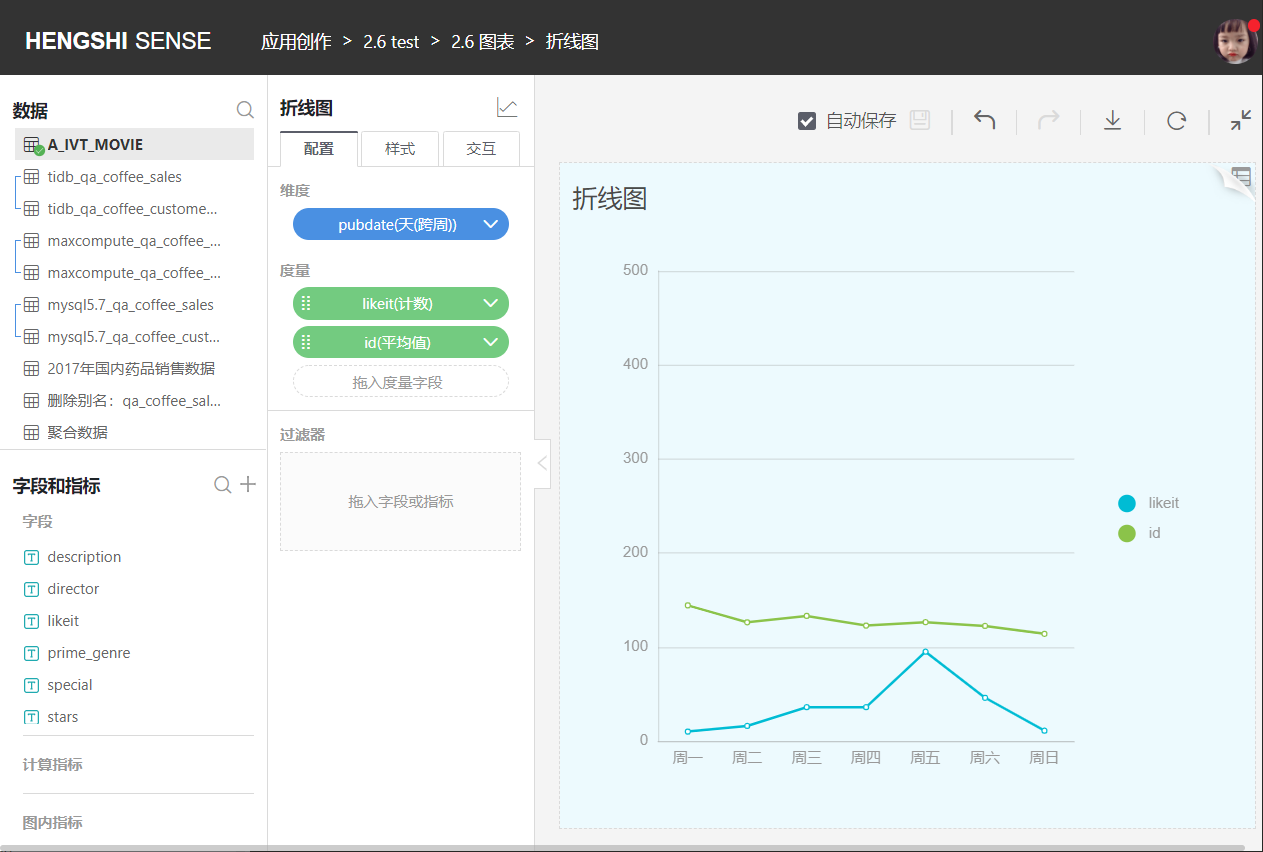
- Adjust the granularity of time dimension: year, month, day, etc.
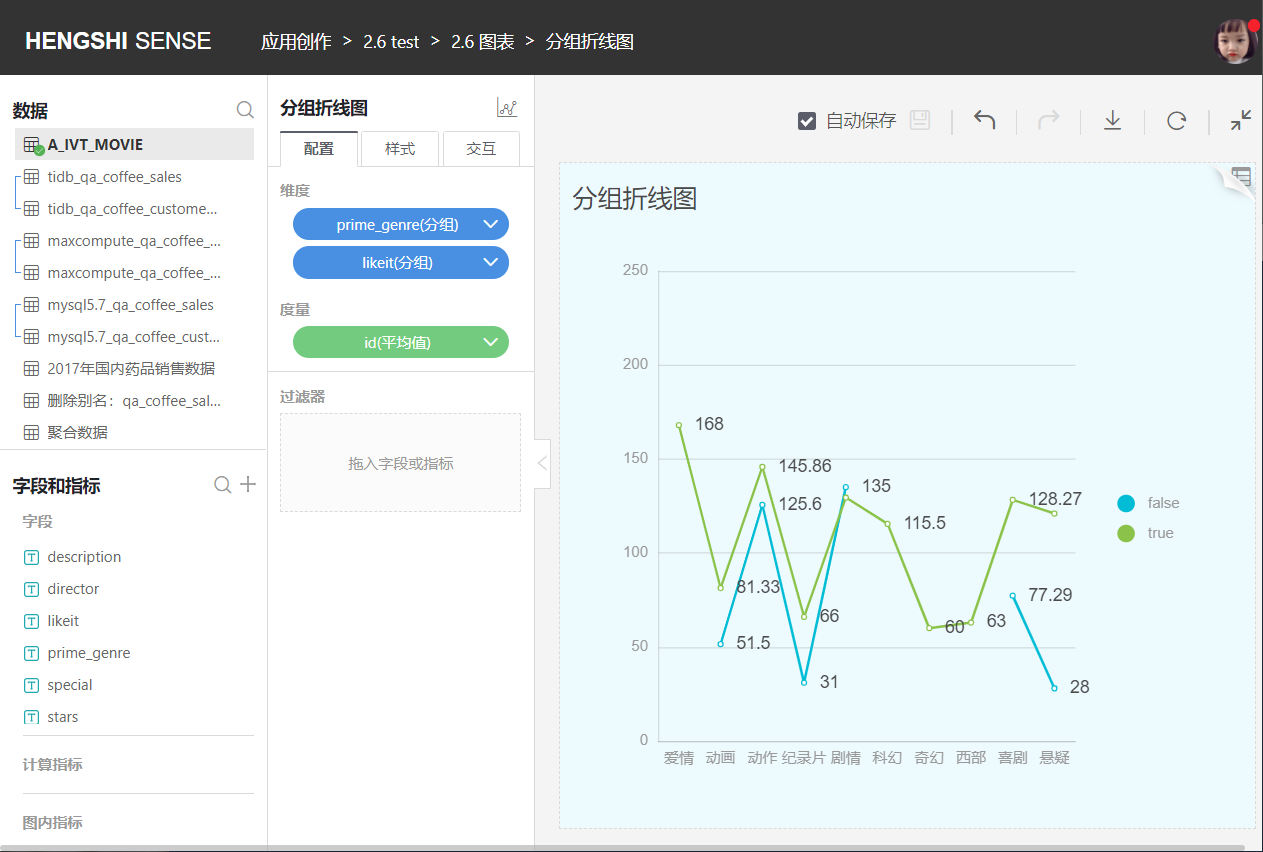
Grouped Line Chart
Grouped line charts are essentially decomposing a multiple data series line chart into multiple single data series line charts. Advantages: more intuitive and clear.
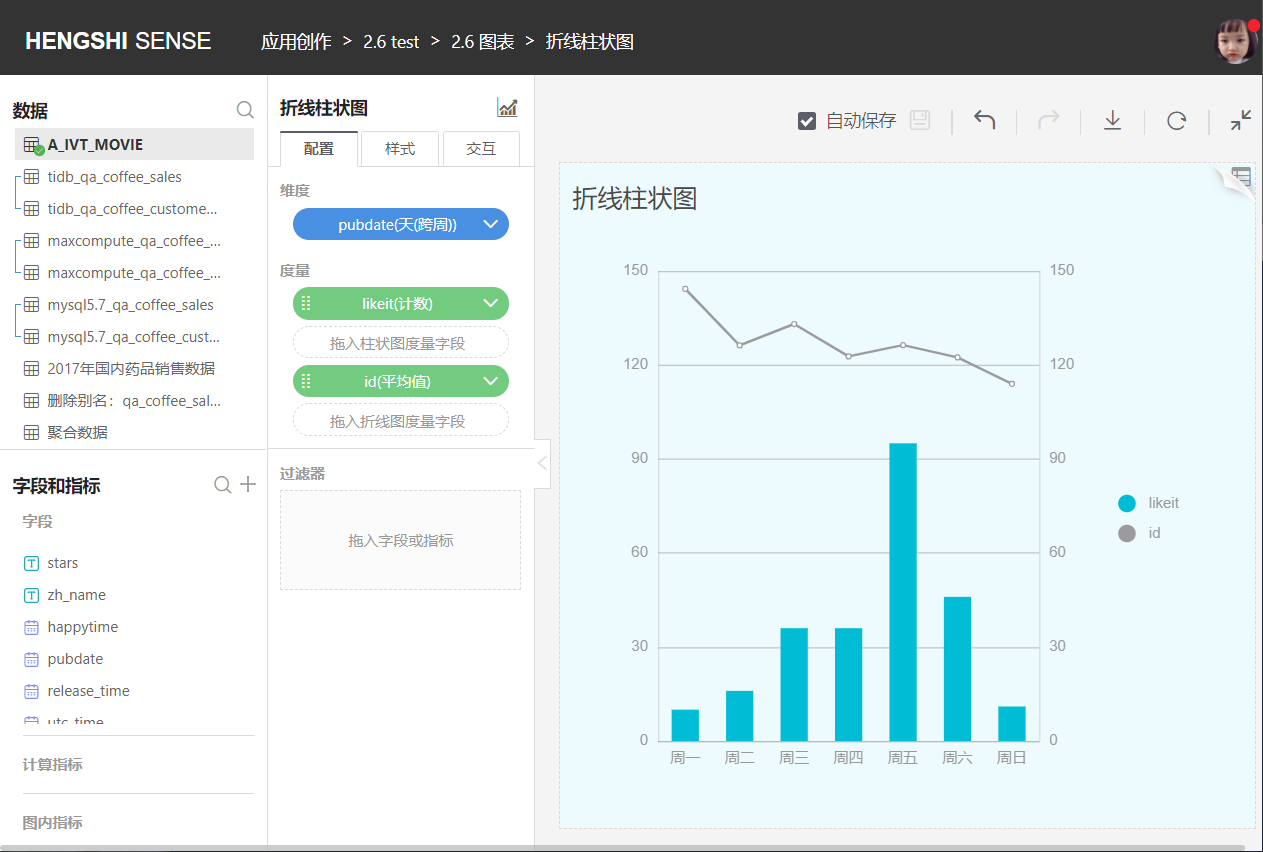
Combined Line and Bar Chart
You can choose to combine line and bar charts based on the time dimension.