<!-- START doctoc generated TOC please keep comment here to allow auto update -->
<!-- DON'T EDIT THIS SECTION, INSTEAD RE-RUN doctoc TO UPDATE -->
**Table of Contents** *generated with [DocToc](https://github.com/thlorenz/doctoc)*
- [Layered Maps](#layered-maps)
- [Regional Maps](#regional-maps)
- [Coordinate Maps](#coordinate-maps)
- [Honeycomb Maps](#honeycomb-maps)
- [Heat Maps](#heat-maps)
- [Scatter Plots](#scatter-plots)
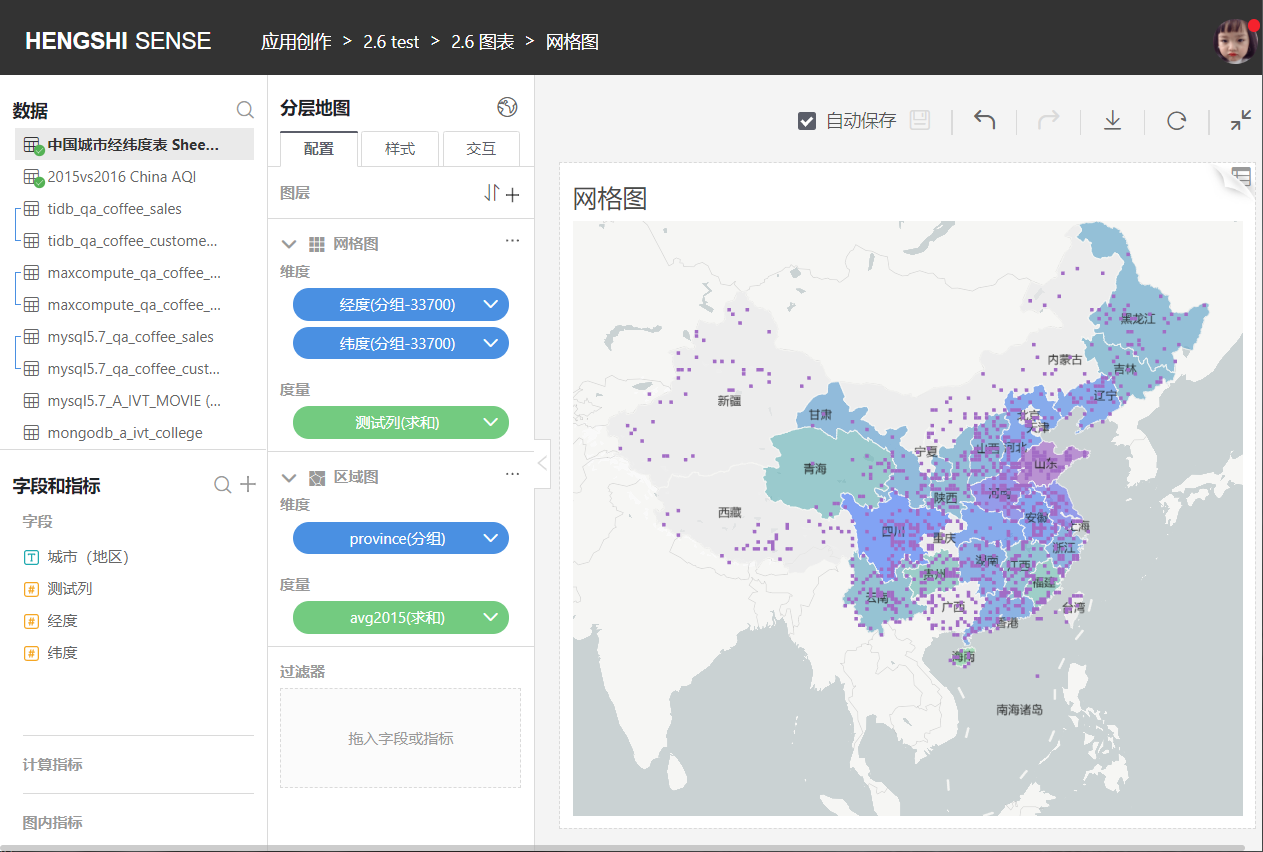
- [Grid Maps](#grid-maps)
- [Limitations of Maps](#limitations-of-maps)
<!-- END doctoc generated TOC please keep comment here to allow auto update -->
# Layered Maps
Layered maps support multi-layer GIS maps.
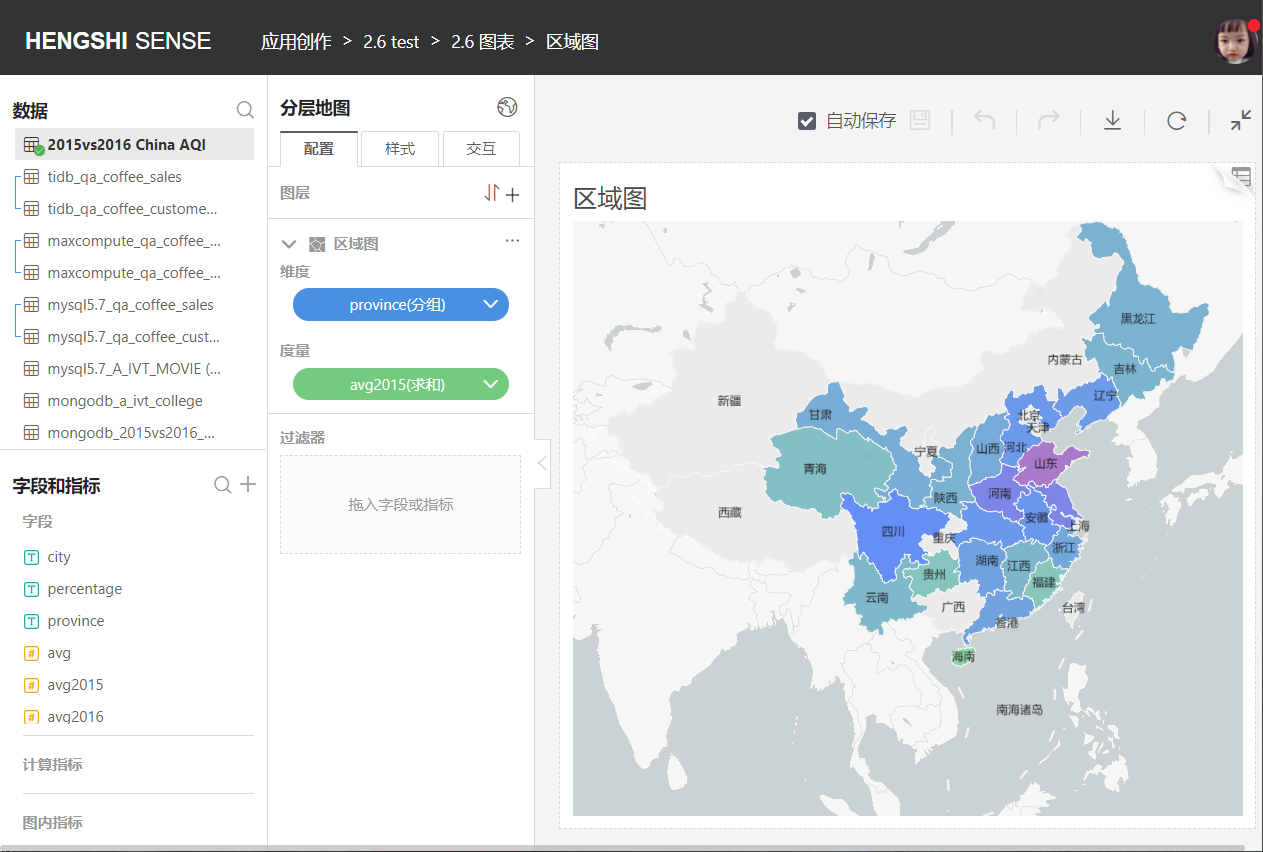
## Regional Maps
To observe the distribution of an indicator in geographical locations, like the sales volume across different regions, regional maps can be used.
Select a metric as the indicator, and determine the geographical location through province/city names or postal codes. Use the shades of the same color series to express the magnitude of the indicator.
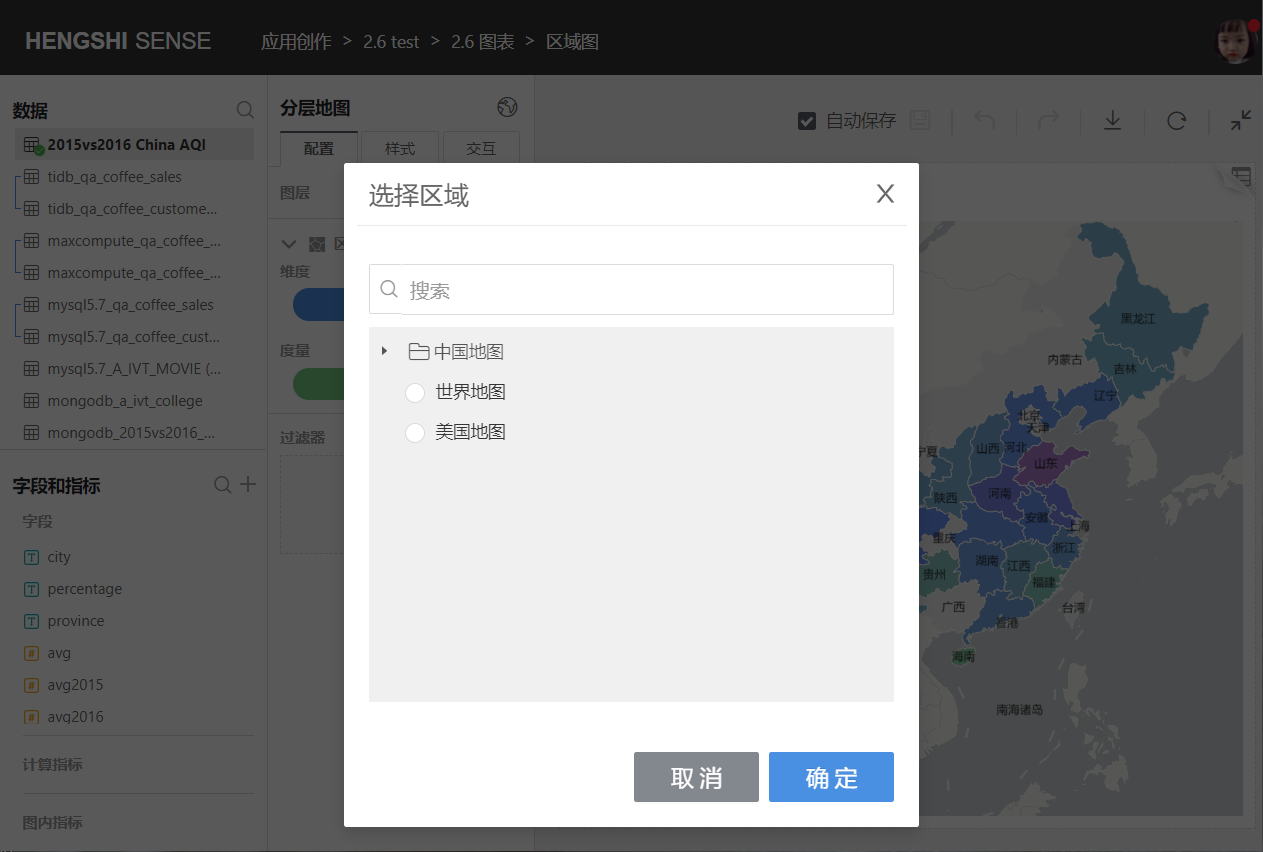
In the map settings, you can choose which region's map to display, including:
- China Map
- Names of various provinces/cities in China
- World Map
- US Map
## Coordinate Maps
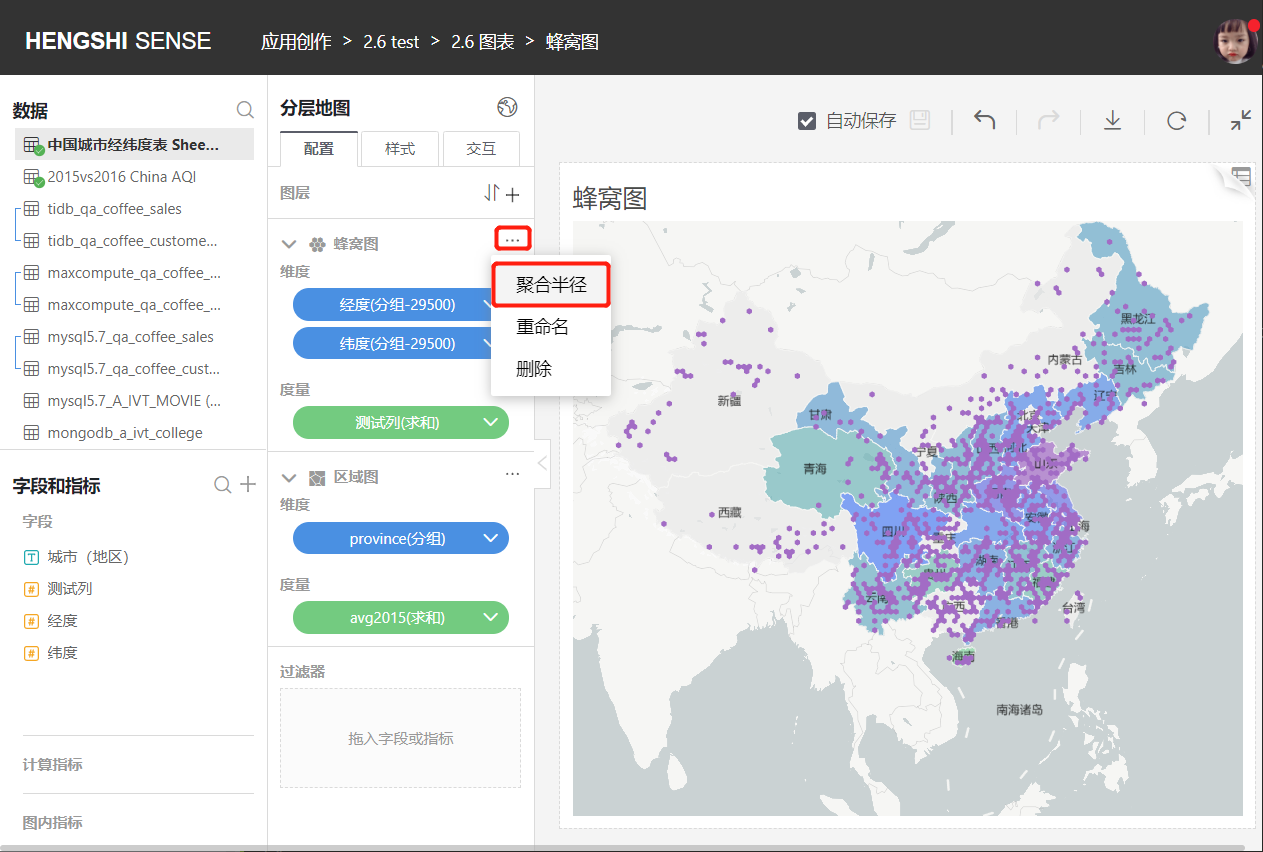
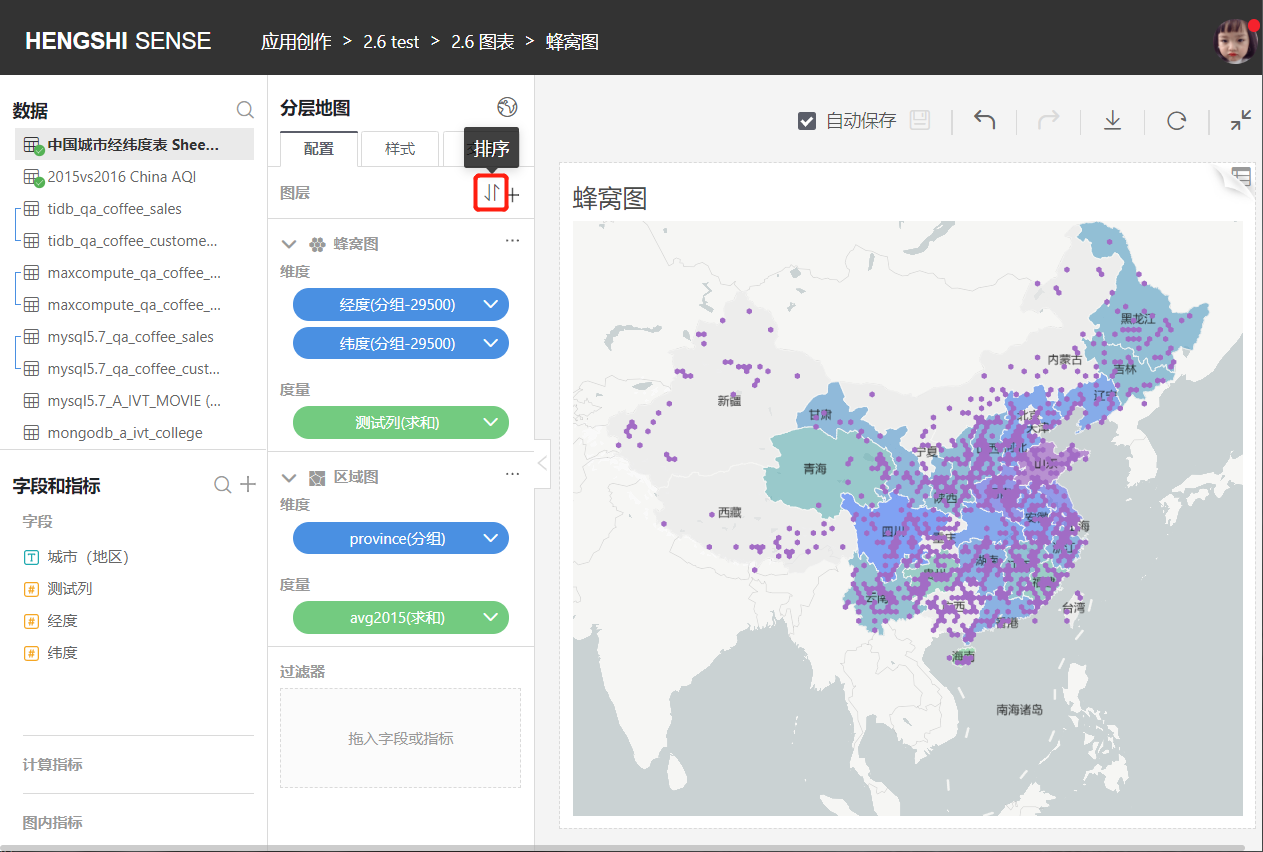
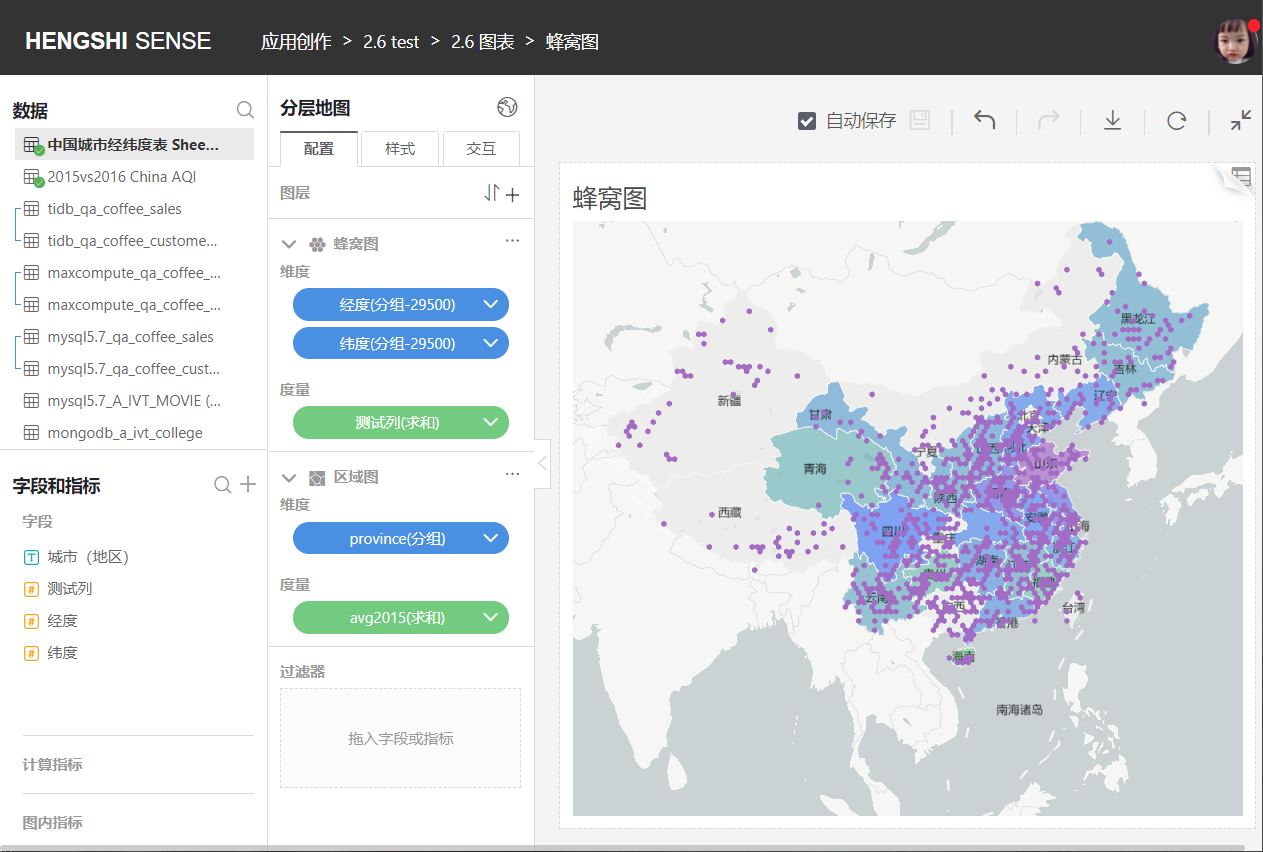
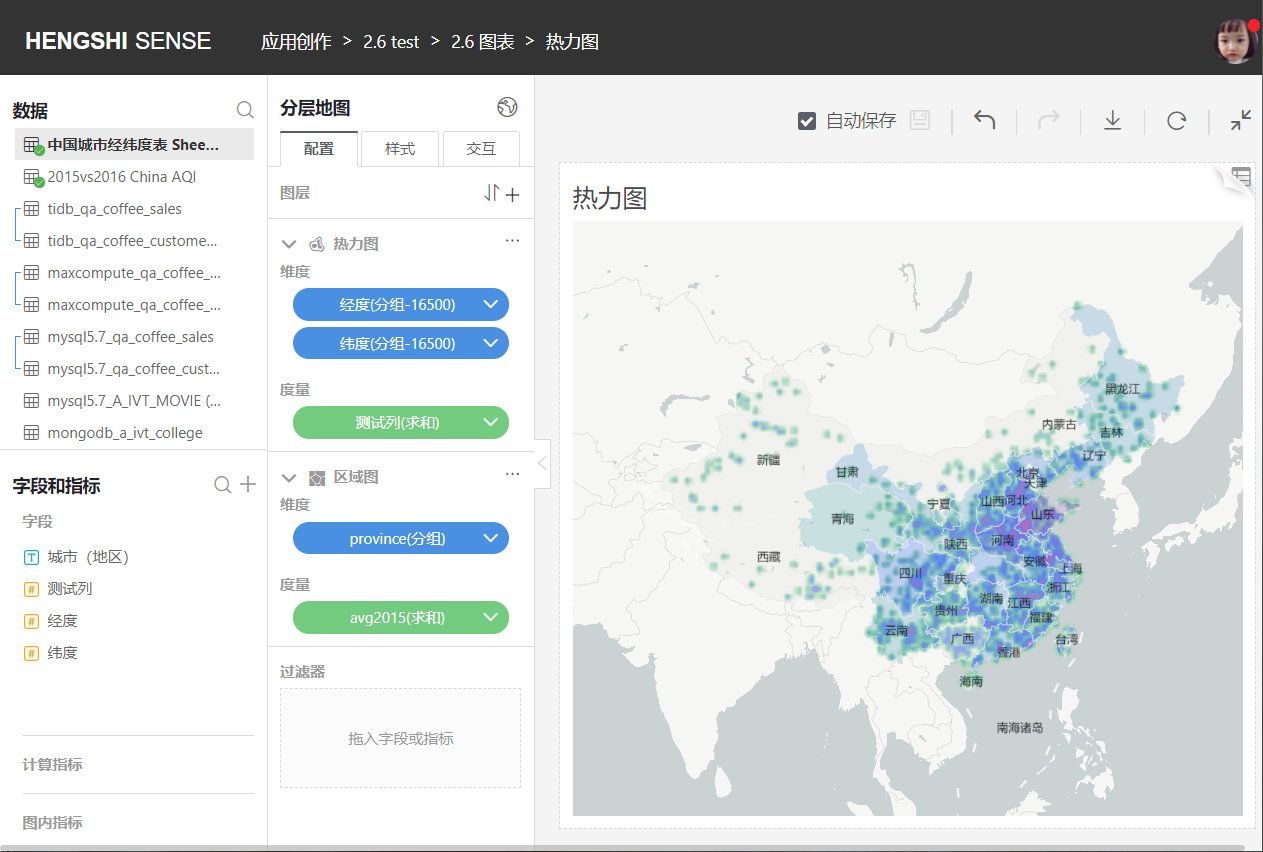
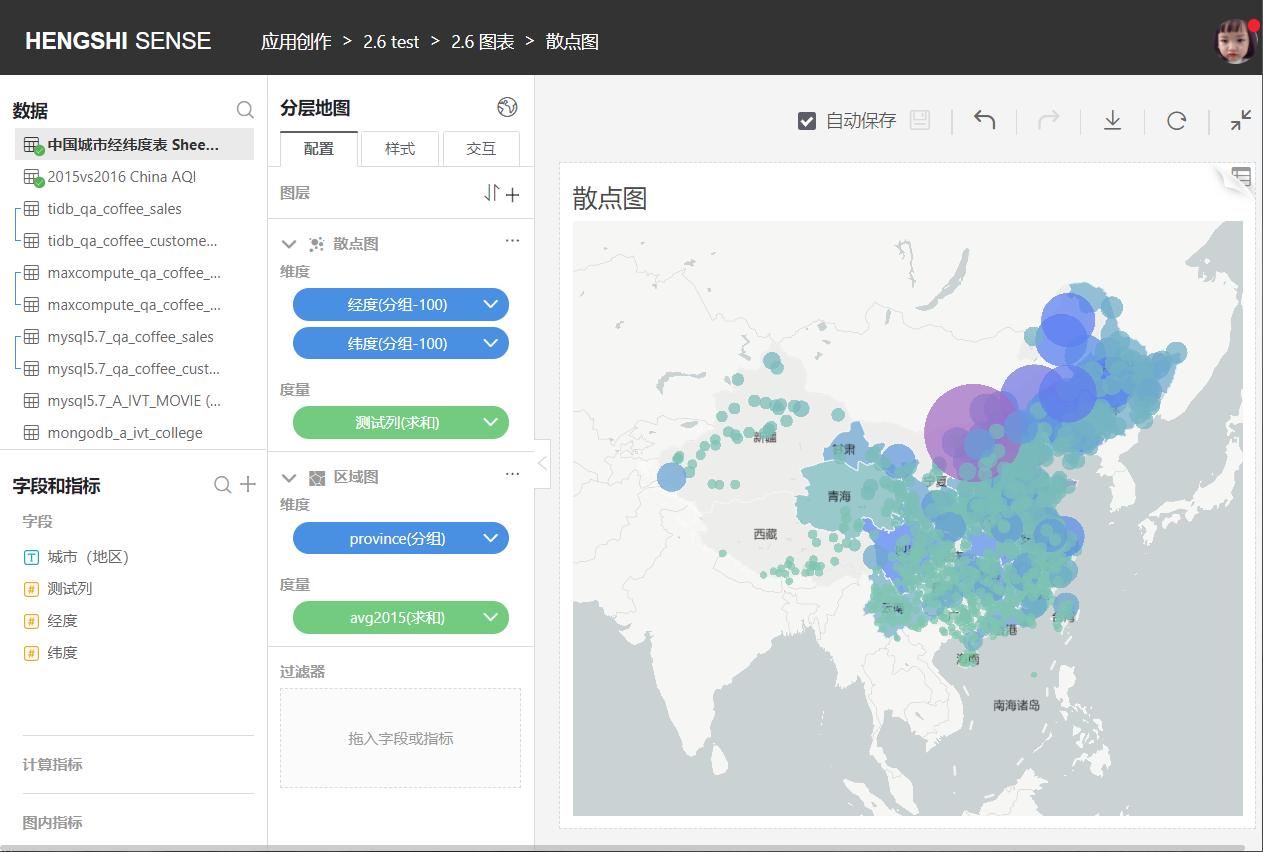
Mark the location on the map with longitude and latitude. Usually combined with regional maps, honeycomb maps, heat maps, scatter plots, grid maps these four types of maps have no functional differences other than their styles.
- Aggregation Radius:
The aggregation radius of the map can be adjusted in the map settings.
- Sorting:
You can customize and adjust the layer order.
- Opacity:
In `Styles`, you can adjust the opacity of the coordinate map for clearer visuals.
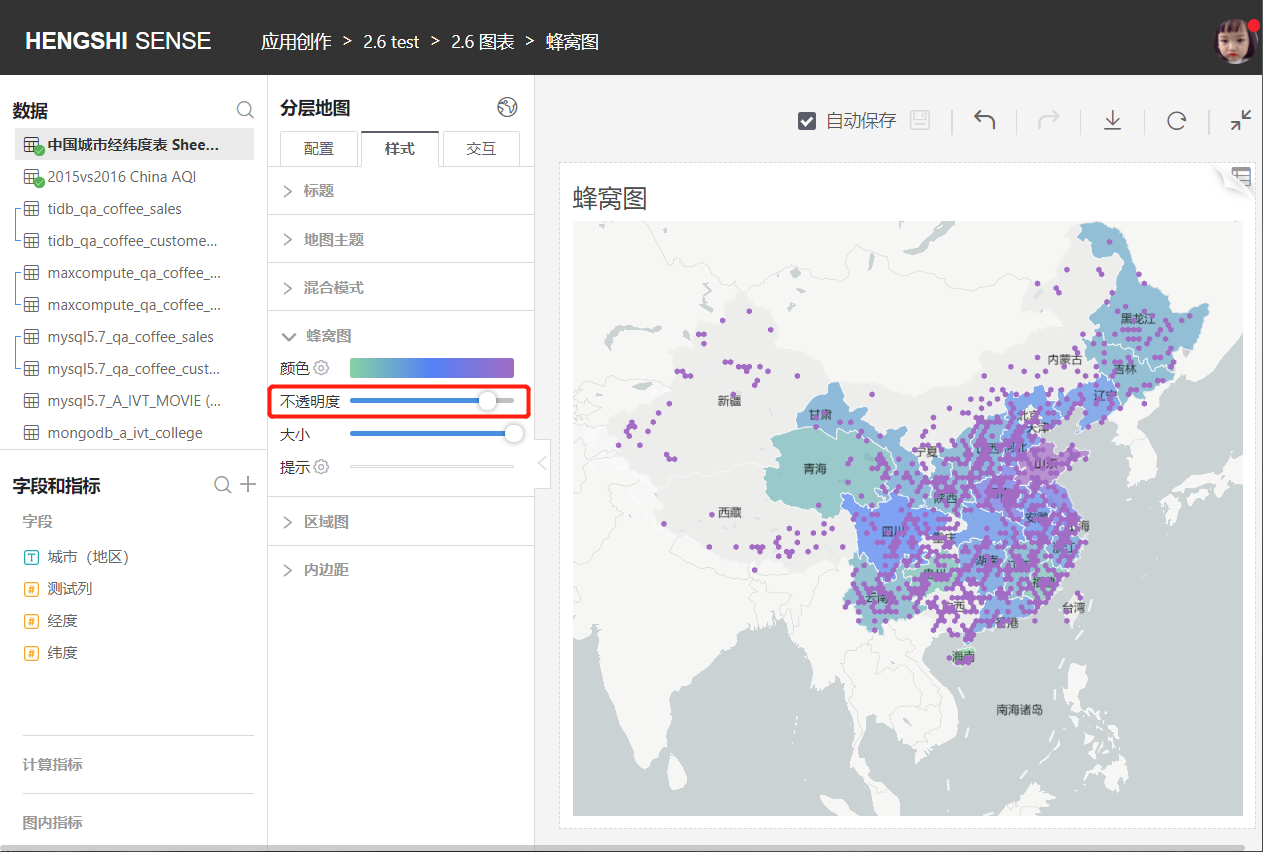
### Honeycomb Maps
### Heat Maps
### Scatter Plots
### Grid Maps
## Limitations of Maps
When the number of maps under the same dashboard exceeds five, the system will prompt that there are too many maps, as too many maps can cause the browser to load slowly or even crash.
Most modern browsers limit webgl contexts to 8, meaning a browser can only allow for 8 contexts to exist at the same time, which correspond to 8 webgl canvases. In our layered maps, each layer of the map will create a context, and resources corresponding to each context can't be shared, leading to context loss and load failure when there are more than 8 contexts in the same browser.
The Chrome team has already added an experimental flag to adjust this context limitation; for example, on a Mac system, you can start Chrome from the command line with this flag to adjust the limitation:/Applications/Google\ Chrome.app/Contents/MacOS/Google\ Chrome --max-active-webgl-contexts=32