Hengshi Documentation
Table of Contents generated with DocToc
Embedding/Sharing
Sharing
Applications that publicly use the author's data for publishing allow for the sharing of application, dashboard, and chart links, which can be accessed anonymously without login;
Applications that use restricted author data or viewer data require a link generated by the sharing of the application, dashboard, and chart, and can only be accessed by accounts with permissions after logging in.
Application/Dashboard Sharing
Step 1: Click the Share button in the upper right corner of the interface to pop up a selection menu for Sharing this Dashboard or Sharing this Application:
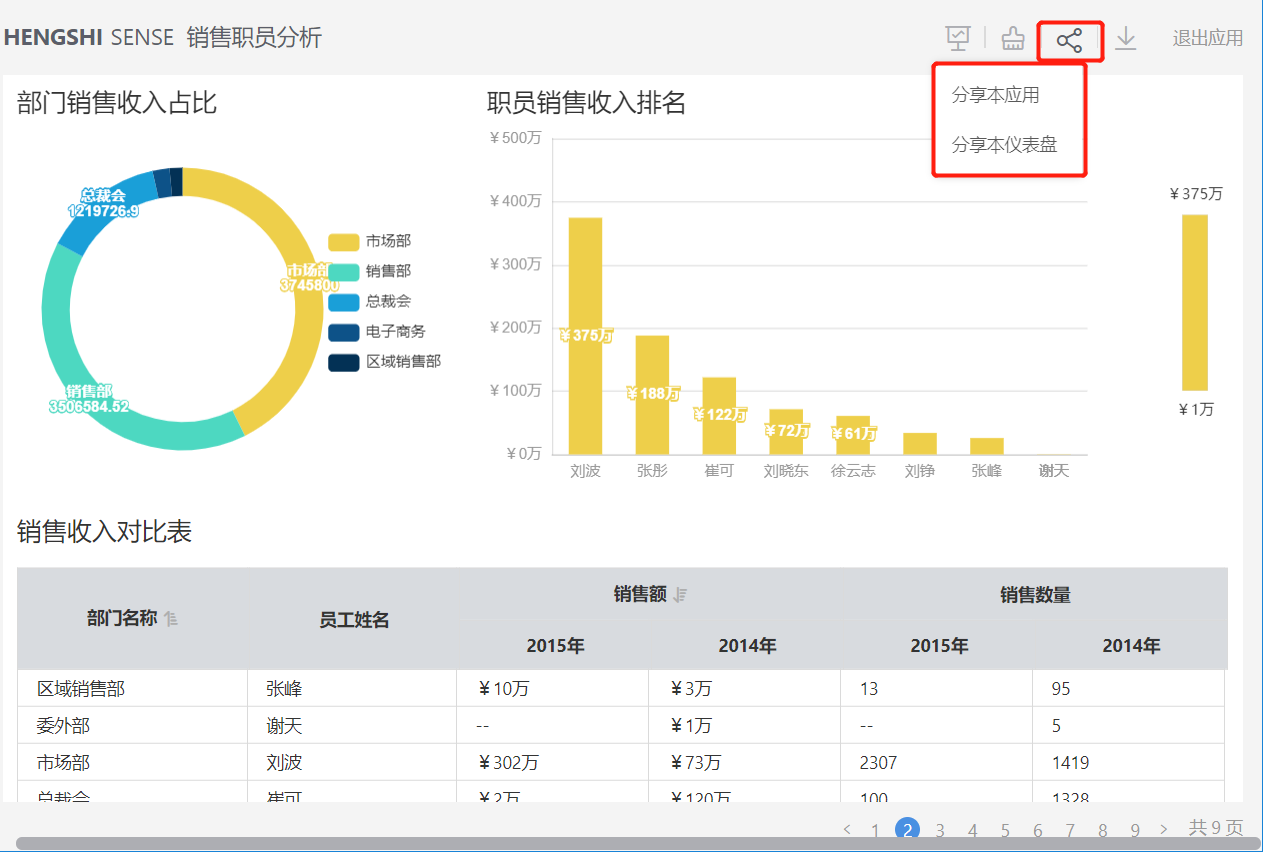
Step 2: Click and select either Sharing this Dashboard or Sharing this Application to pop up a window and generate a link:
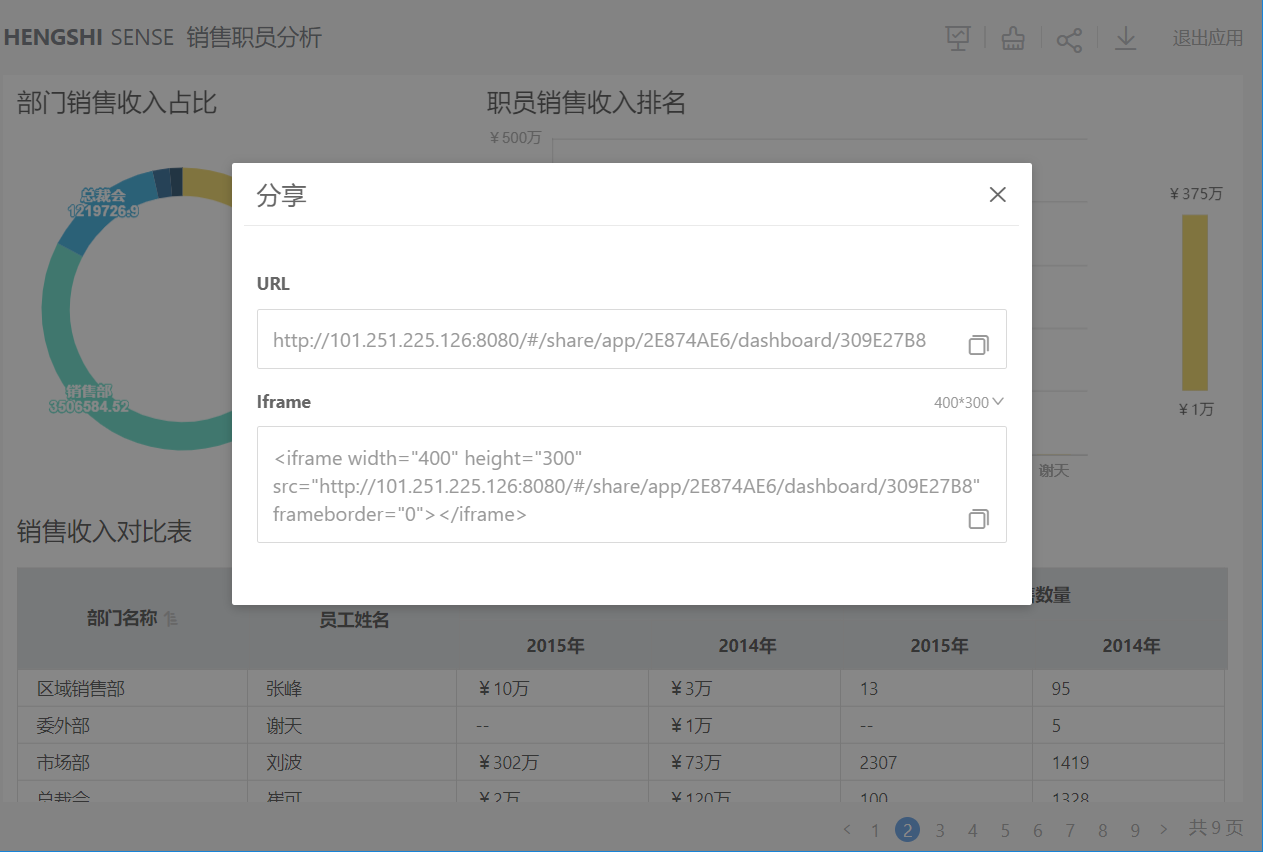
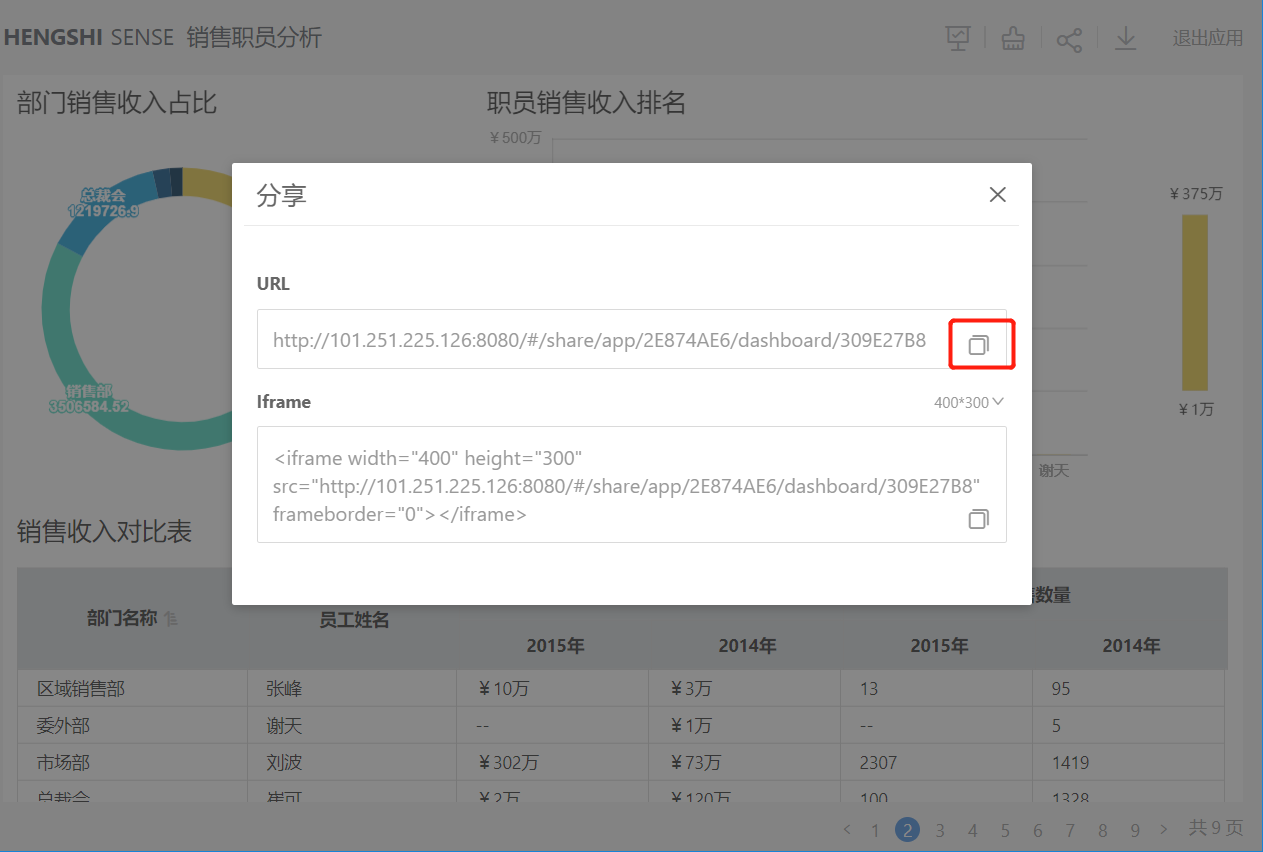
Step 3: Click the copy button behind the URL link box to copy the generated link:
Step 4: Access the copied link in the browser's incognito mode:
Applications that publicly use the author's data will go directly into the link;
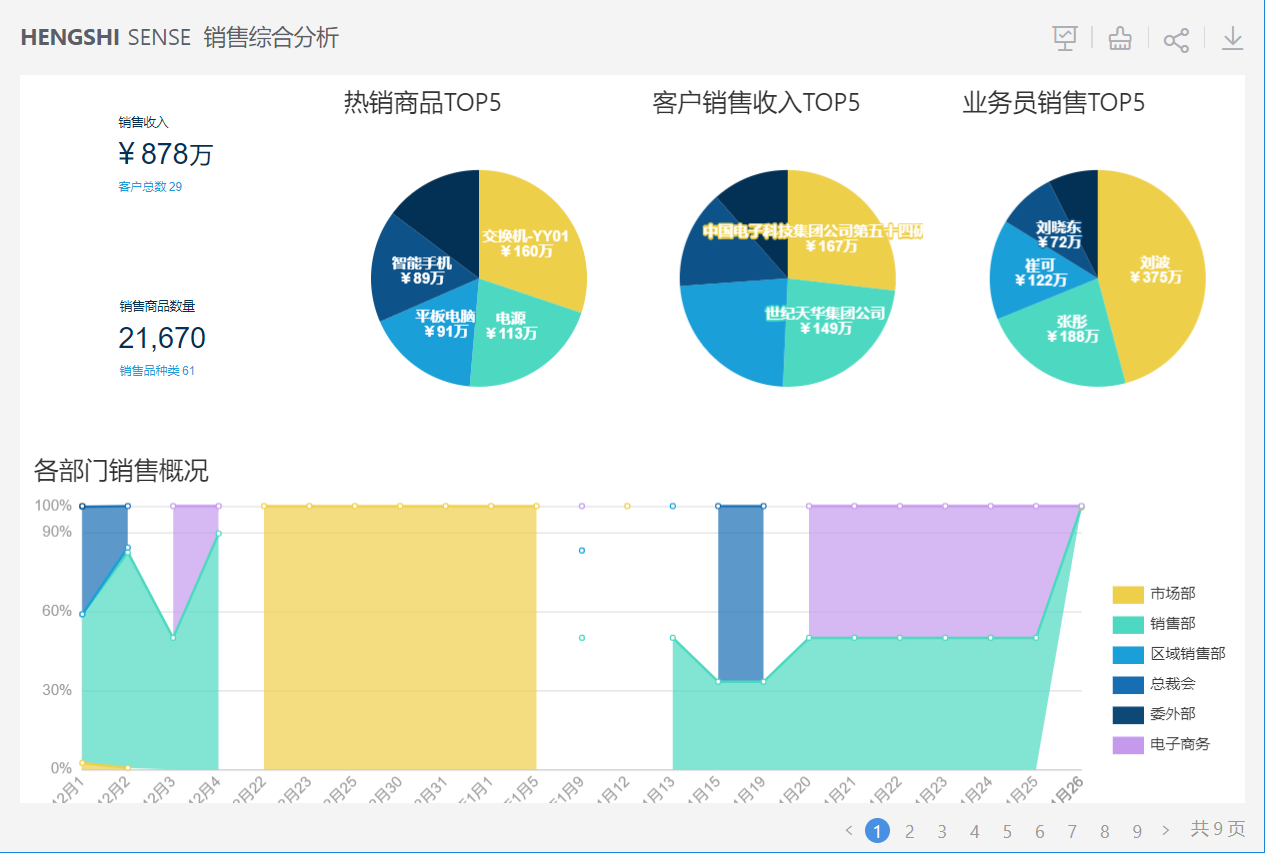
Applications that use restricted author data or viewer data will redirect to the login window, where authenticated users with permissions will be redirected inside the link and will only see the data range set within the permission control.
Please note:
Accessing the shared link:
Application sharing: Open the browser to access the copied link; when clicking the Share button again, you can choose to Share this Application or Share this Dashboard.
Dashboard sharing: When accessing the copied link via a browser, clicking the Share button again will directly pop up the generated dashboard sharing link.
Chart Sharing
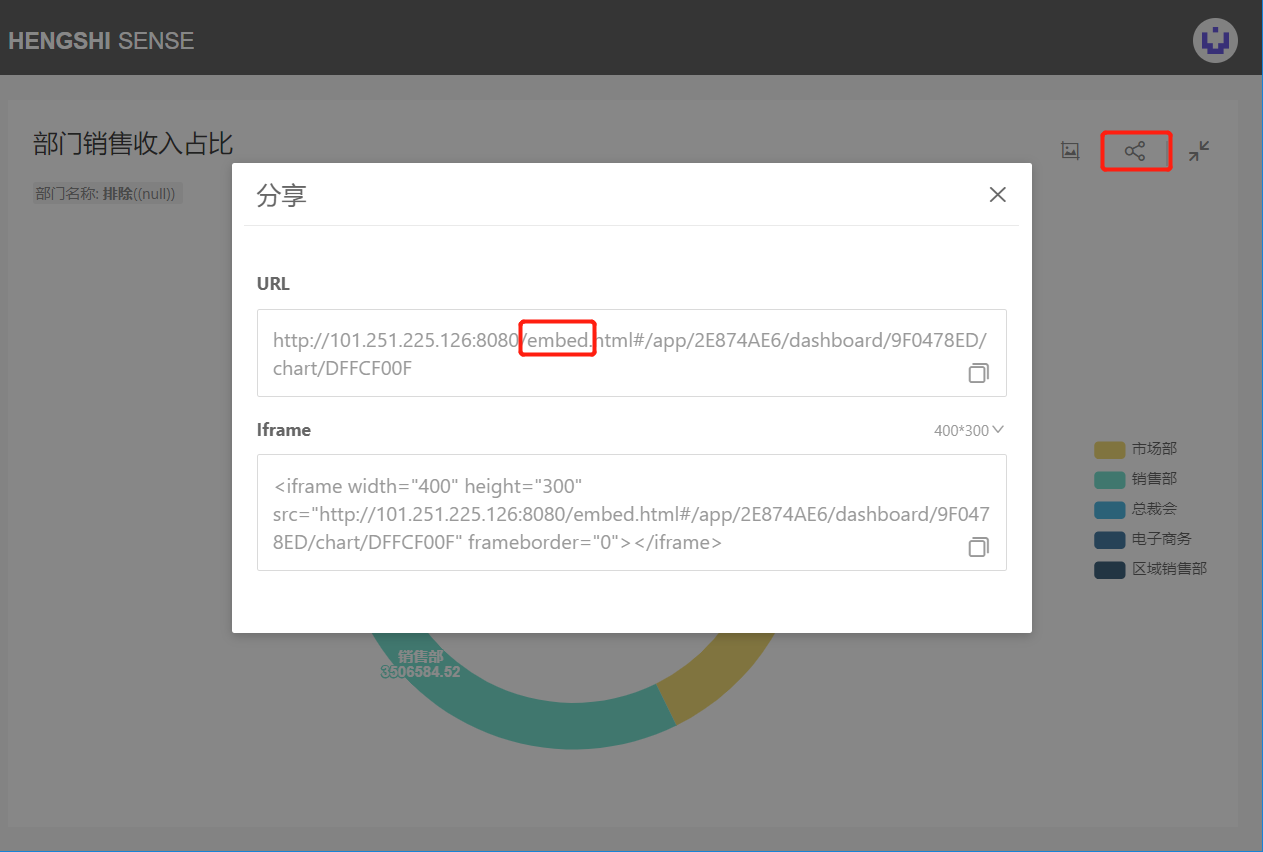
Applications that publicly use the author's data for publishing provide an embed link when sharing a chart:
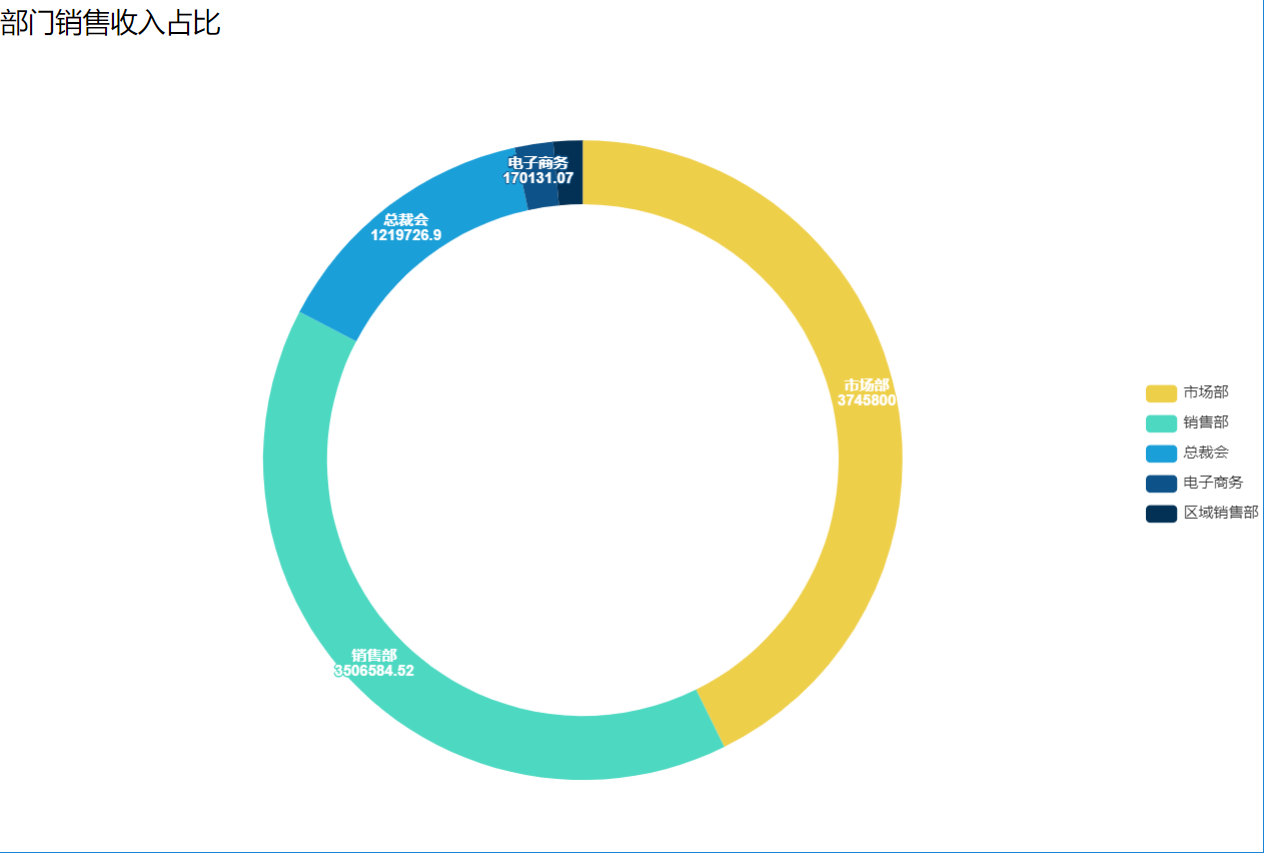
The link can be accessed anonymously when opened, and the embed page simplifies many logics for performance optimization, so sharing, screenshot taking, and filter conditions are not displayed:
Applications that use restricted author data or viewer data for publishing provide a share link when sharing a chart, which is consistent with what is seen in the application marketplace, including display of sharing, screenshot taking, and filter conditions.
Post-Sharing Actions
Opening on the Web
The operation of the shared link on the web is consistent with the one inside the application marketplace.
Opening on Mobile
Opening the shared link on mobile will only show dashboard filters and the value domain roaming feature.
Embedding
Application/Dashboard Embedding
Applications that publicly use the author's data can embed applications, dashboards, or charts with an iframe link without the need for authentication;
Applications that use restricted author data or viewer data require authentication when embedding applications, dashboards, or charts with an iframe link;
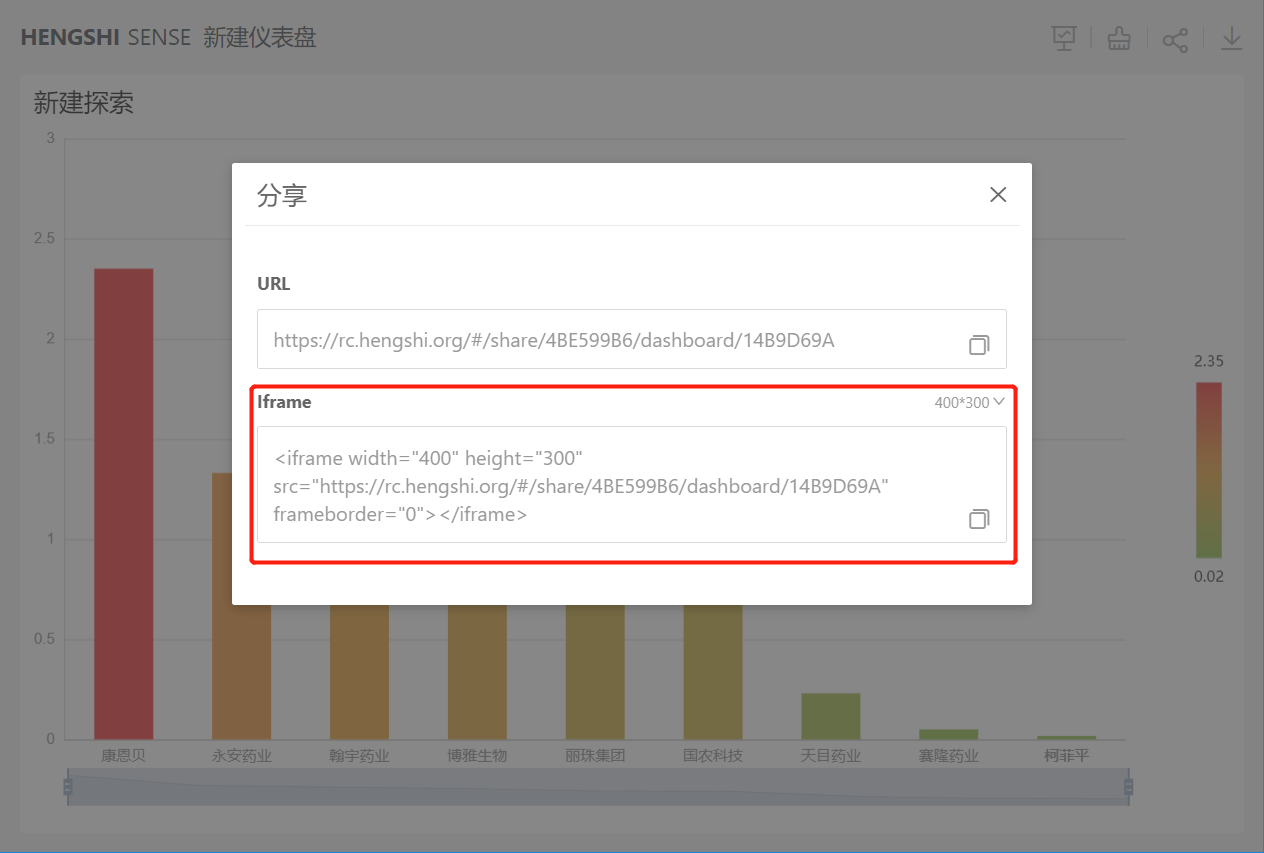
Step 1: Click the share button and choose to share the dashboard or application:
Step 2: Click the button after the iframe link box:
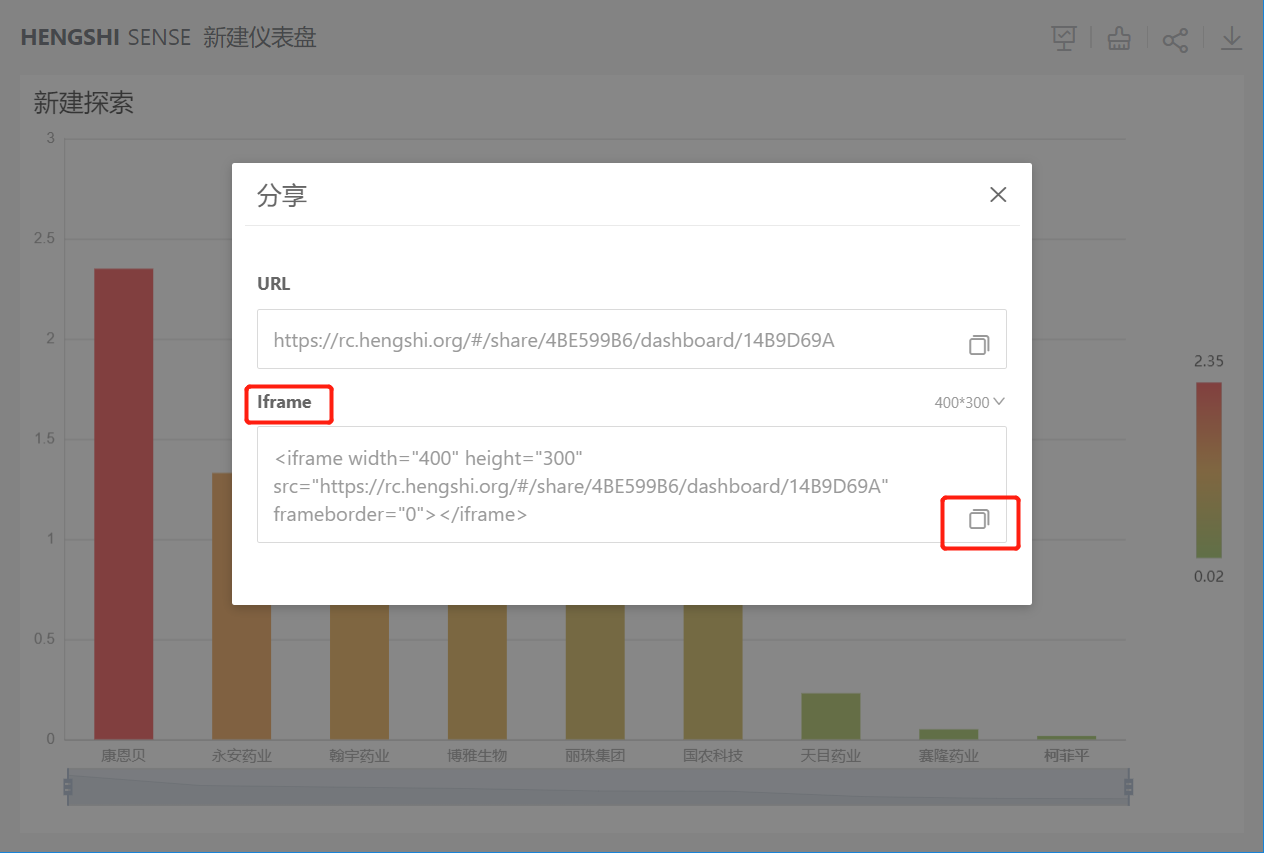
You can embed the dashboard/application into another system by this method.
Chart Embedding
Embedding a chart is consistent with embedding an application/dashboard.
Custom Parameters in Embedding Scenarios
Embedding Charts
| Parameter Name | Example Usage | Description |
|---|---|---|
| noTitle | 1. noTitle=true 2. noTitle=false 3. Default setting |
Sets whether to show the title: true - does not show the title false - shows the title Default setting - shows the title |
| titleColor | 1.titleColor=rgb(0, 0, 0) 2.titleColor=rgba(0, 0, 0, 1) 3.titleColor=red 4.titleColor=hsl(0,0,0) |
Sets the color of the chart title, hexadecimal RGB colors are not supported |
| chartBackground | 1.chartBackground=rgb(0, 0, 0) 2.chartBackground=rgba(0, 0, 0, 1) 3.chartBackground=red 4.chartBackground=hsl(0,0,0) 5.chartBackground=transparent |
Sets the chart background color, hexadecimal RGB colors are not supported When the parameter is "transparent", the chart displays a transparent background color |
Embedding Dashboards
| Parameter Name | Example Usage | Description |
|---|---|---|
| copyright | 1. copyright=true 2. copyright=false 3. copyright=otherwise |
Whether to show the header and footer: true - shows false - does not show Default setting shows |
| background | 1.background=rgb(0, 0, 0) 2.background=rgba(0, 0, 0, 1) 3.background=red 4.background=hsl(0,0,0) |
Dashboard background color, hexadecimal RGB colors are not supported |
| padding | padding=5 | Sets the margin in pixels px |
| scrollable | 1. scrollable=true 2. scrollable=false 3. scrollable=otherwise |
Dashboard vertical scrollbar settings: true - scrollable false - not scrollable otherwise - default setting is scrollable |
| chartBackground | 1.chartBackground=rgb(0, 0, 0) 2.chartBackground=rgba(0, 0, 0, 1) 3.chartBackground=red 4.chartBackground=hsl(0,0,0) chartBackground=transparent |
Sets the chart background color, hexadecimal RGB colors are not supported When the parameter is "transparent", the background color is transparent |
| chartGap | chartGap=5 | Sets the gap between charts in pixels px |
| chartTitleColor | 1.chartTitleColor=rgb(0, 0, 0) 2.chartTitleColor=rgba(0, 0, 0, 1) 3.chartTitleColor=red 4.chartTitleColor=hsl(0,0,0) |
Sets the color of the chart title, hexadecimal RGB colors are not supported |
| chartAccessible | 1. chartAccessible=true 2. chartAccessible=false 3. chartAccessible=otherwise |
true - can open false - cannot open otherwise - default setting is openable |