Hengshi Documentation
HENGSHI SENSE Advanced Computation Usage Instructions
In addition to common calculation methods such as Sum, Average, Max/Min, Distinct, Count, etc., HENGSHI SENSE currently provides 9 advanced calculation methods: Year-on-Year (YoY)/Sequential Growth, Retention Rate, Active Rate, Repeat Rate, Moving Calculation, Cumulative Calculation, Percentage, Percentile, Median, etc. These methods can be customized according to specific business scenario analysis dimensions.

Coffee Analysis
Firstly, we explain the data and analysis requirements for coffee analysis:
Data
Product Table
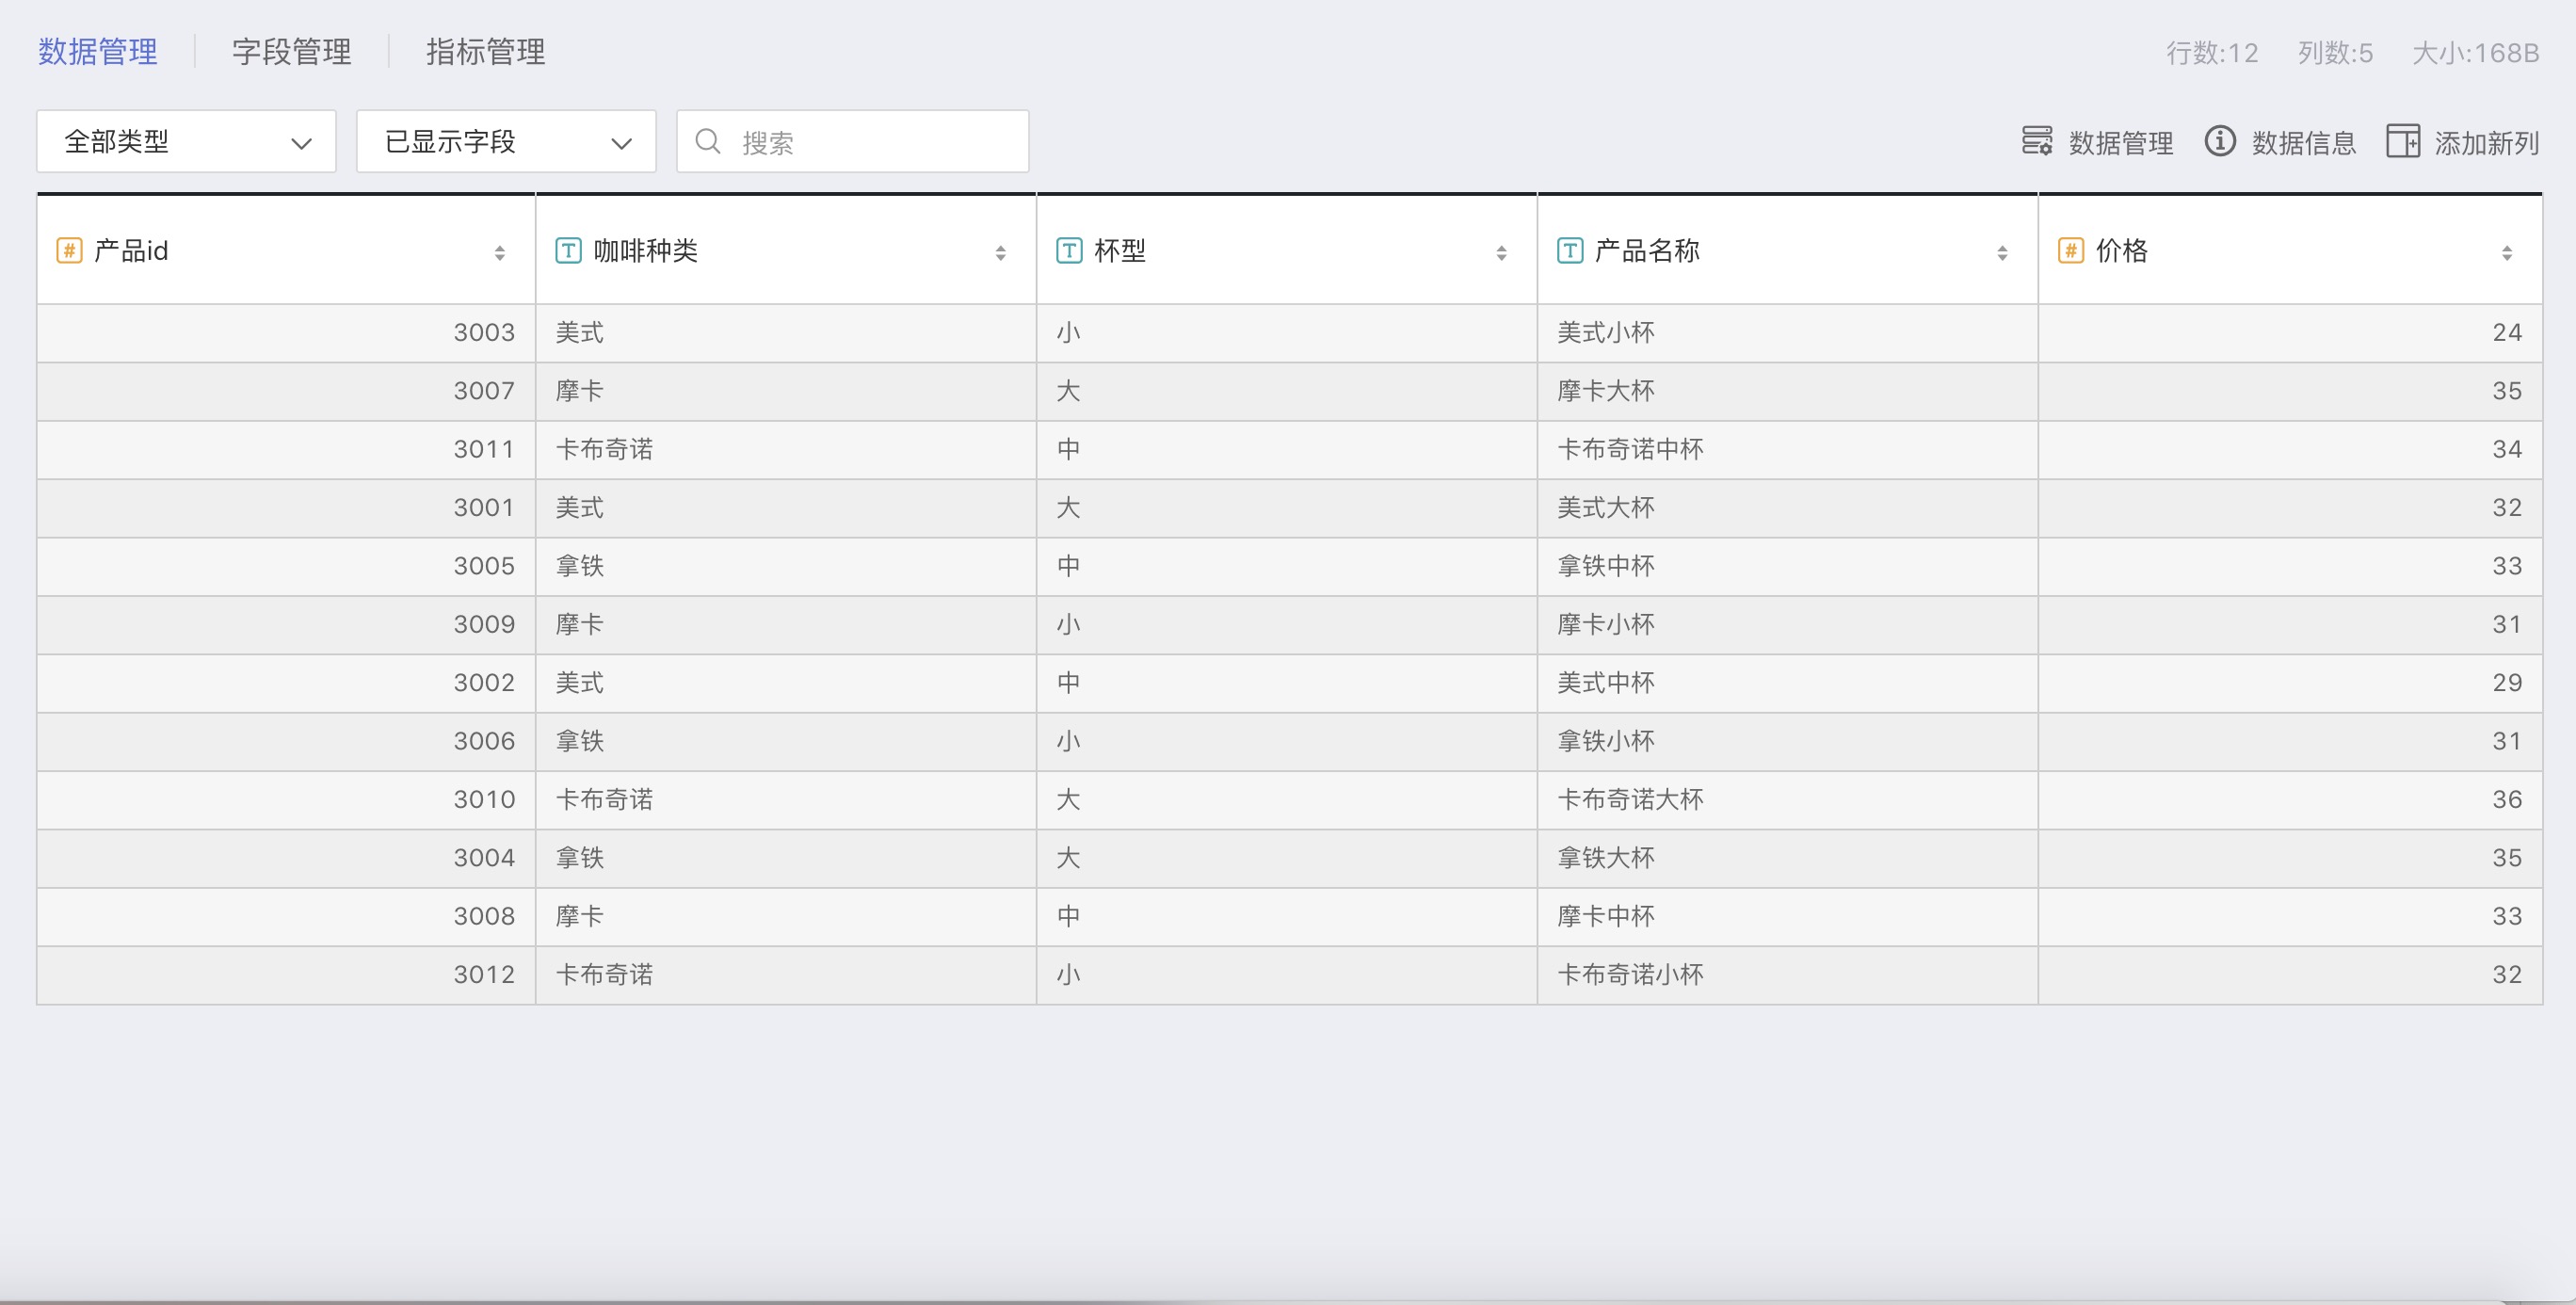
The product table contains category information for coffee, including:
| Field | Type | Description |
|---|---|---|
| Product ID | Number | Unique identifier for each type of coffee |
| Coffee Type | Text | Types of coffee, including: Americano, Latte, Mocha, Cappuccino |
| Cup Size | Text | Size of the coffee cup, including: Large, Medium, Small |
| Product Name | Text | Combination of coffee type + cup size, for example: Medium Americano |
| Price | Number | Unit price of the coffee, corresponding to each Product ID |
Cup Size Table

The cup size table contains information about each cup size and its corresponding volume.
| Field | Type | Description |
|---|---|---|
| Cup Size | Text | Size of the coffee cup, corresponding to the Cup Size in the Product Table |
| Volume | Text | Coffee volume for each cup size |
Store Information Table
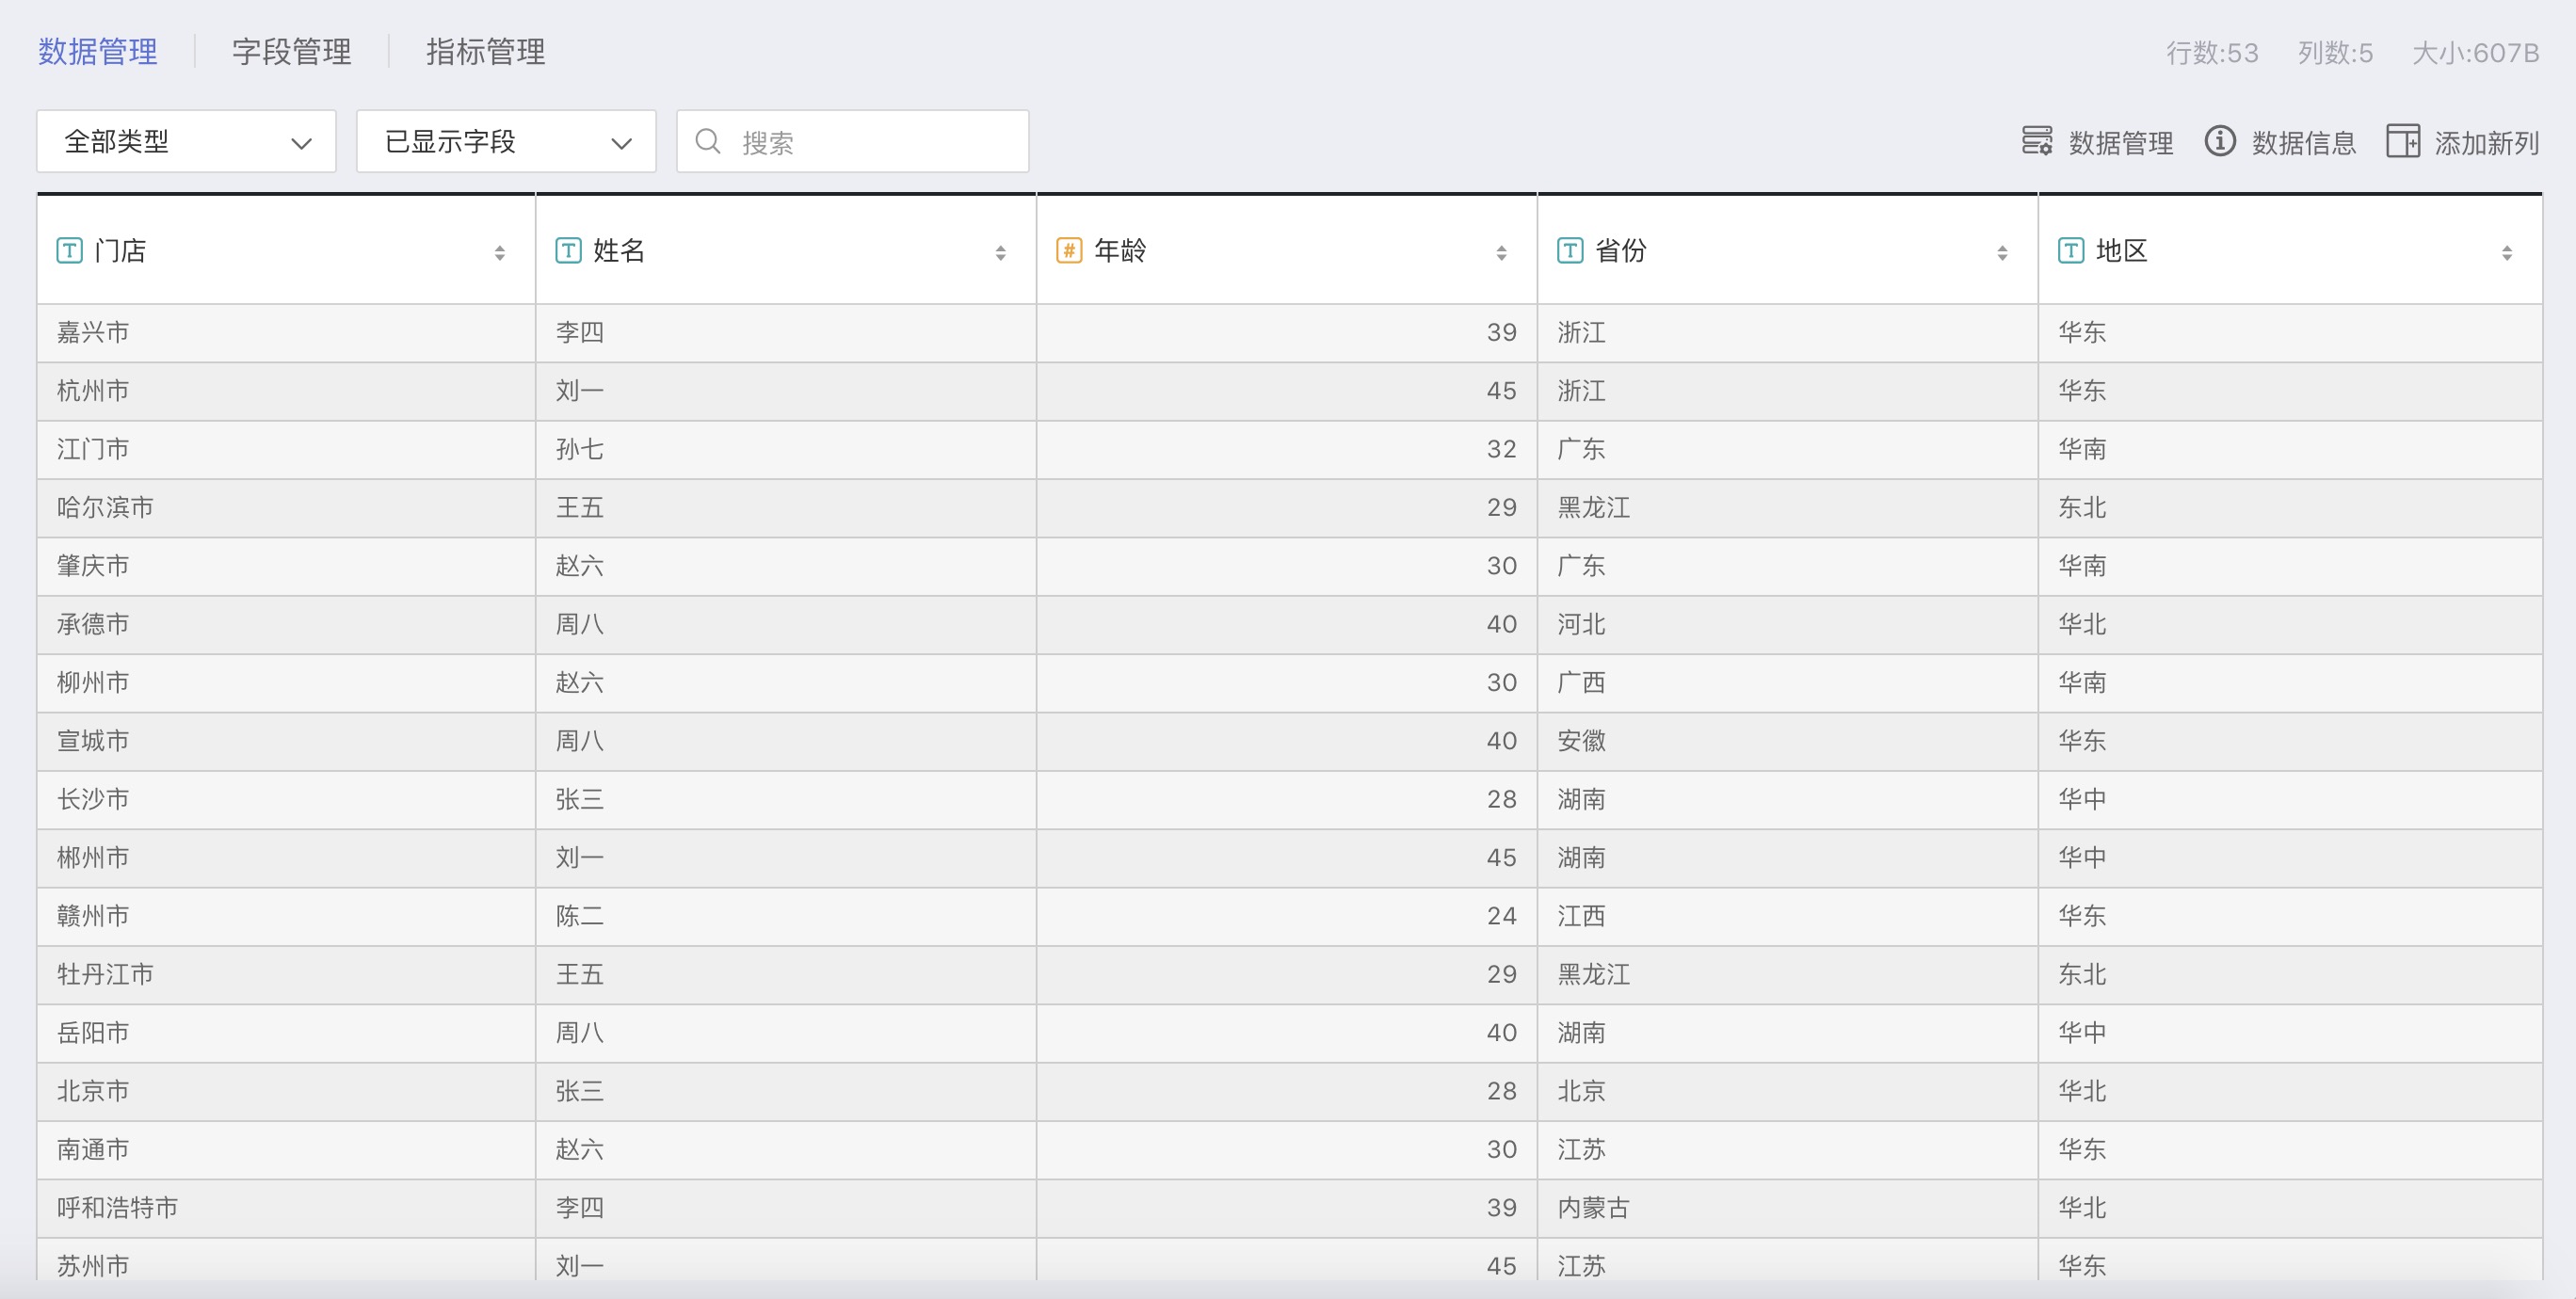
The store information table contains detailed information for each store:
| Field | Type | Description |
|---|---|---|
| Store | Text | Location of the store |
| Name | Text | Owner of each store |
| Age | Number | Age of the store owner |
| Province | Text | Province where the store is located |
| Region | Text | Area where the store is located |
Customer Information Table
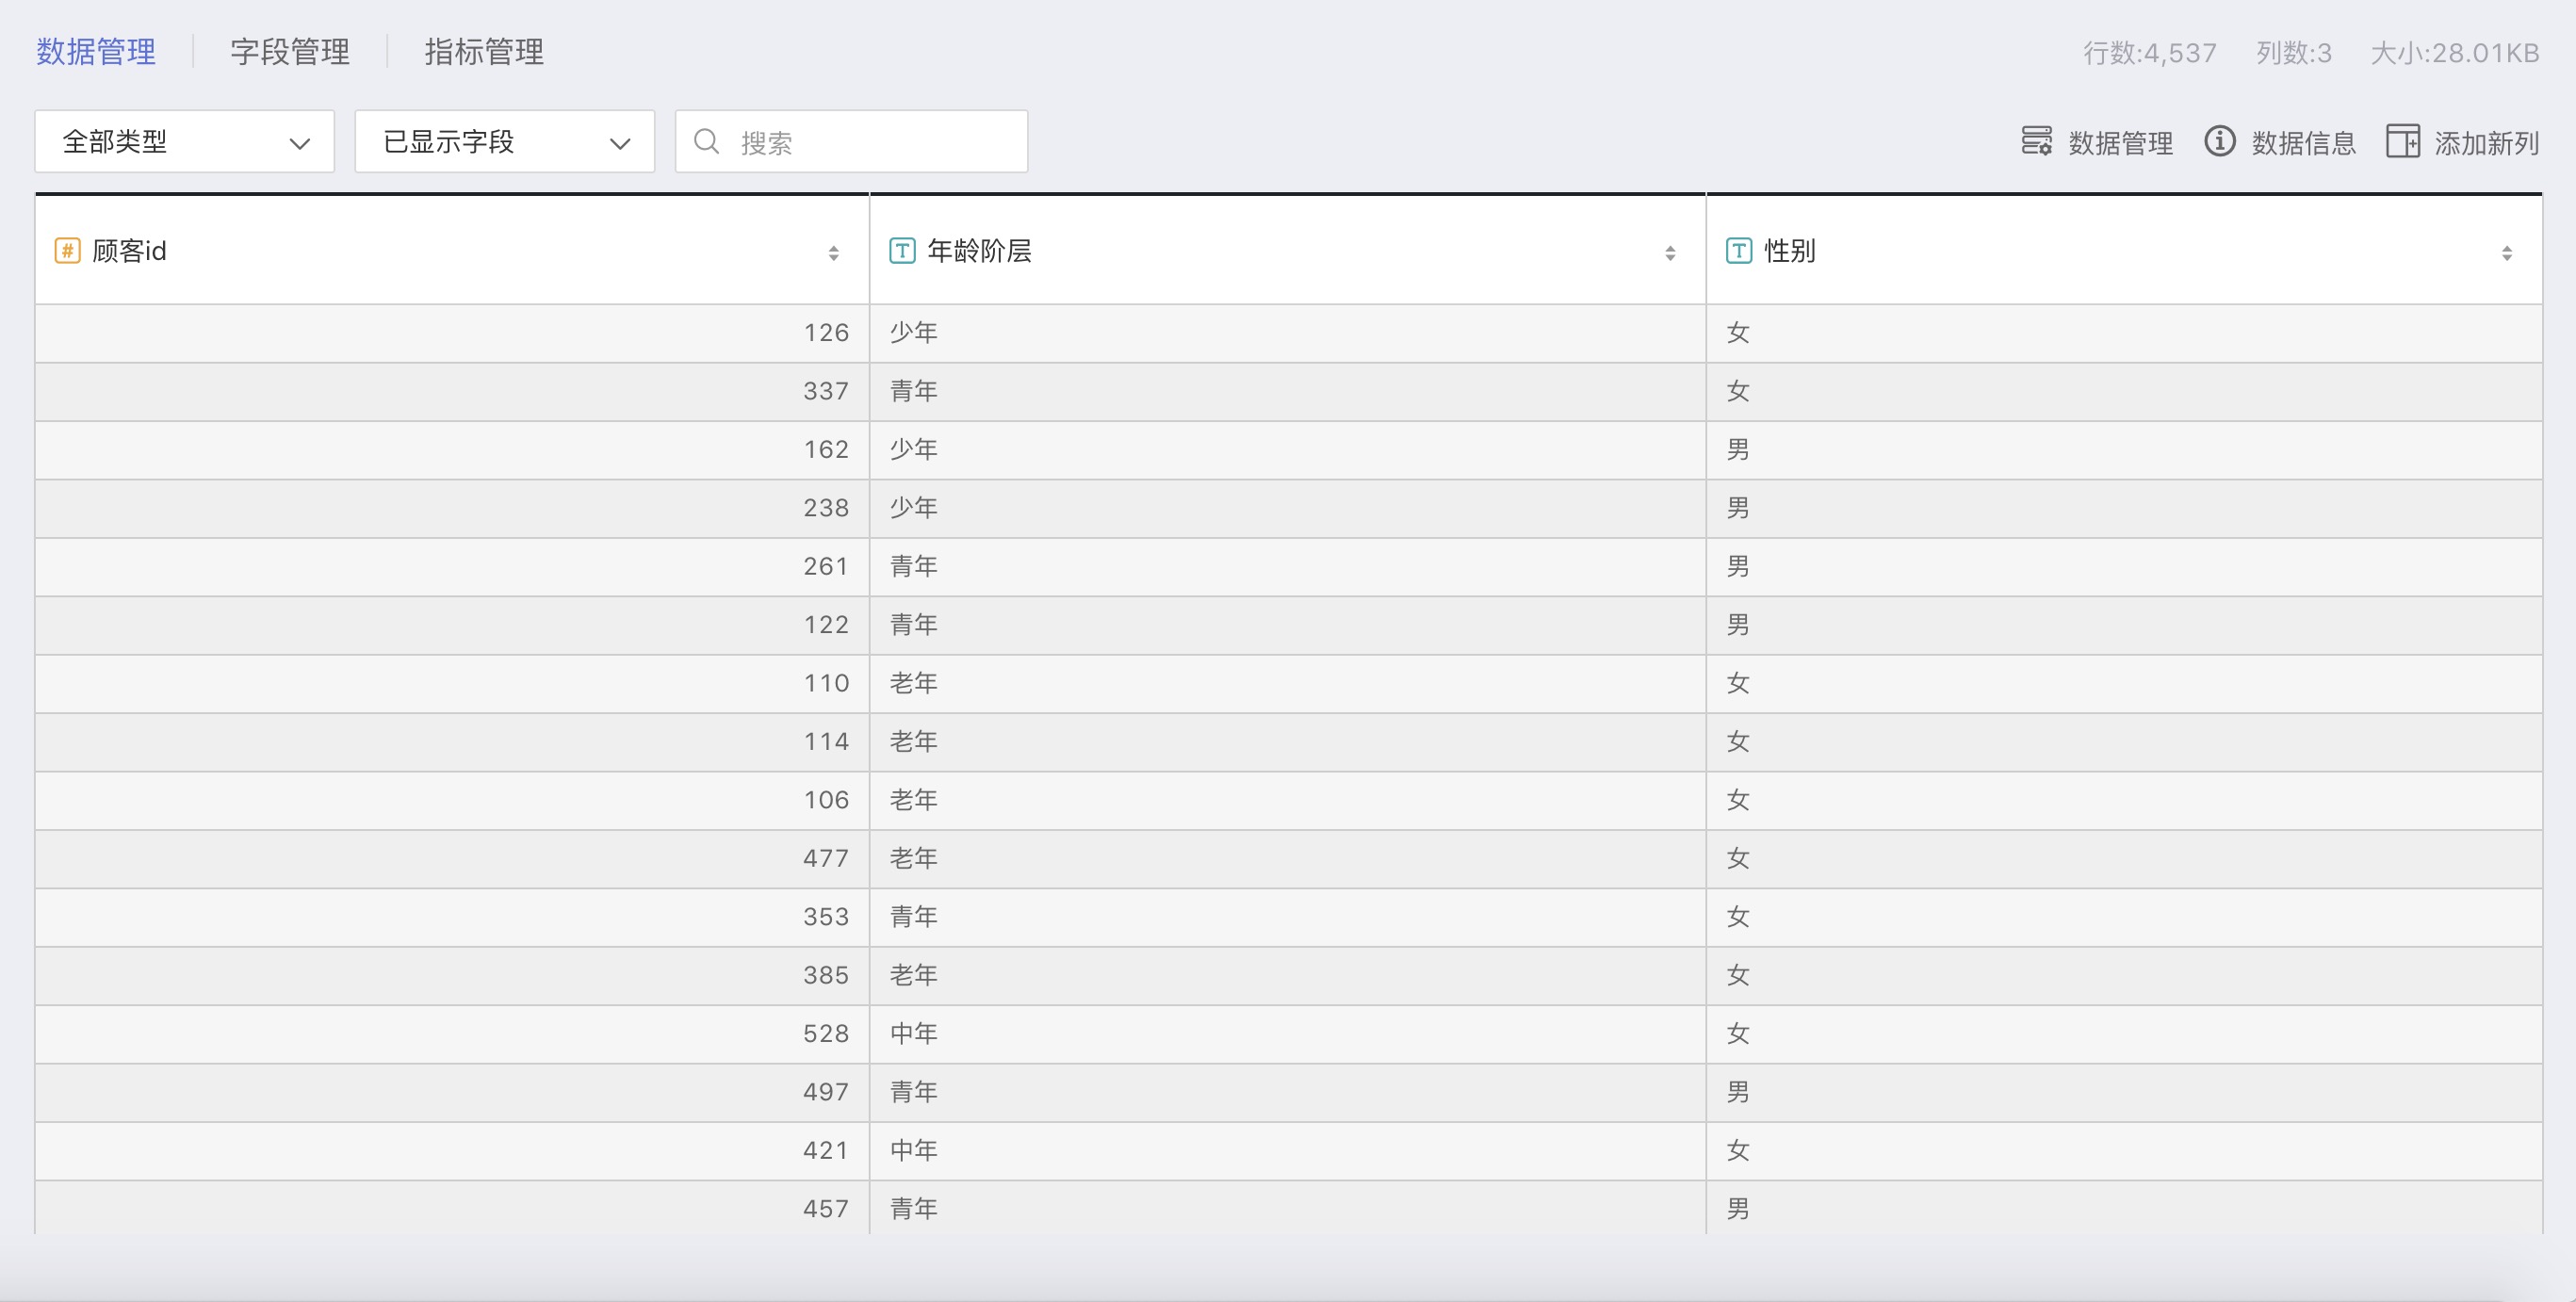
The customer information table summarizes all customer information:
| Field | Type | Description |
|---|---|---|
| Customer ID | Number | Unique identifier for each customer |
| Age Group | Text | General categorization of each customer's age group |
| Gender | Text | Gender of each customer |
Sales Data Table
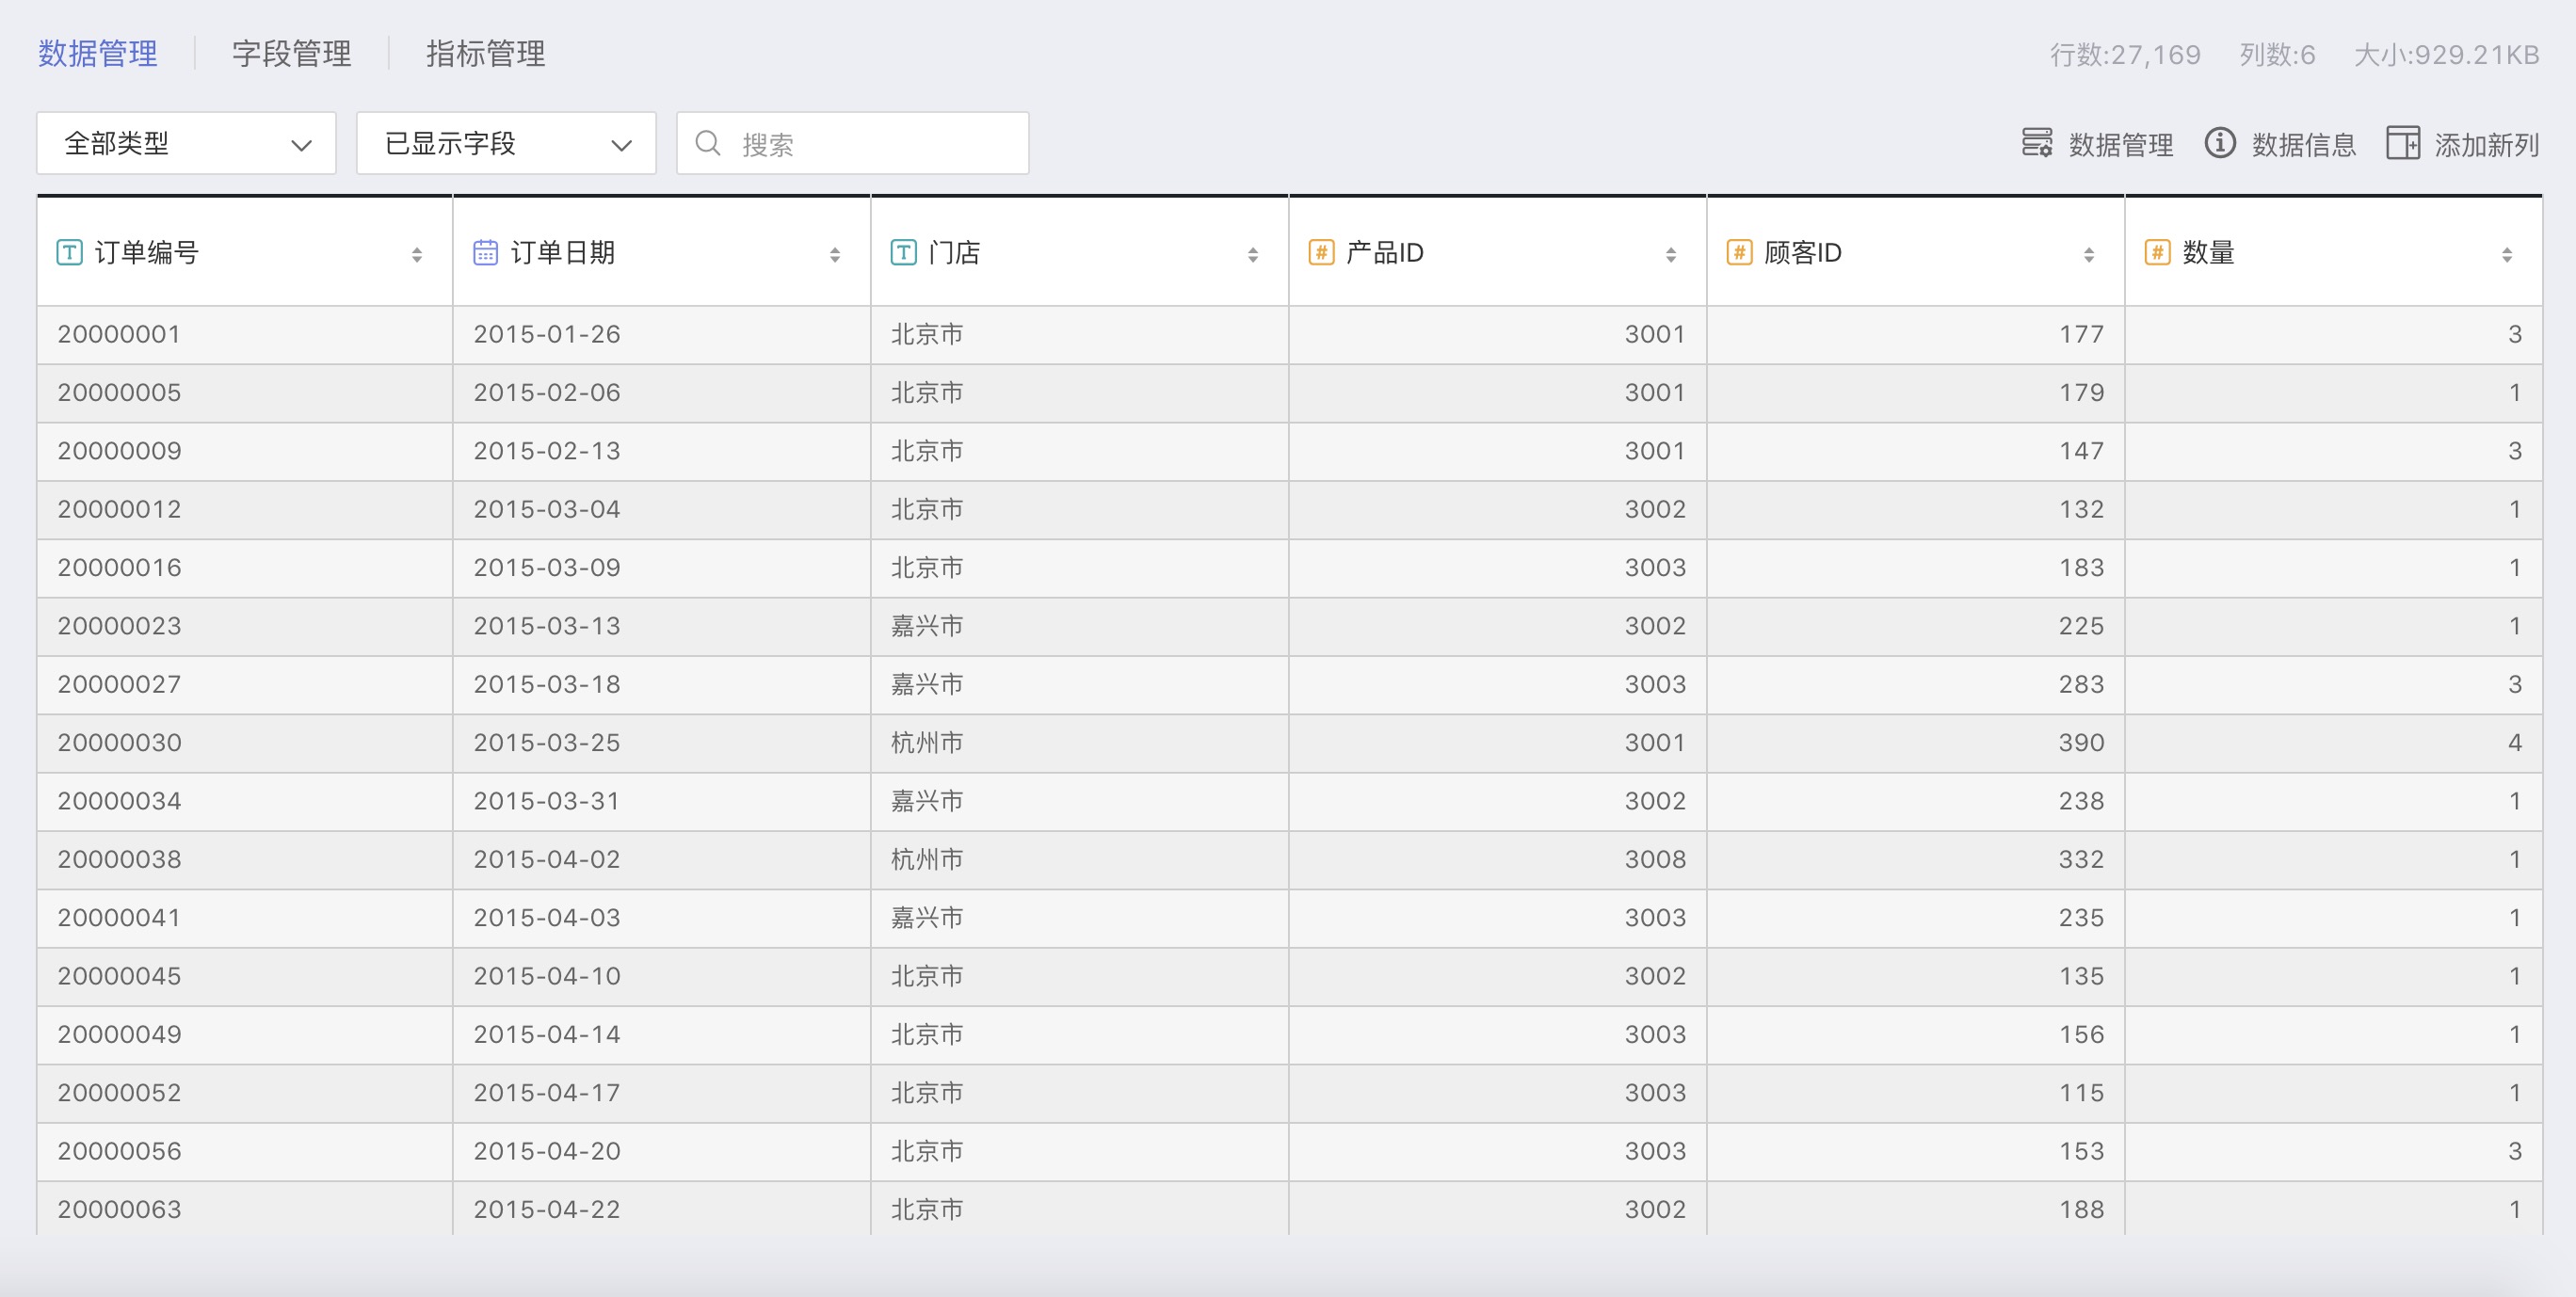
The sales data table contains detailed sales information for each order:
| Field | Type | Description |
|---|---|---|
| Order Number | Text | Unique identifier for each order |
| Order Date | Date | Date when the order was placed |
| Store | Text | The store where the order was placed, corresponding one-to-one with the Store Information Table |
| Product ID | Number | Unique identifier for each type of coffee, with a one-to-one relationship to the Product ID in the Product Table |
| Customer ID | Number | The ID of the customer who placed each order, corresponding one-to-one with Customer ID in the Customer Information Table |
| Quantity | Number | Number of coffee cups per order |
Data Processing
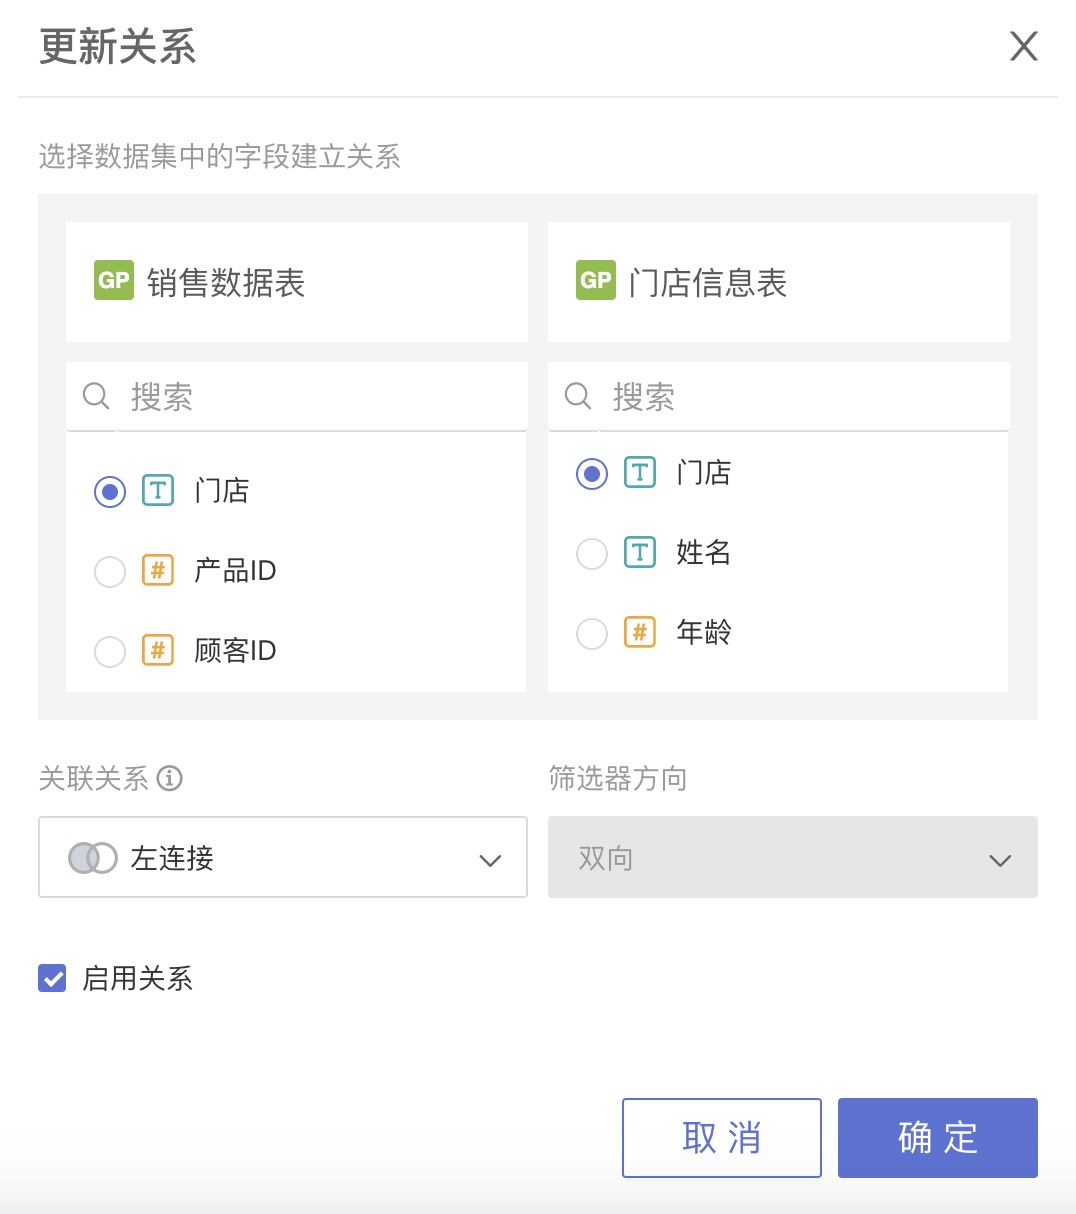
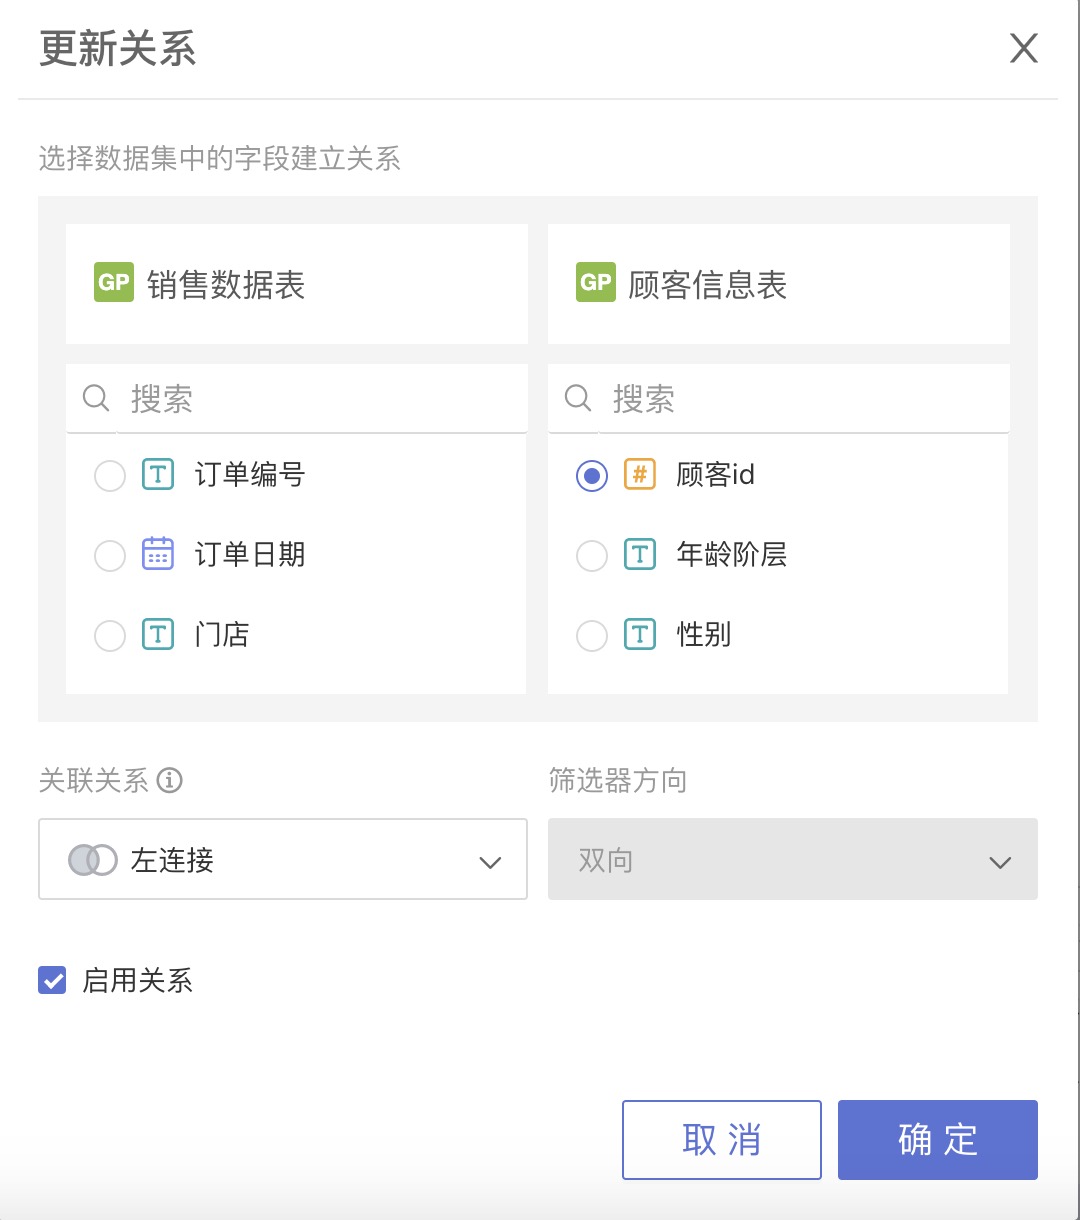
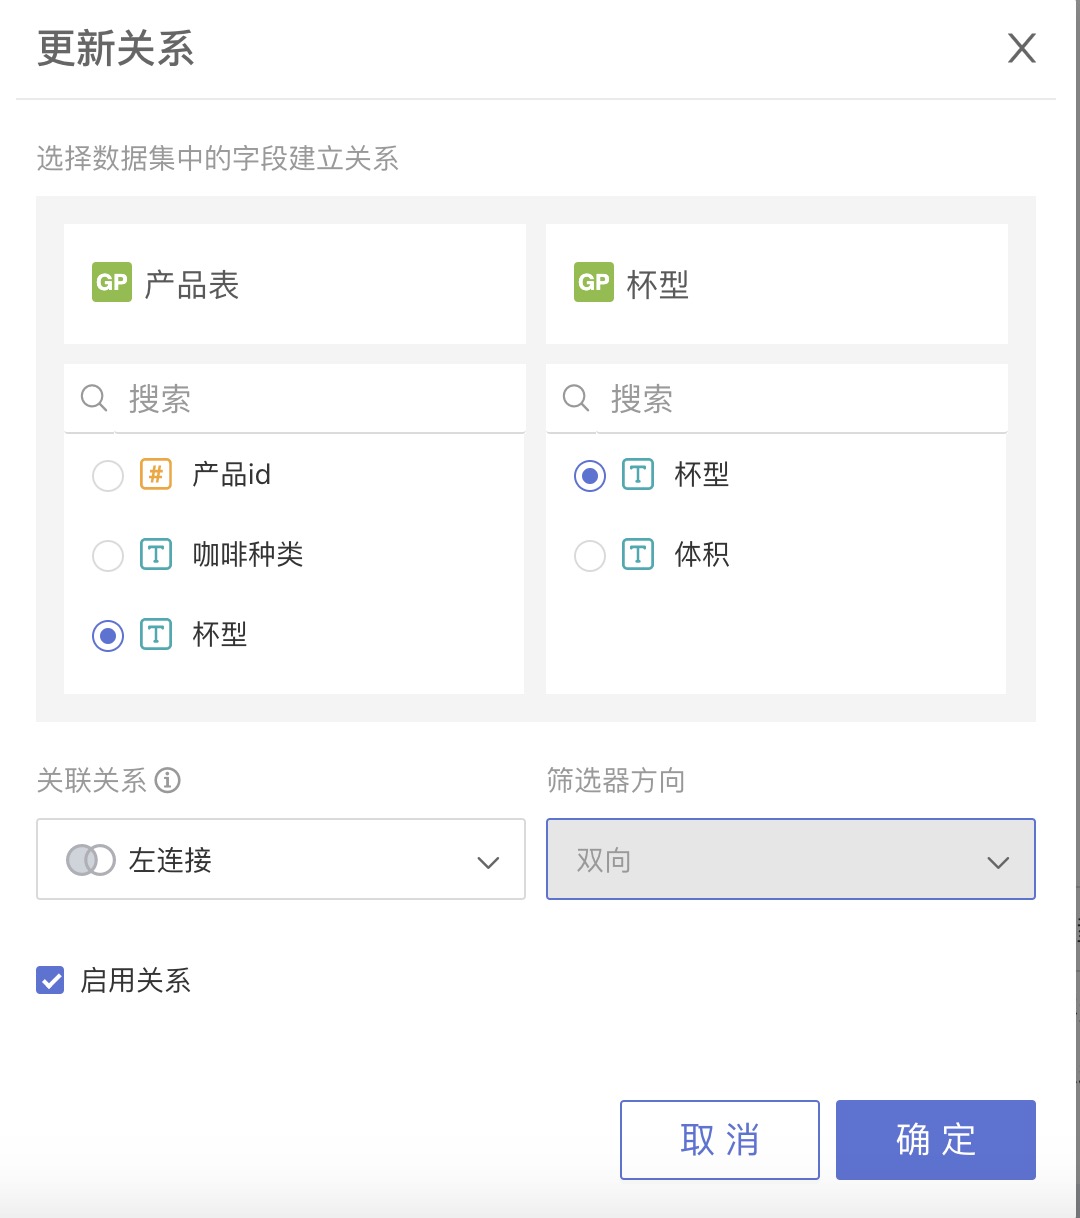
The above 5 tables have been modeled based on their key field correspondences:
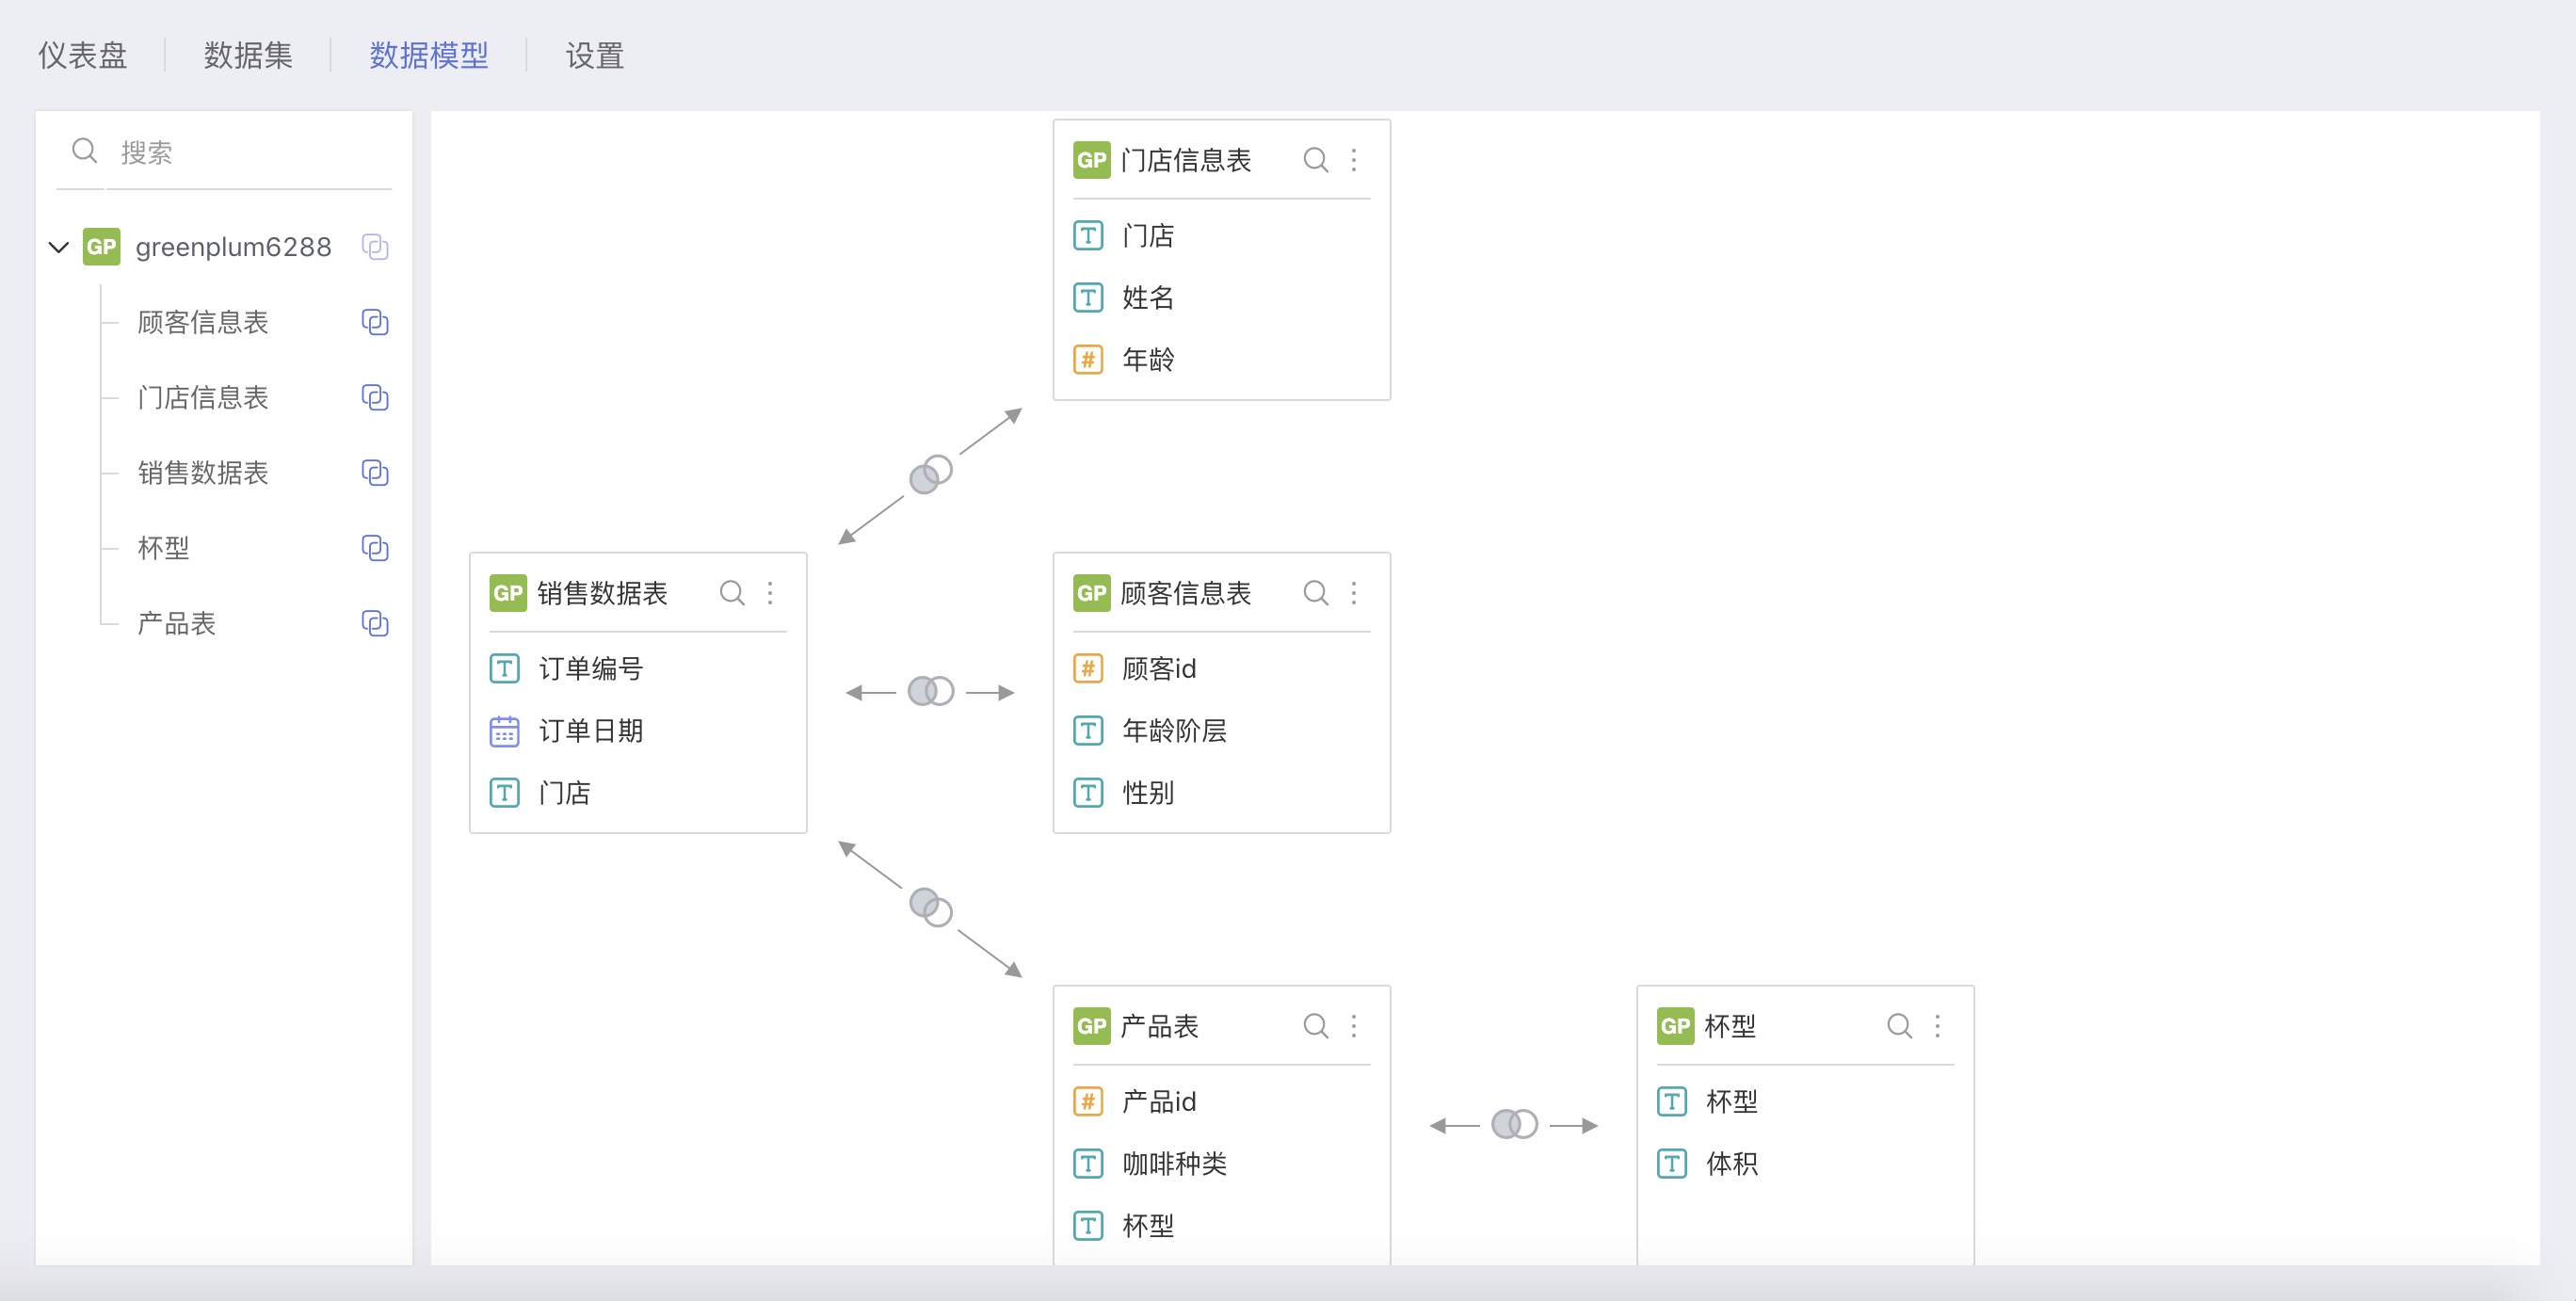
The relationships are as follows:
Sales Data Table and Store Information Table
Sales Data Table and Customer Information Table
Sales Data Table and Product Table
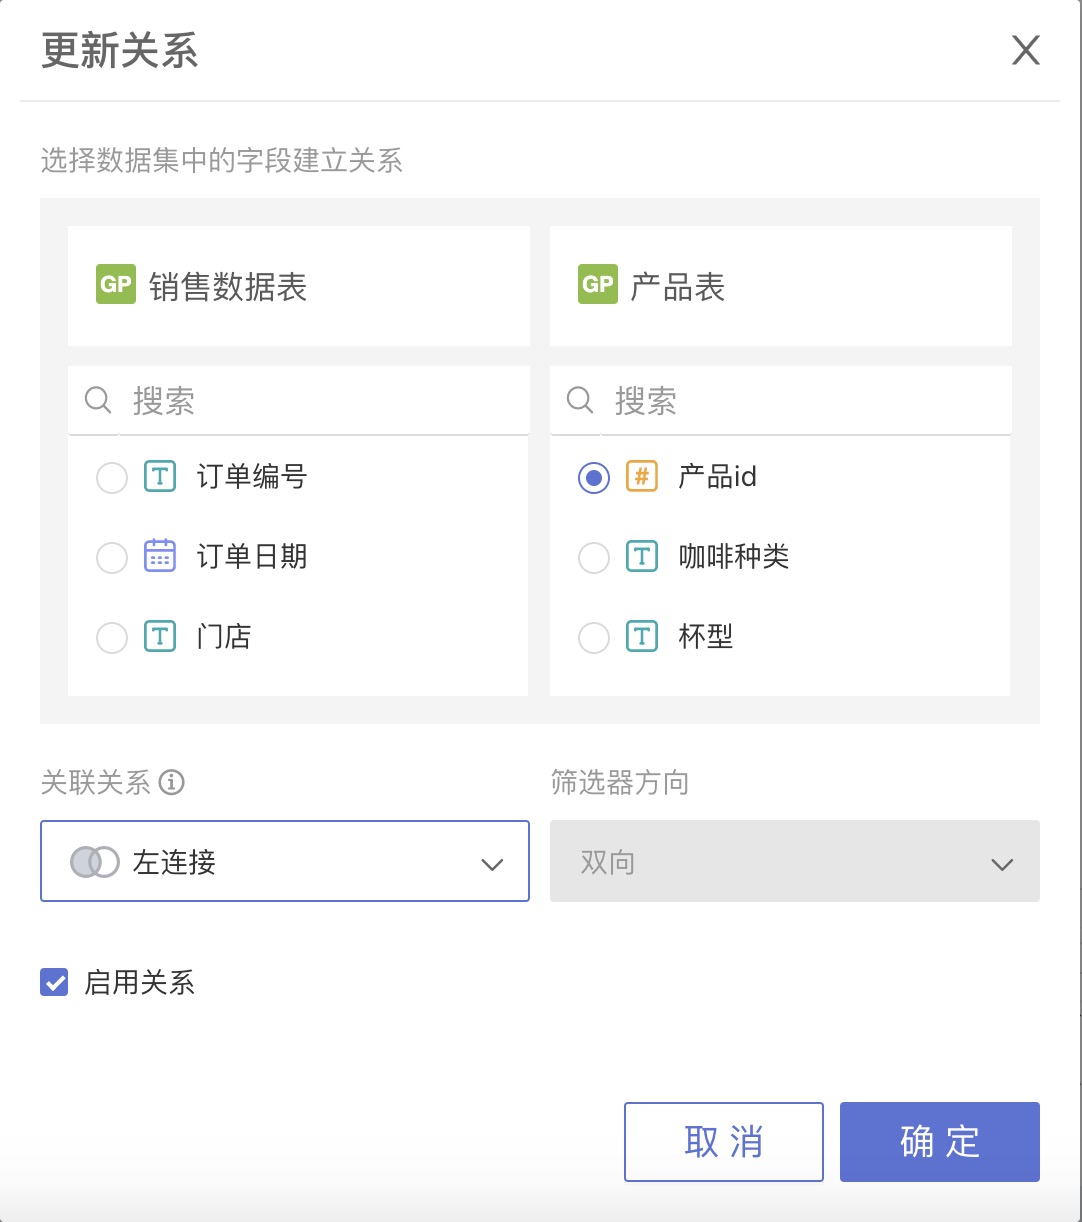
Product Table and Cup Size Table
Analysis Requirements
- Analysis by product dimension
- Analysis by time dimension
- Cross-analysis of product and time dimensions
Below, we take the coffee analysis as an example to introduce various advanced calculation methods in detail.
Year-on-Year/Sequential Growth
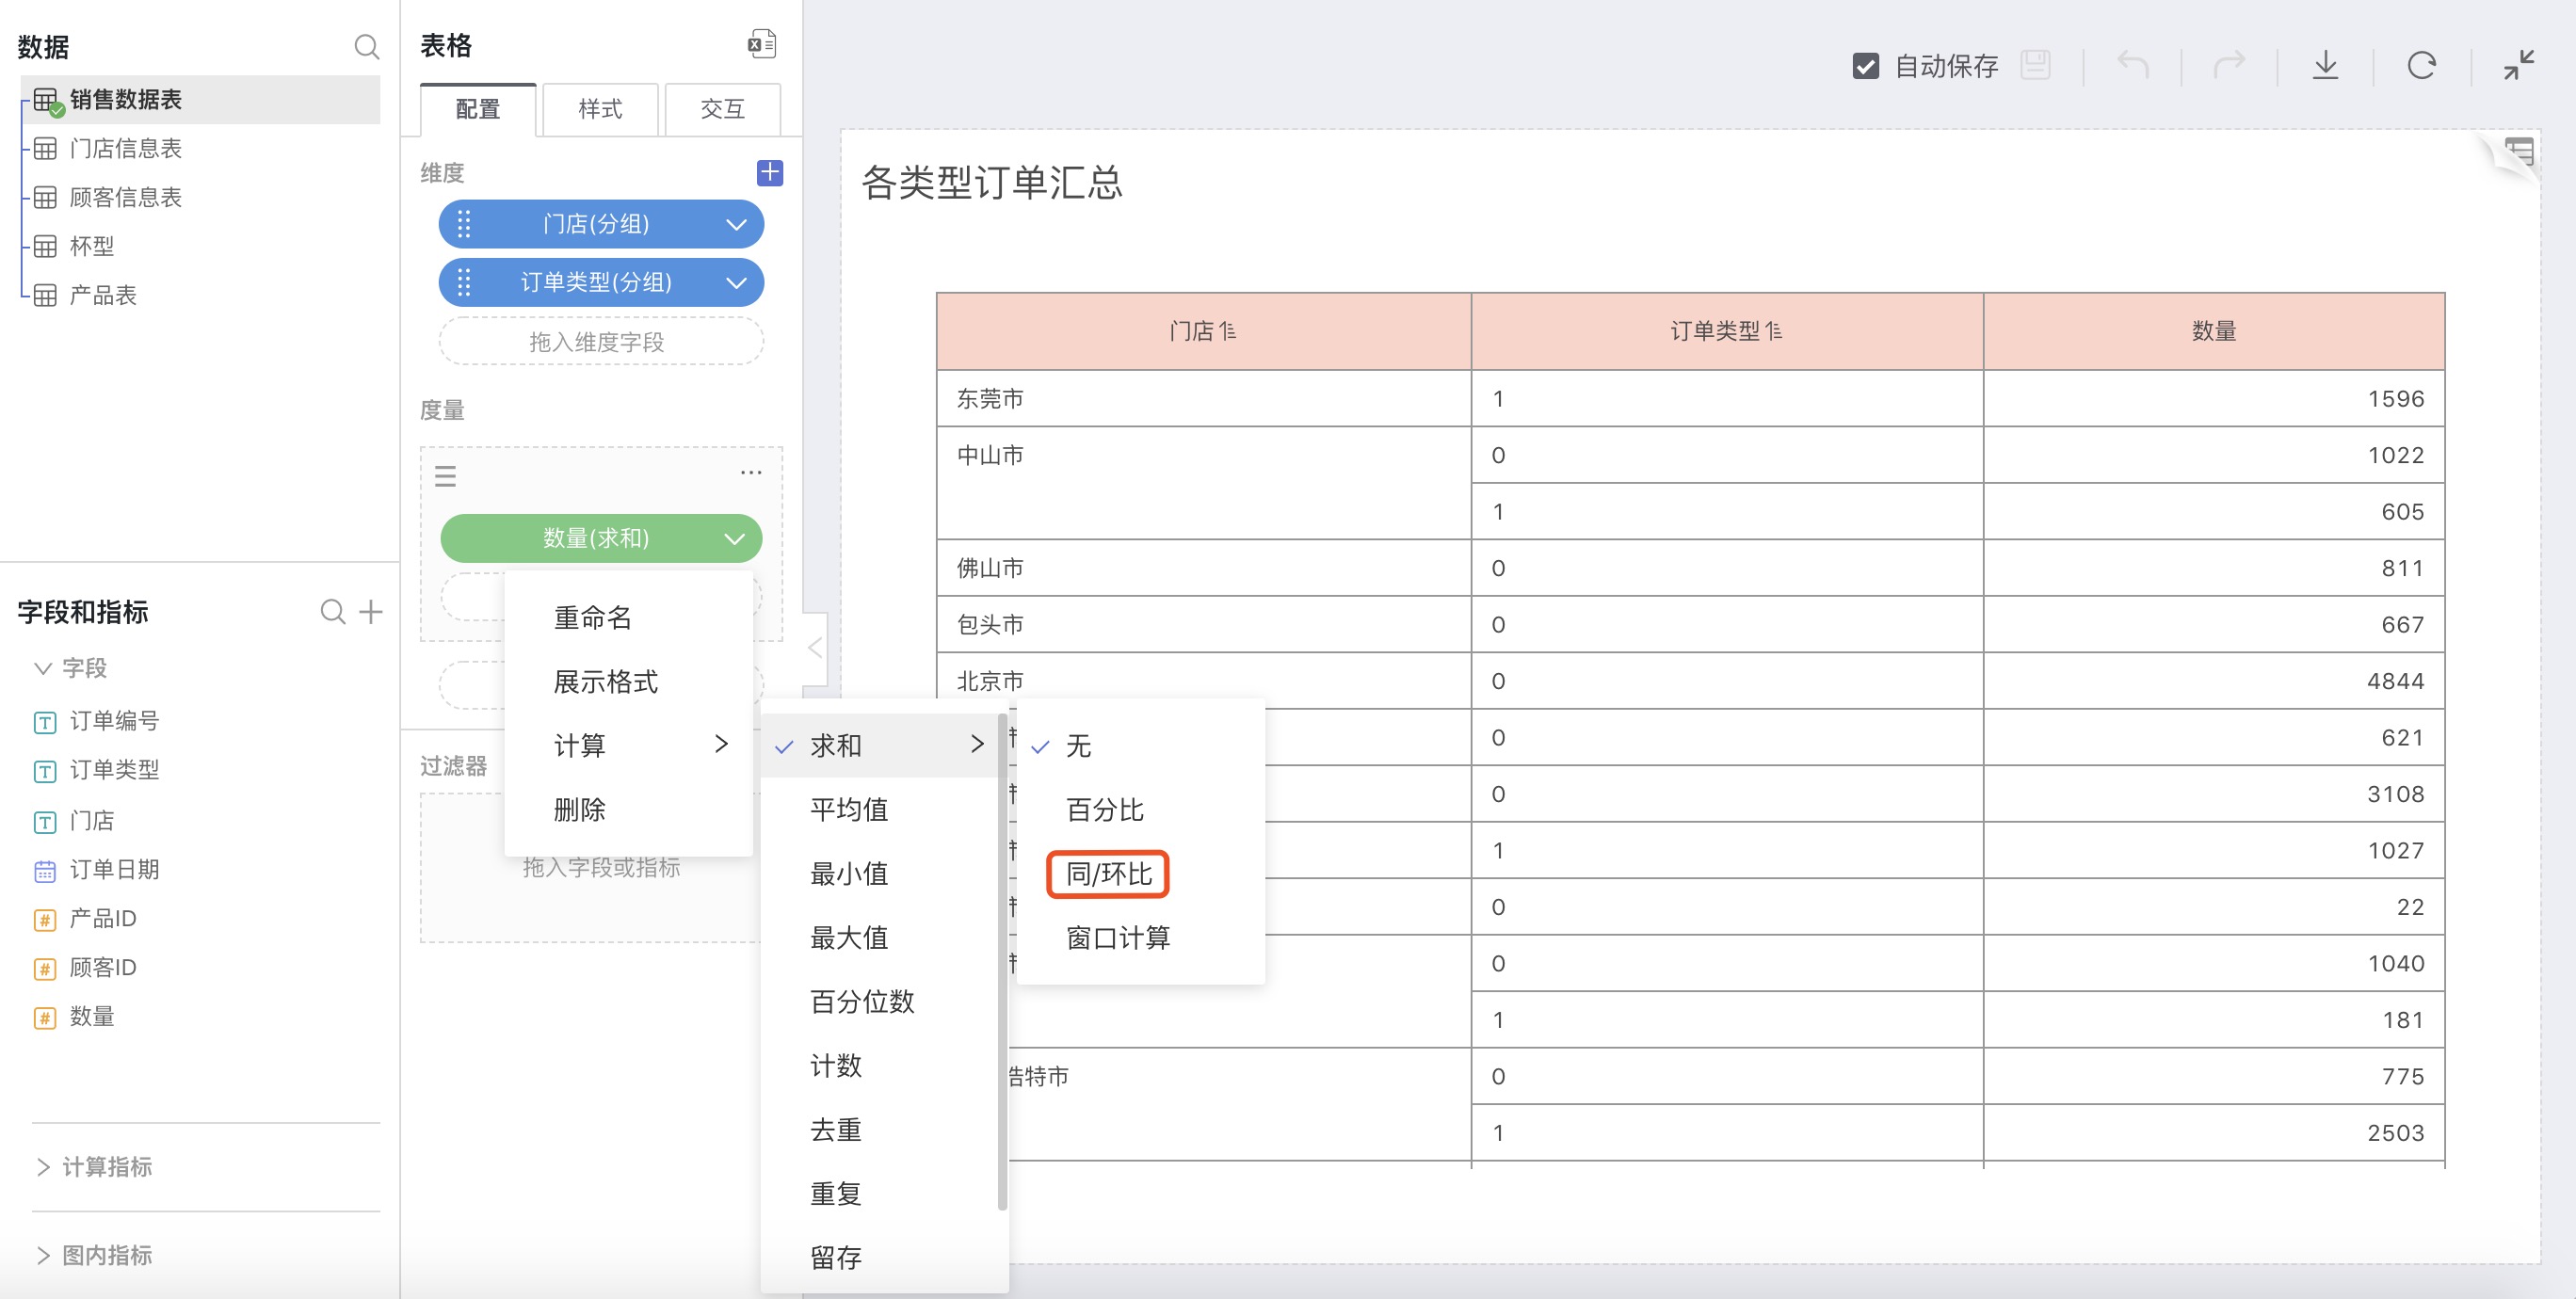
When the calculations for measures include Sum, Average, Max, Min, Count, Distinct, click on the button after the calculation method, and you can select Year-on-Year/Sequential Growth in the expanded selection box.
Explanation
Year-on-Year (YoY)
Refers to the percentage change between two unit periods, such as January this year compared to January last year.Sequential Growth
Refers to the percentage change within two consecutive unit periods, such as this month compared to the previous month.
Calculation Method
Year-on-Year
YoY = (Current Period Amount - Same Period Last Year Amount) / |Same Period Last Year Amount| × 100%Sequential Growth
Sequential Growth = (Current Period Amount - Previous Period Amount) / Previous Period Amount × 100%
How to Use
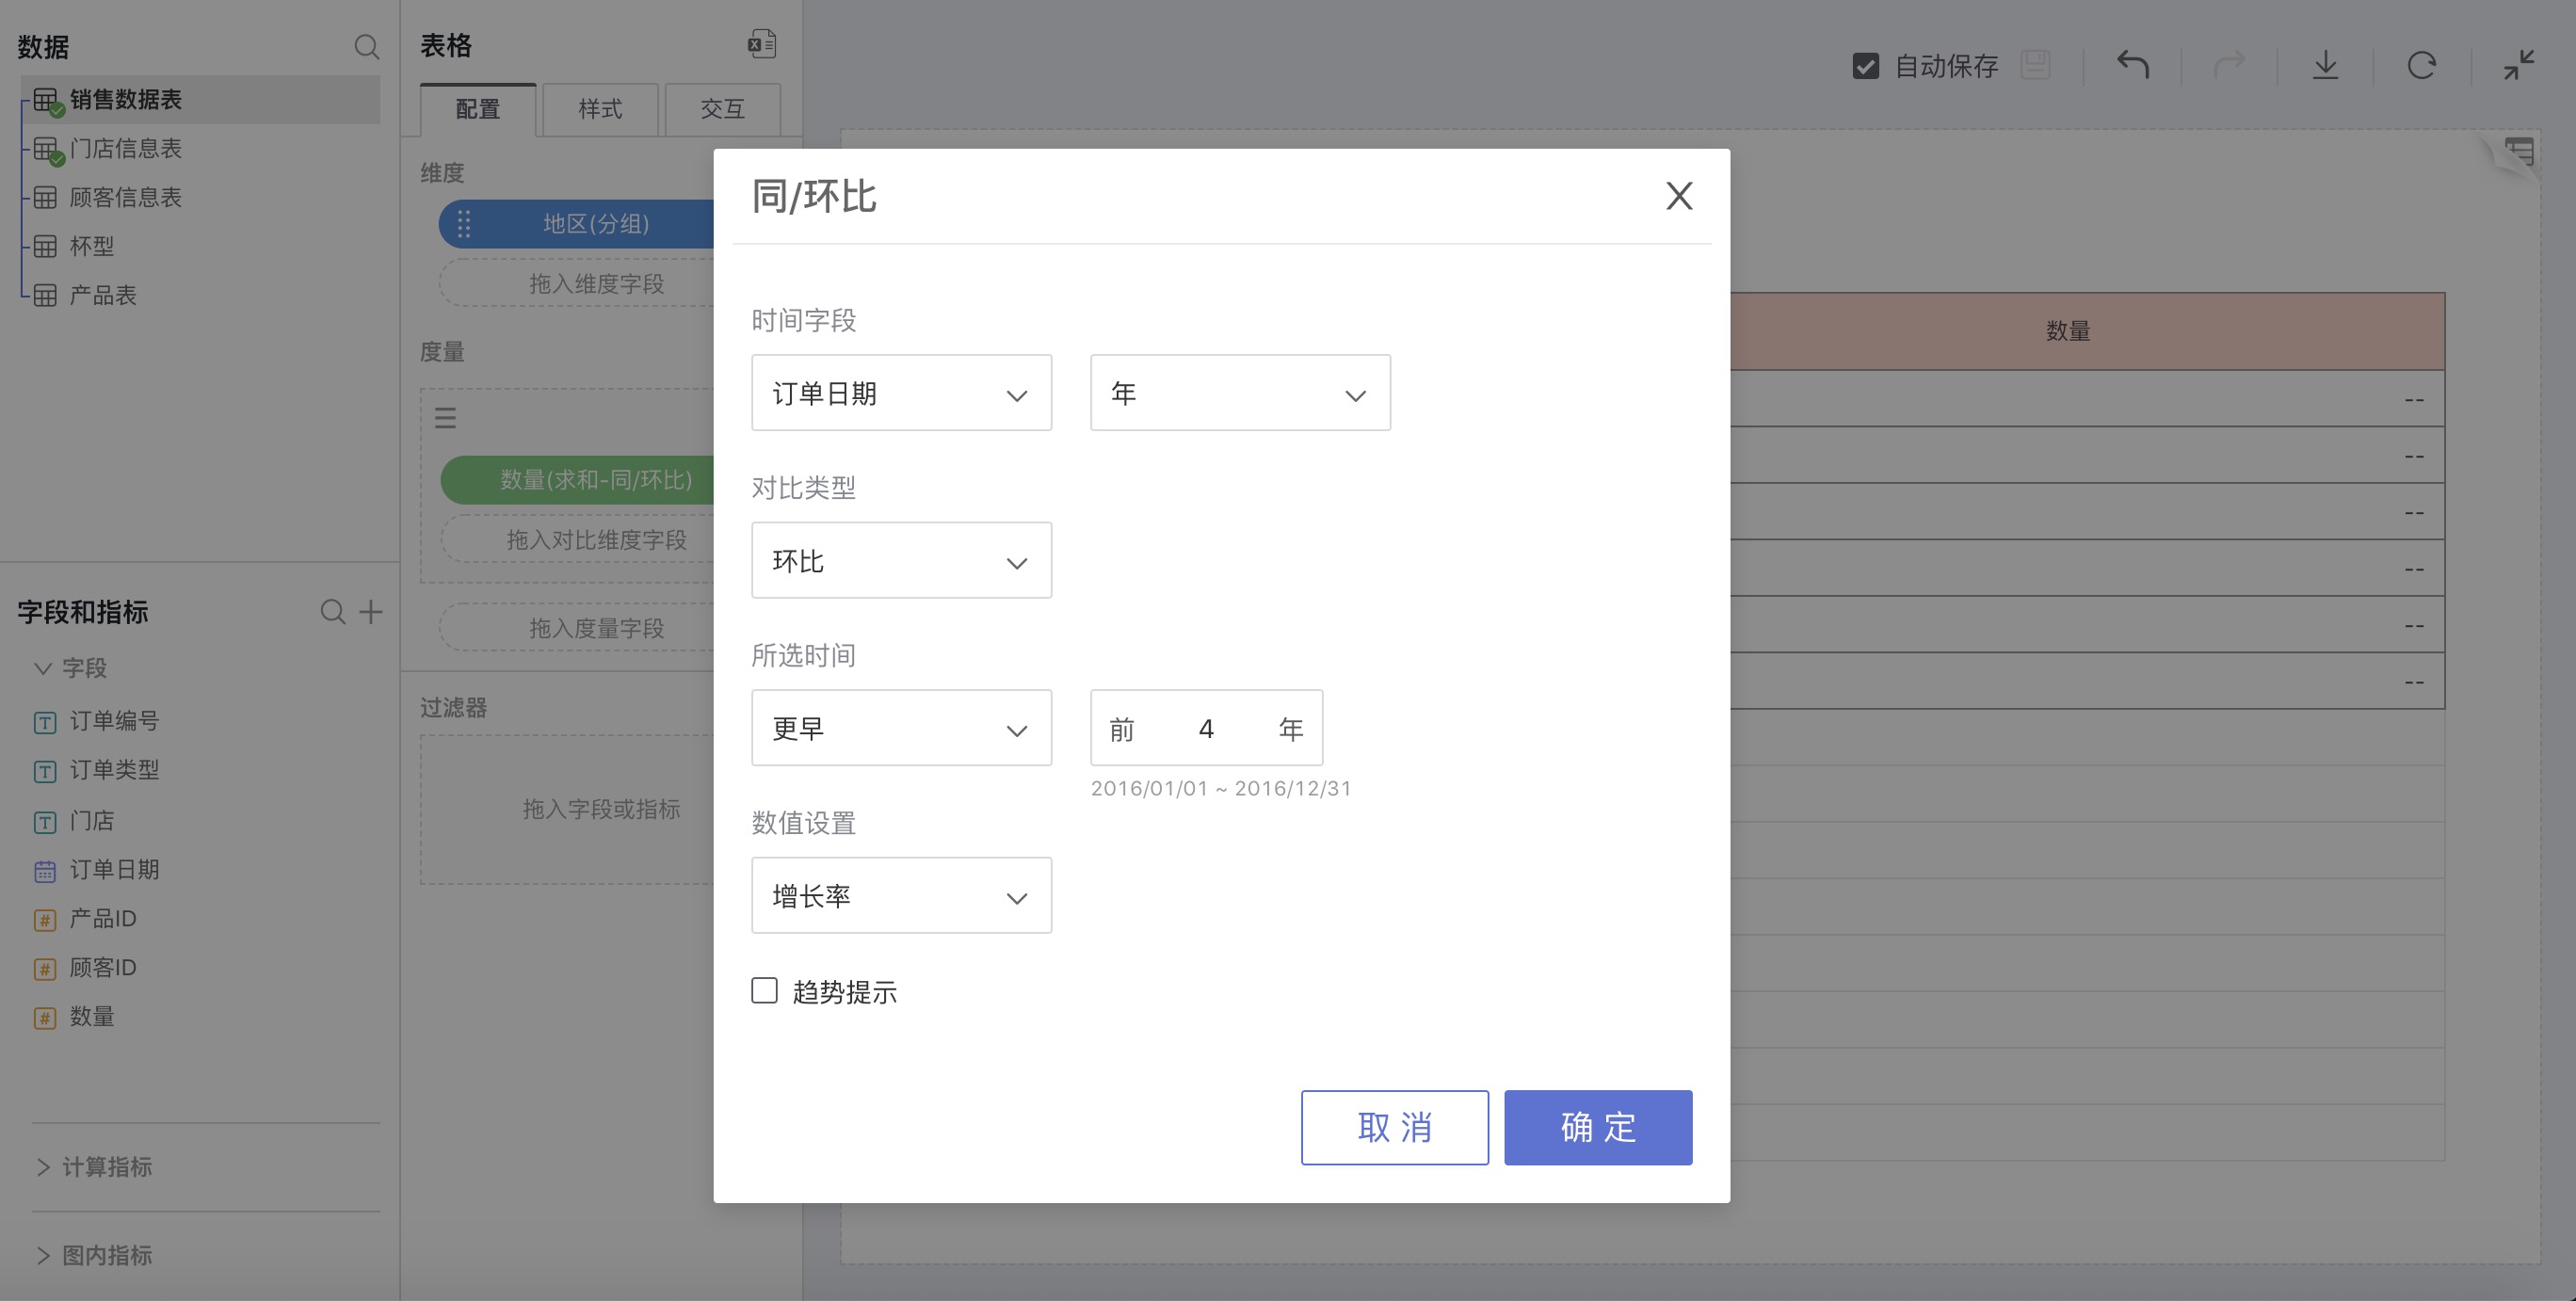
Select Year-on-Year/Sequential Growth in advanced calculation for measures. In the pop-up settings window for Year-on-Year/Sequential Growth, make custom settings.
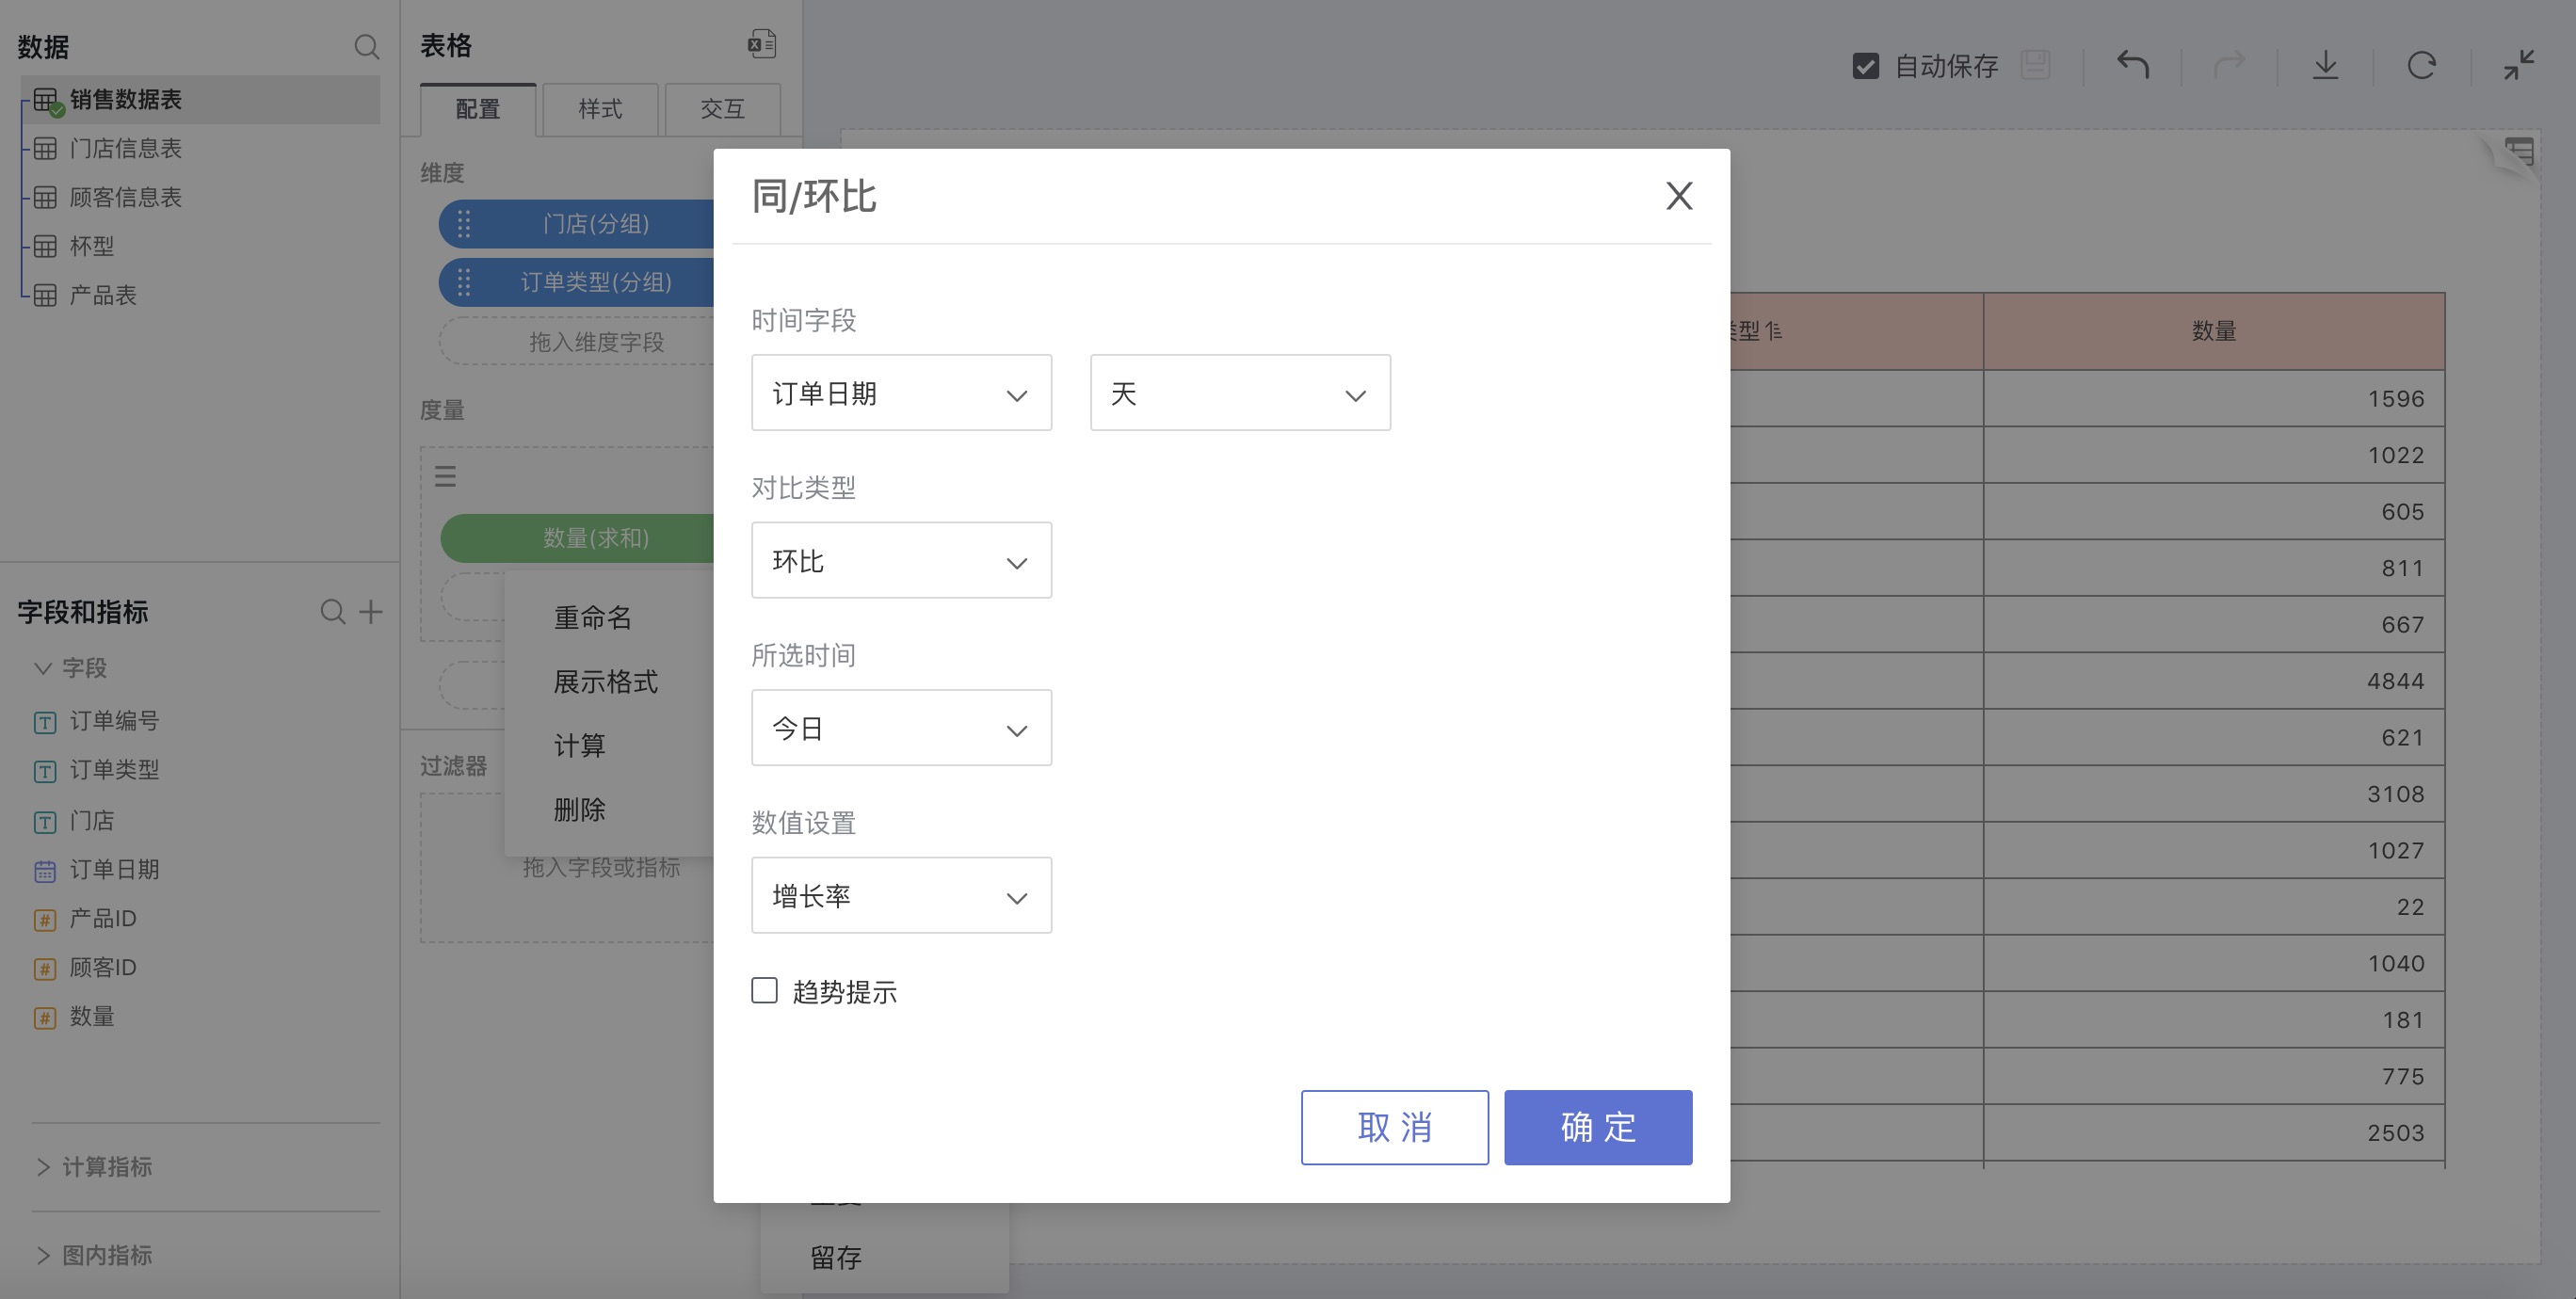
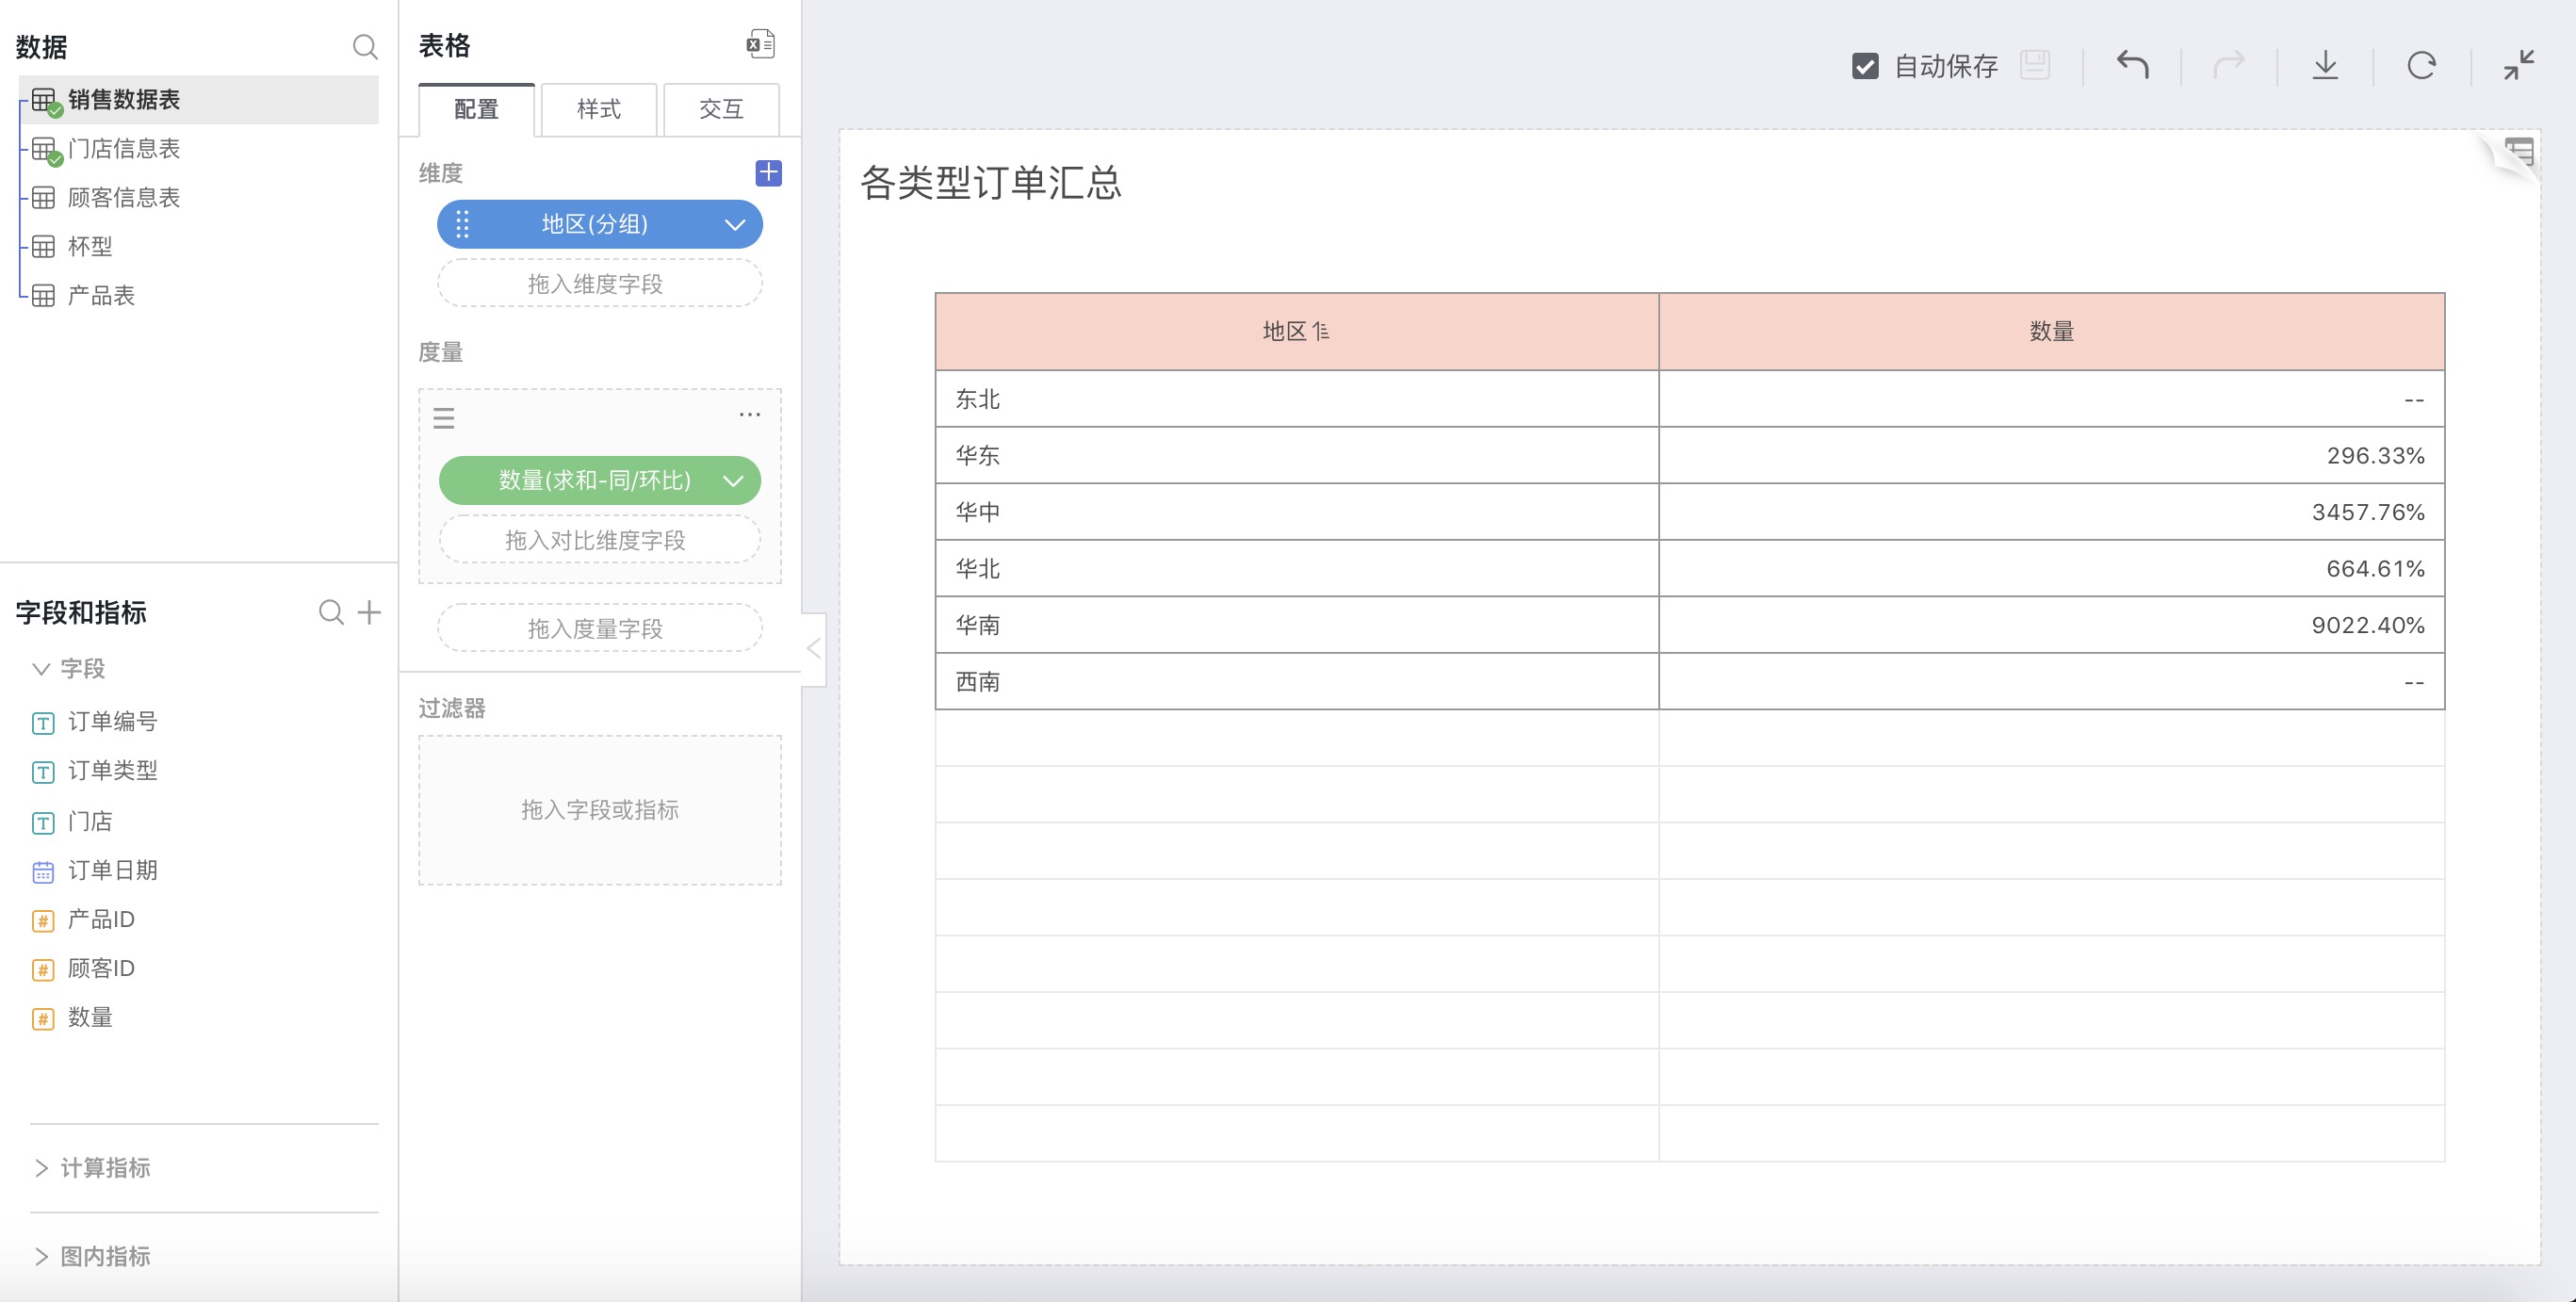
For example: Calculate the sequential growth for each region in 2016
Thus, the growth rate for each region in 2016 compared to 2015 is as shown in the following figure:
Percentage
When the calculations for measures include Sum, Average, Max, Min, Count, Distinct, click on the button after the calculation method, and you can select Percentage in the expanded selection box.
Explanation
The selected value as a percentage of the total.
Calculation Method
Percentage = Selected Value / Total × 100%
How to Use
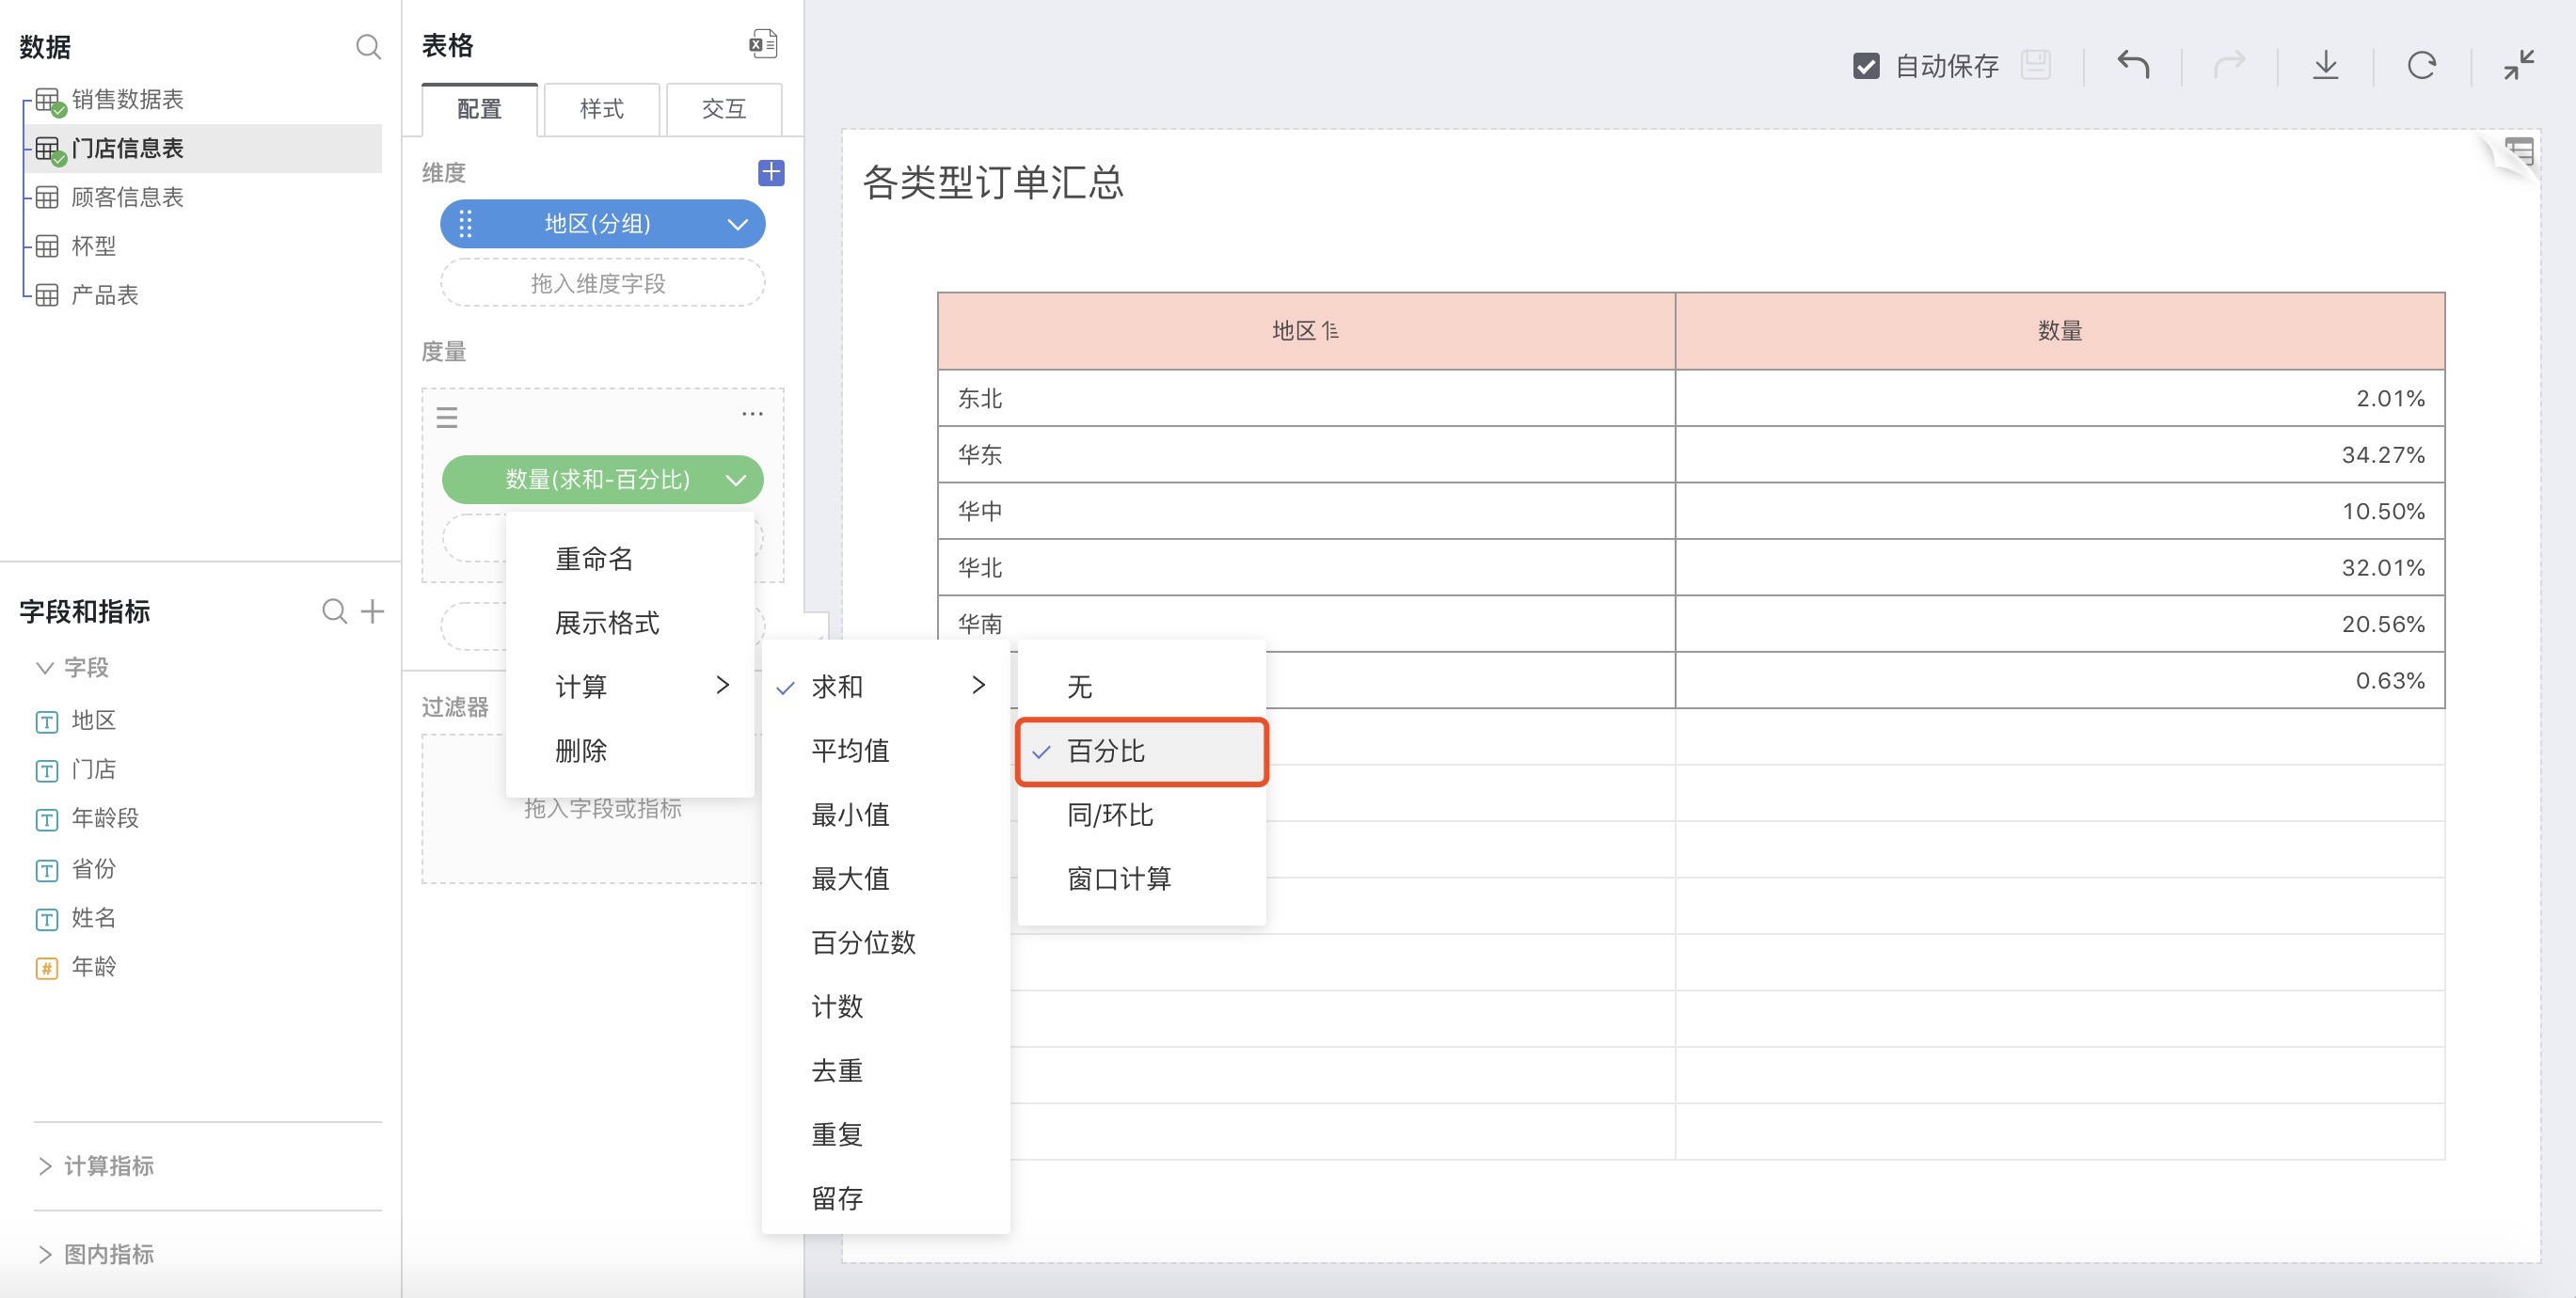
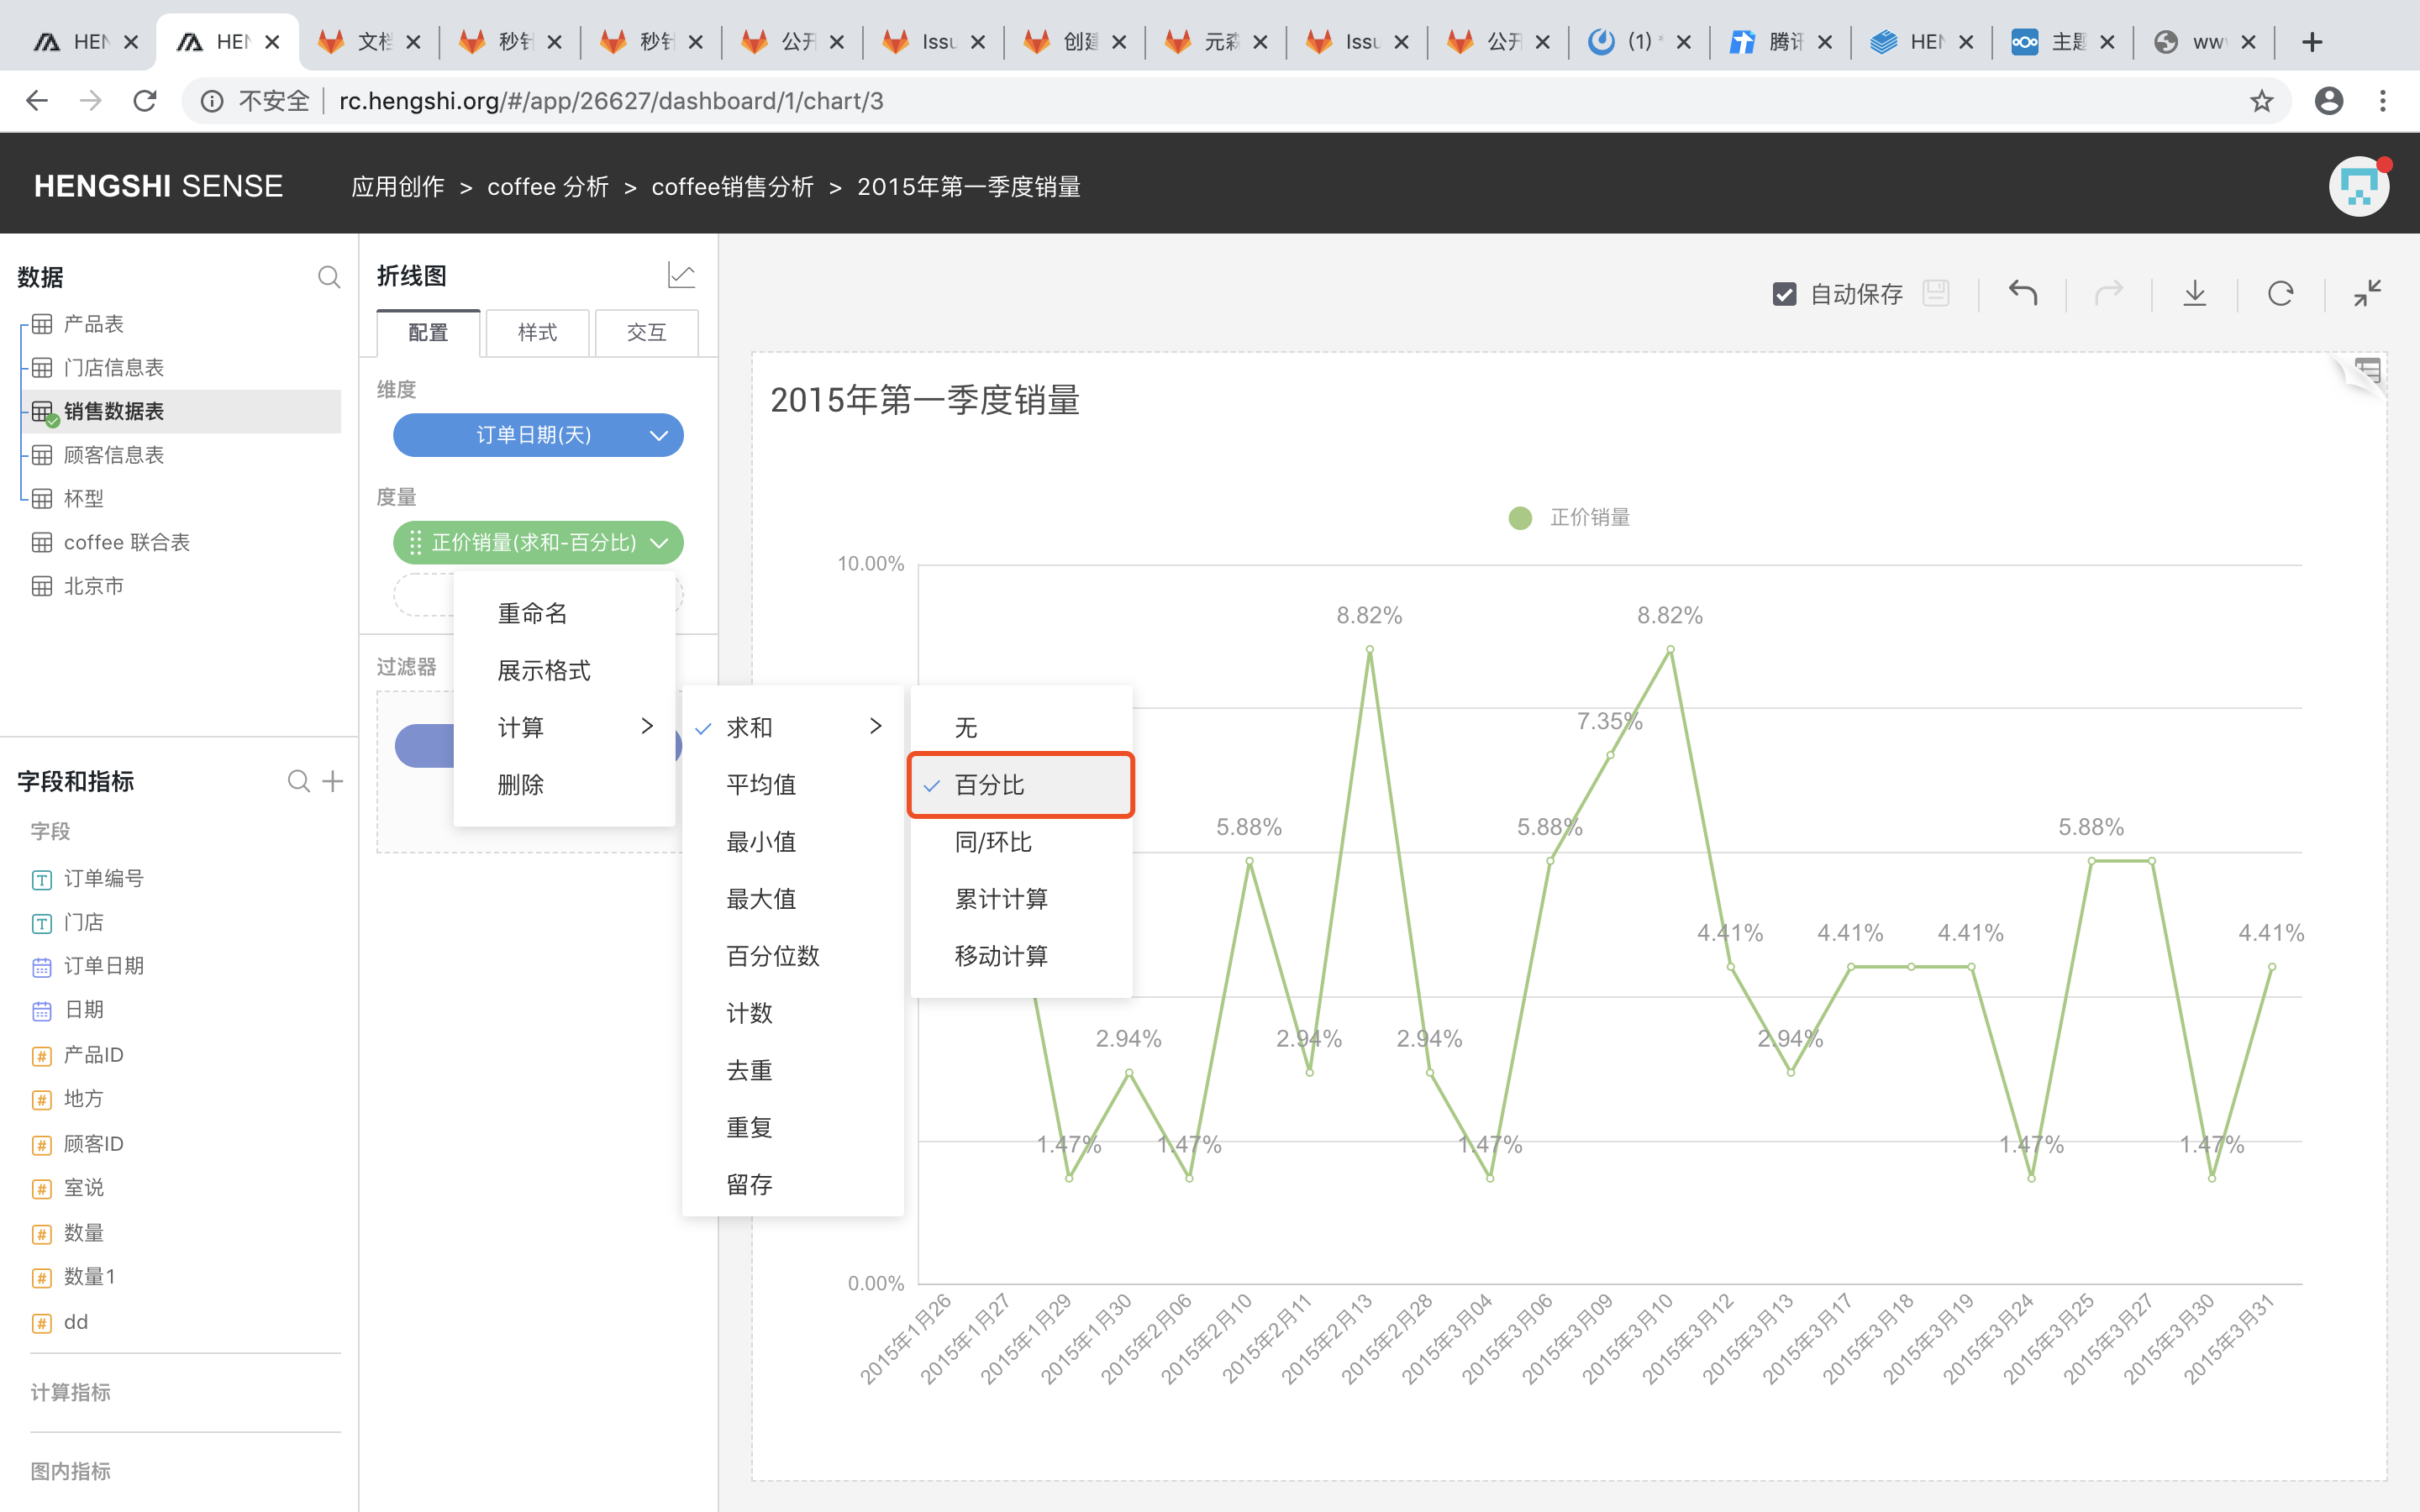
Select Percentage in the advanced calculation for measures.
For example: Calculate the percentage of coffee demand by different age groups out of the total demand
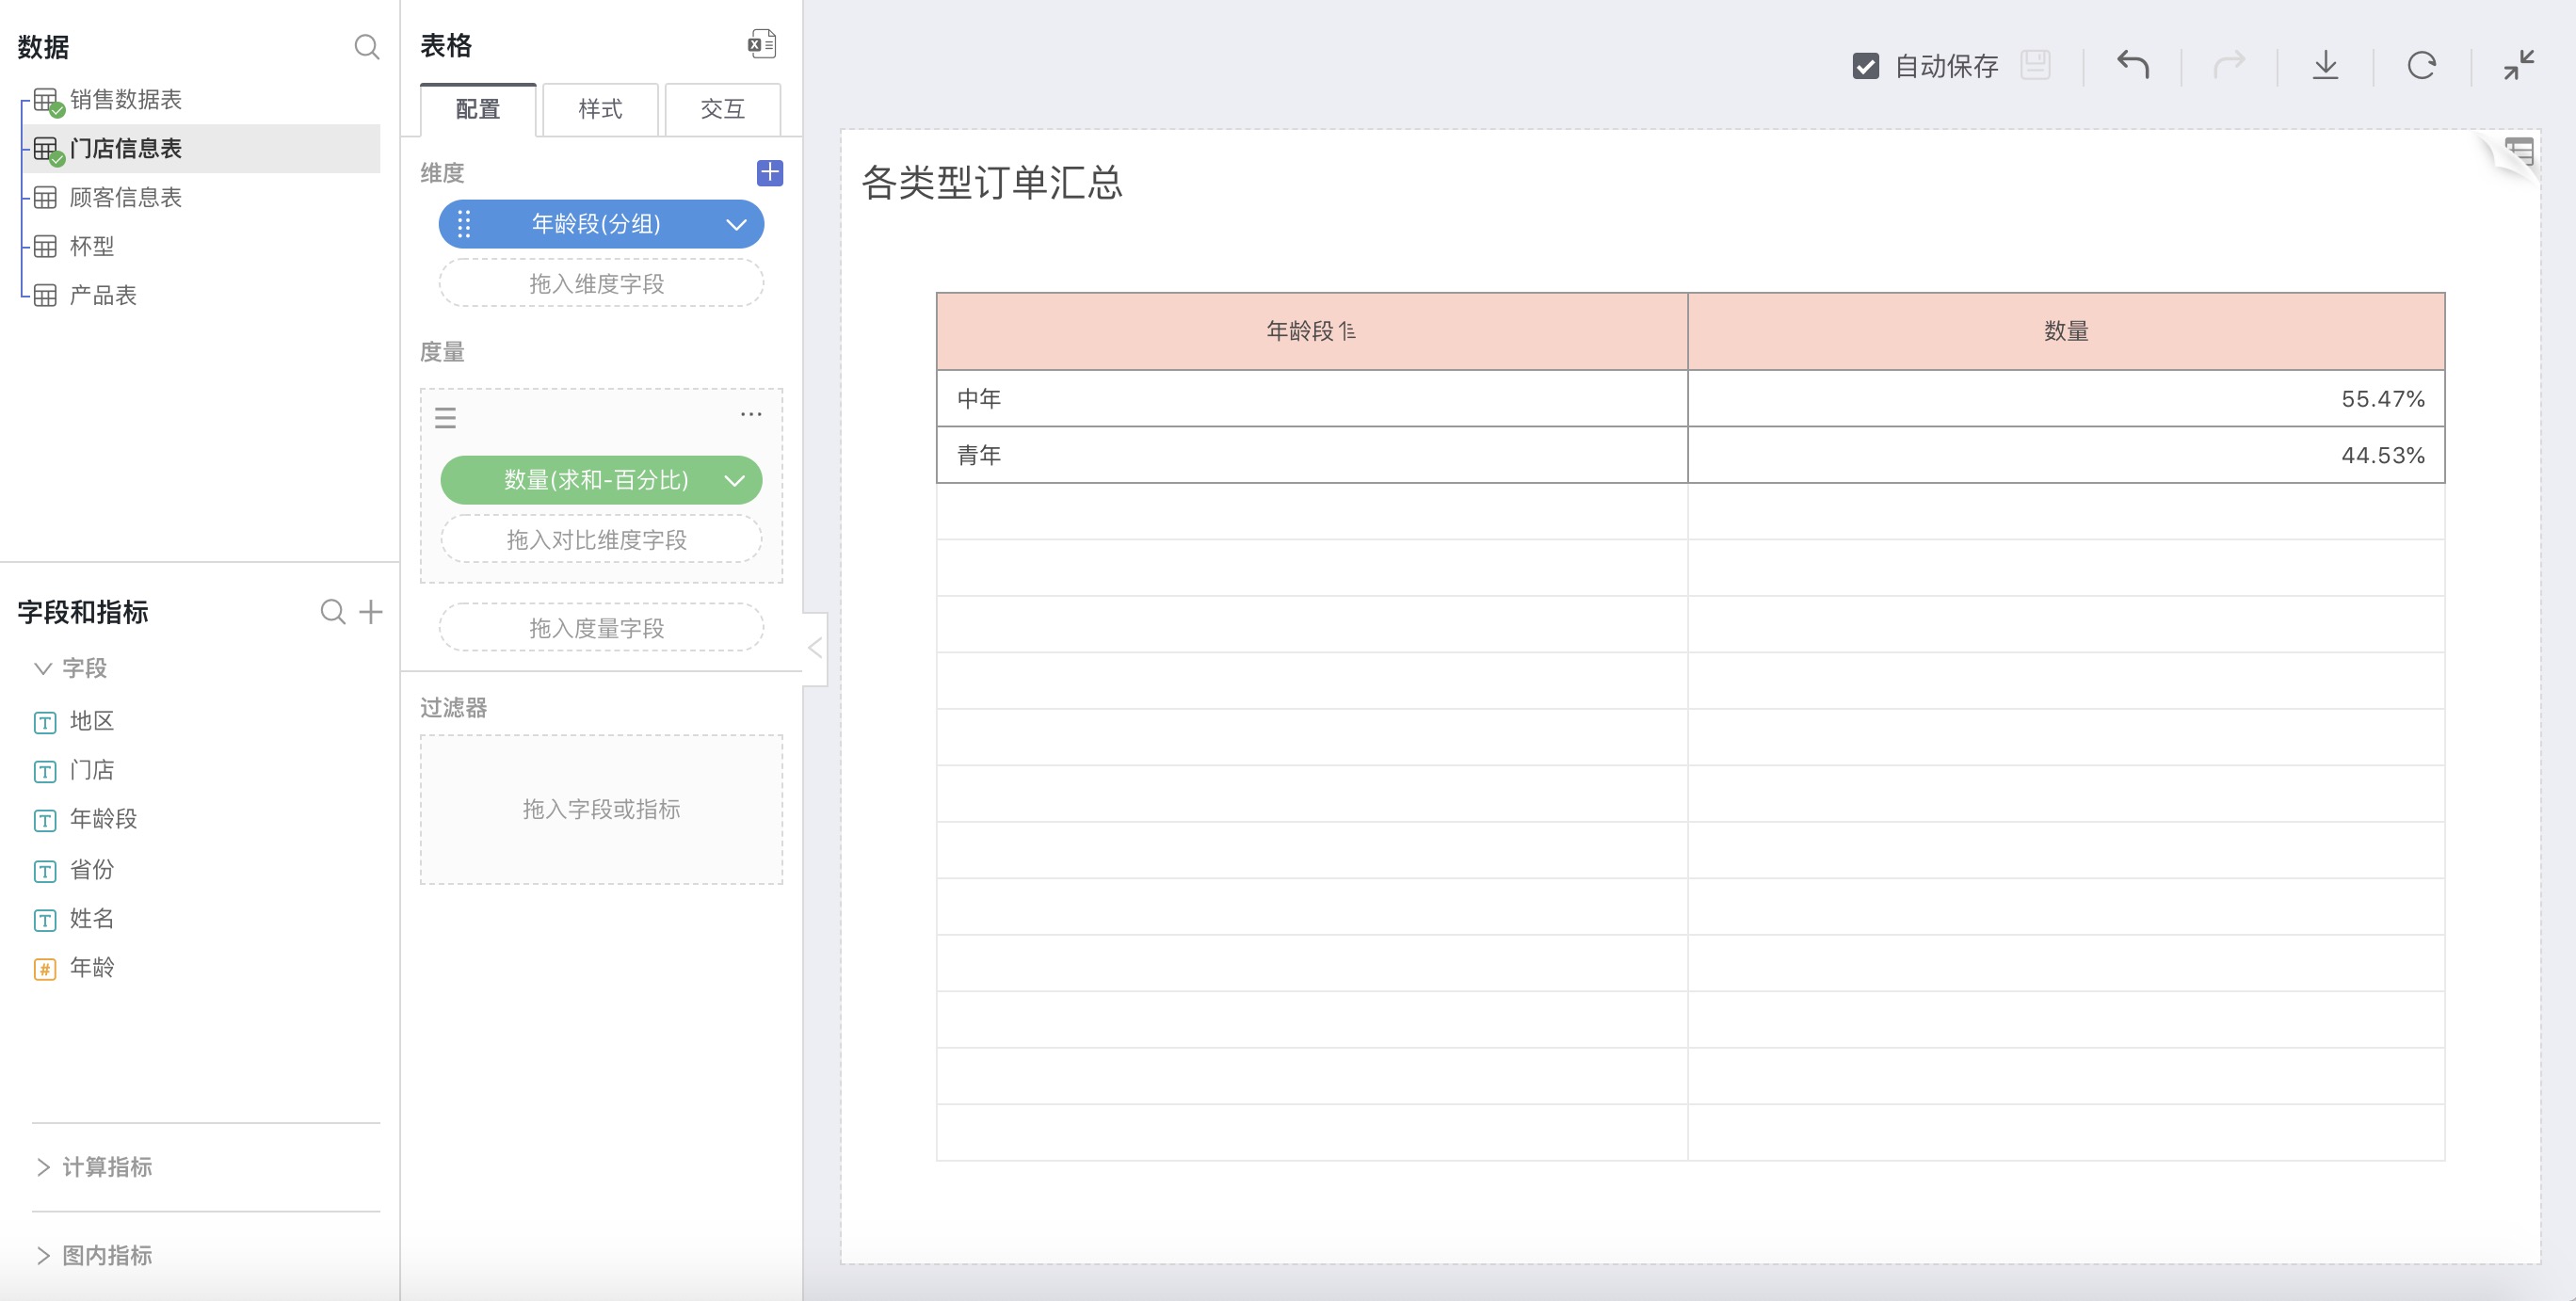
As shown in the table above: The demand for coffee from the middle-aged group is 55.47%, slightly higher than the younger group.
Retention
Explanation
Retention numbers and retention rates reflect the quality of an application and the ability to retain users. Users who start using an application within a certain period and continue to use it after a period are considered retained users.
Limitations
The selected end time must be less than the start time of the active period. Retention calculation is based on users who used a product within the selected time period and are still using the application during the retention period after a certain amount of time. Therefore, if the two periods overlap, the calculated retention rate is 100 percent and has no business meaning.
How to Use
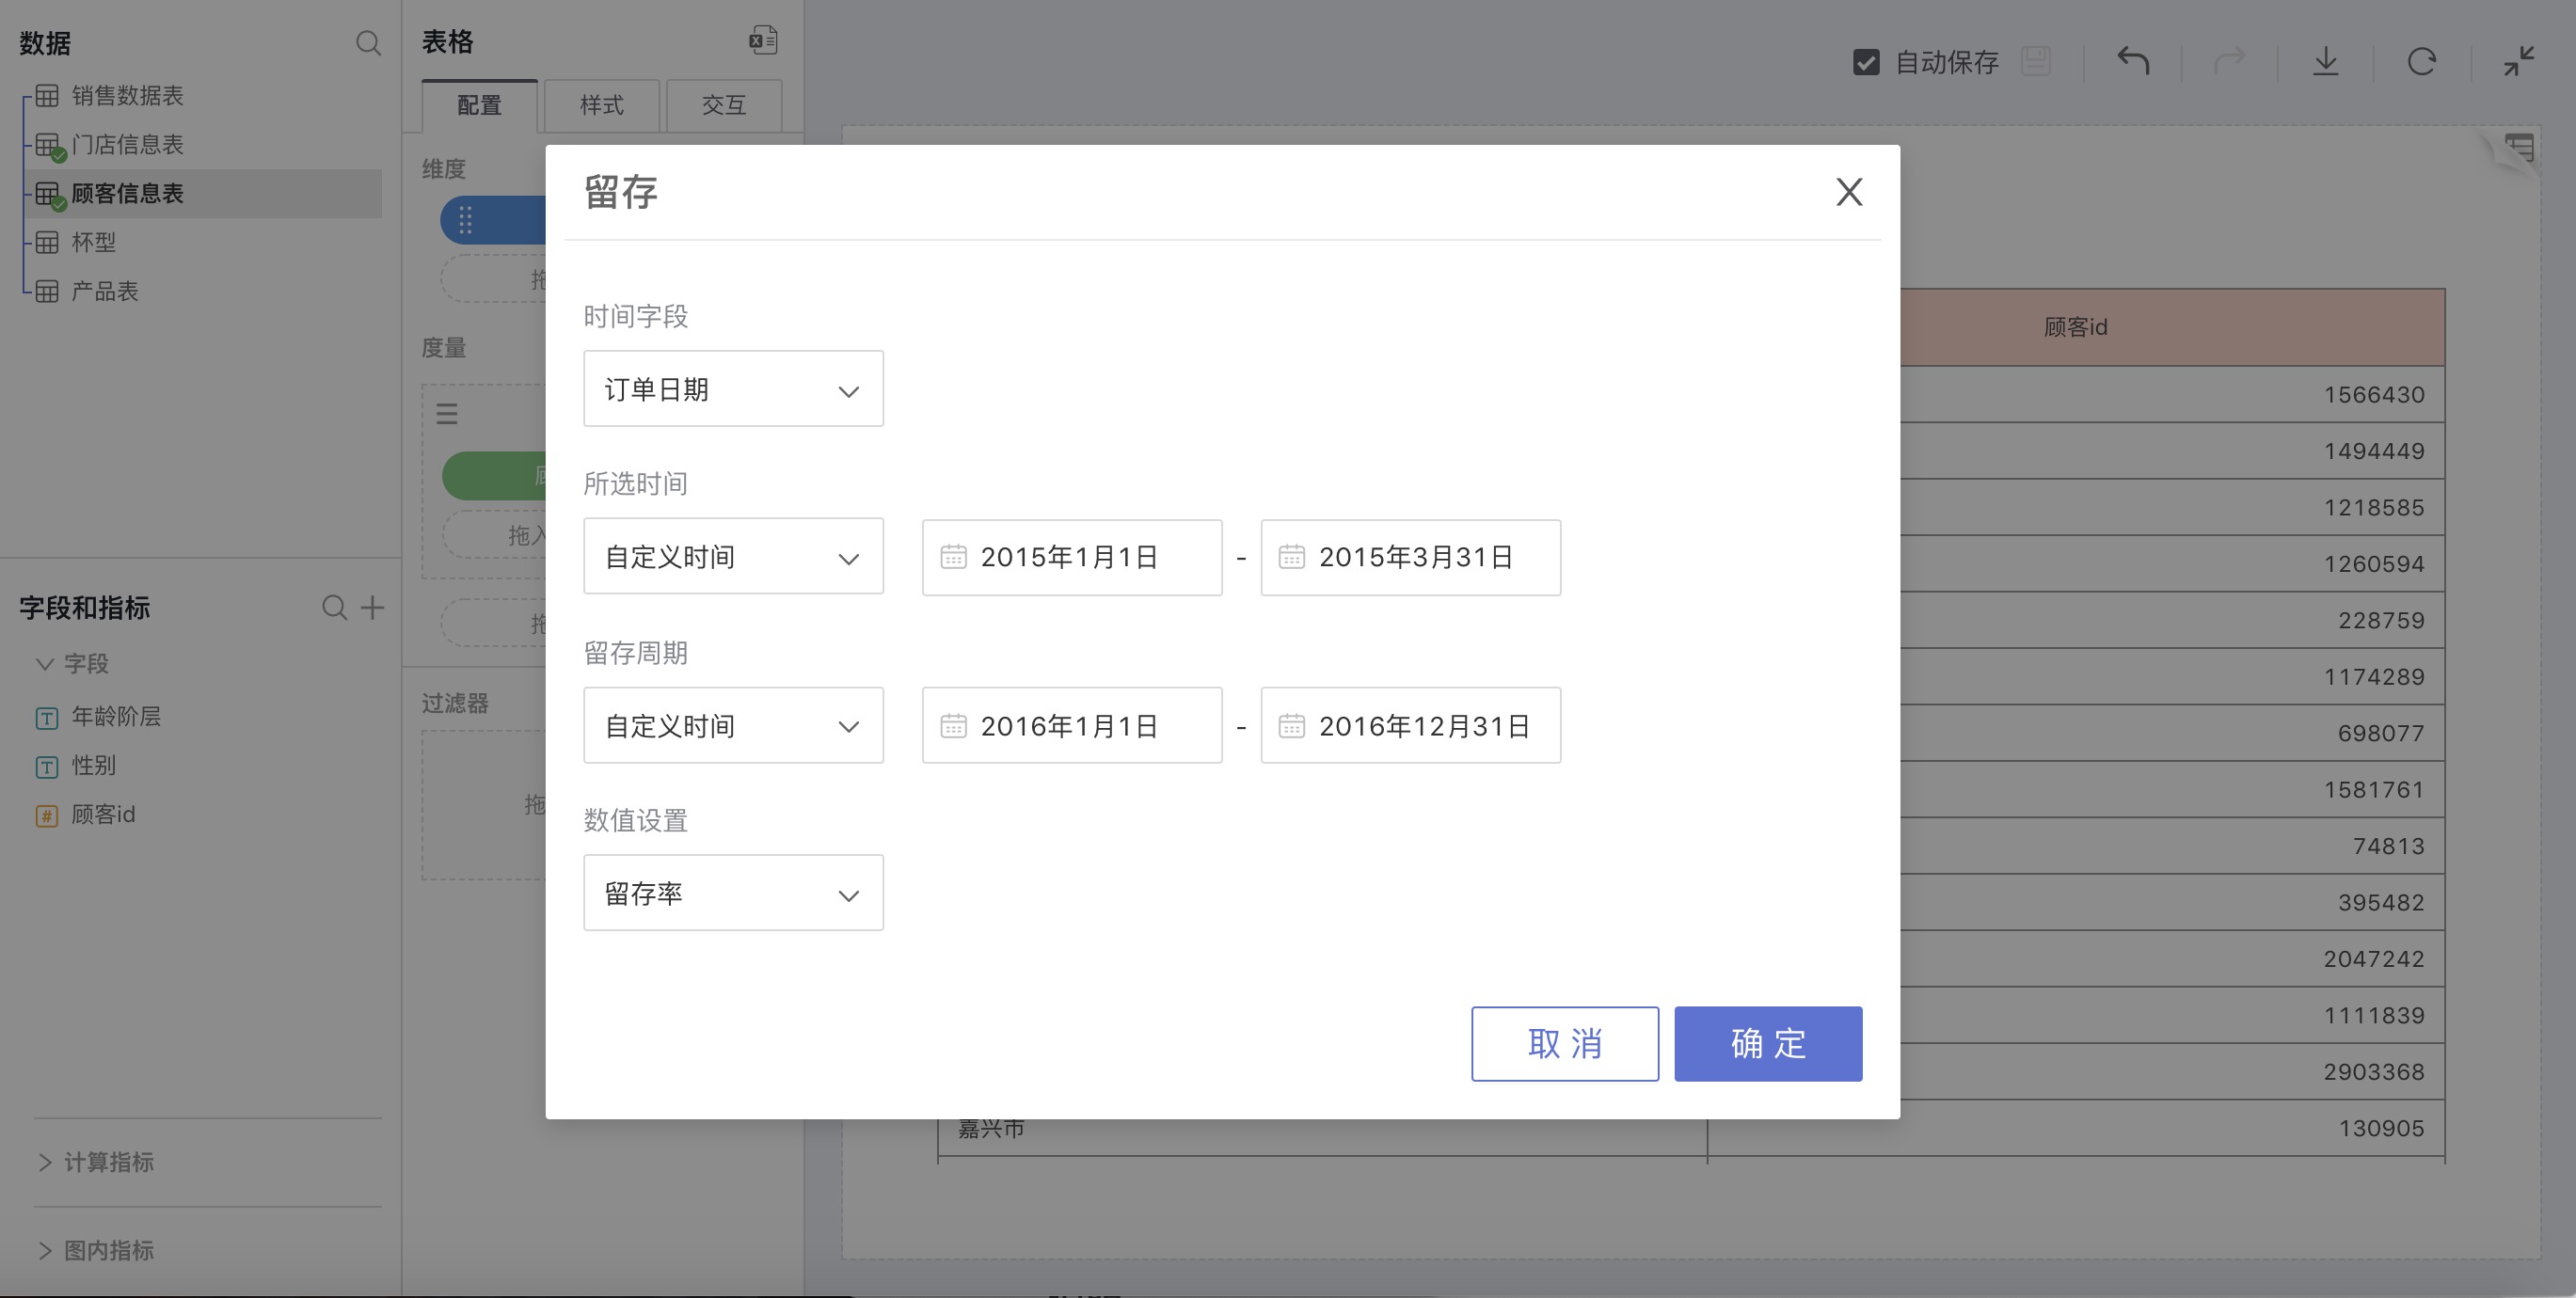
Select Retention in advanced calculation for measures, and a retention rate settings window will pop up for custom settings. You can set retention rate or retention number.

For example: Check the proportion of customers from the first quarter of 2015 who still frequented in 2016:
Active
Explanation
Users who have used the app within a certain period and have previously used the app in a period before that are considered active users.
Limitations: The selected start time must be greater than the end time of the active period. Active calculation is based on users who used a product within the selected time period and have already used the application during the active period if moved back by a certain amount of time. Therefore, if the two periods overlap, the calculated active rate is 100 percent and has no business meaning.
How to Use
Select Active in advanced calculation for measures, and an active settings window will pop up for custom settings. You can set active rate or active number.
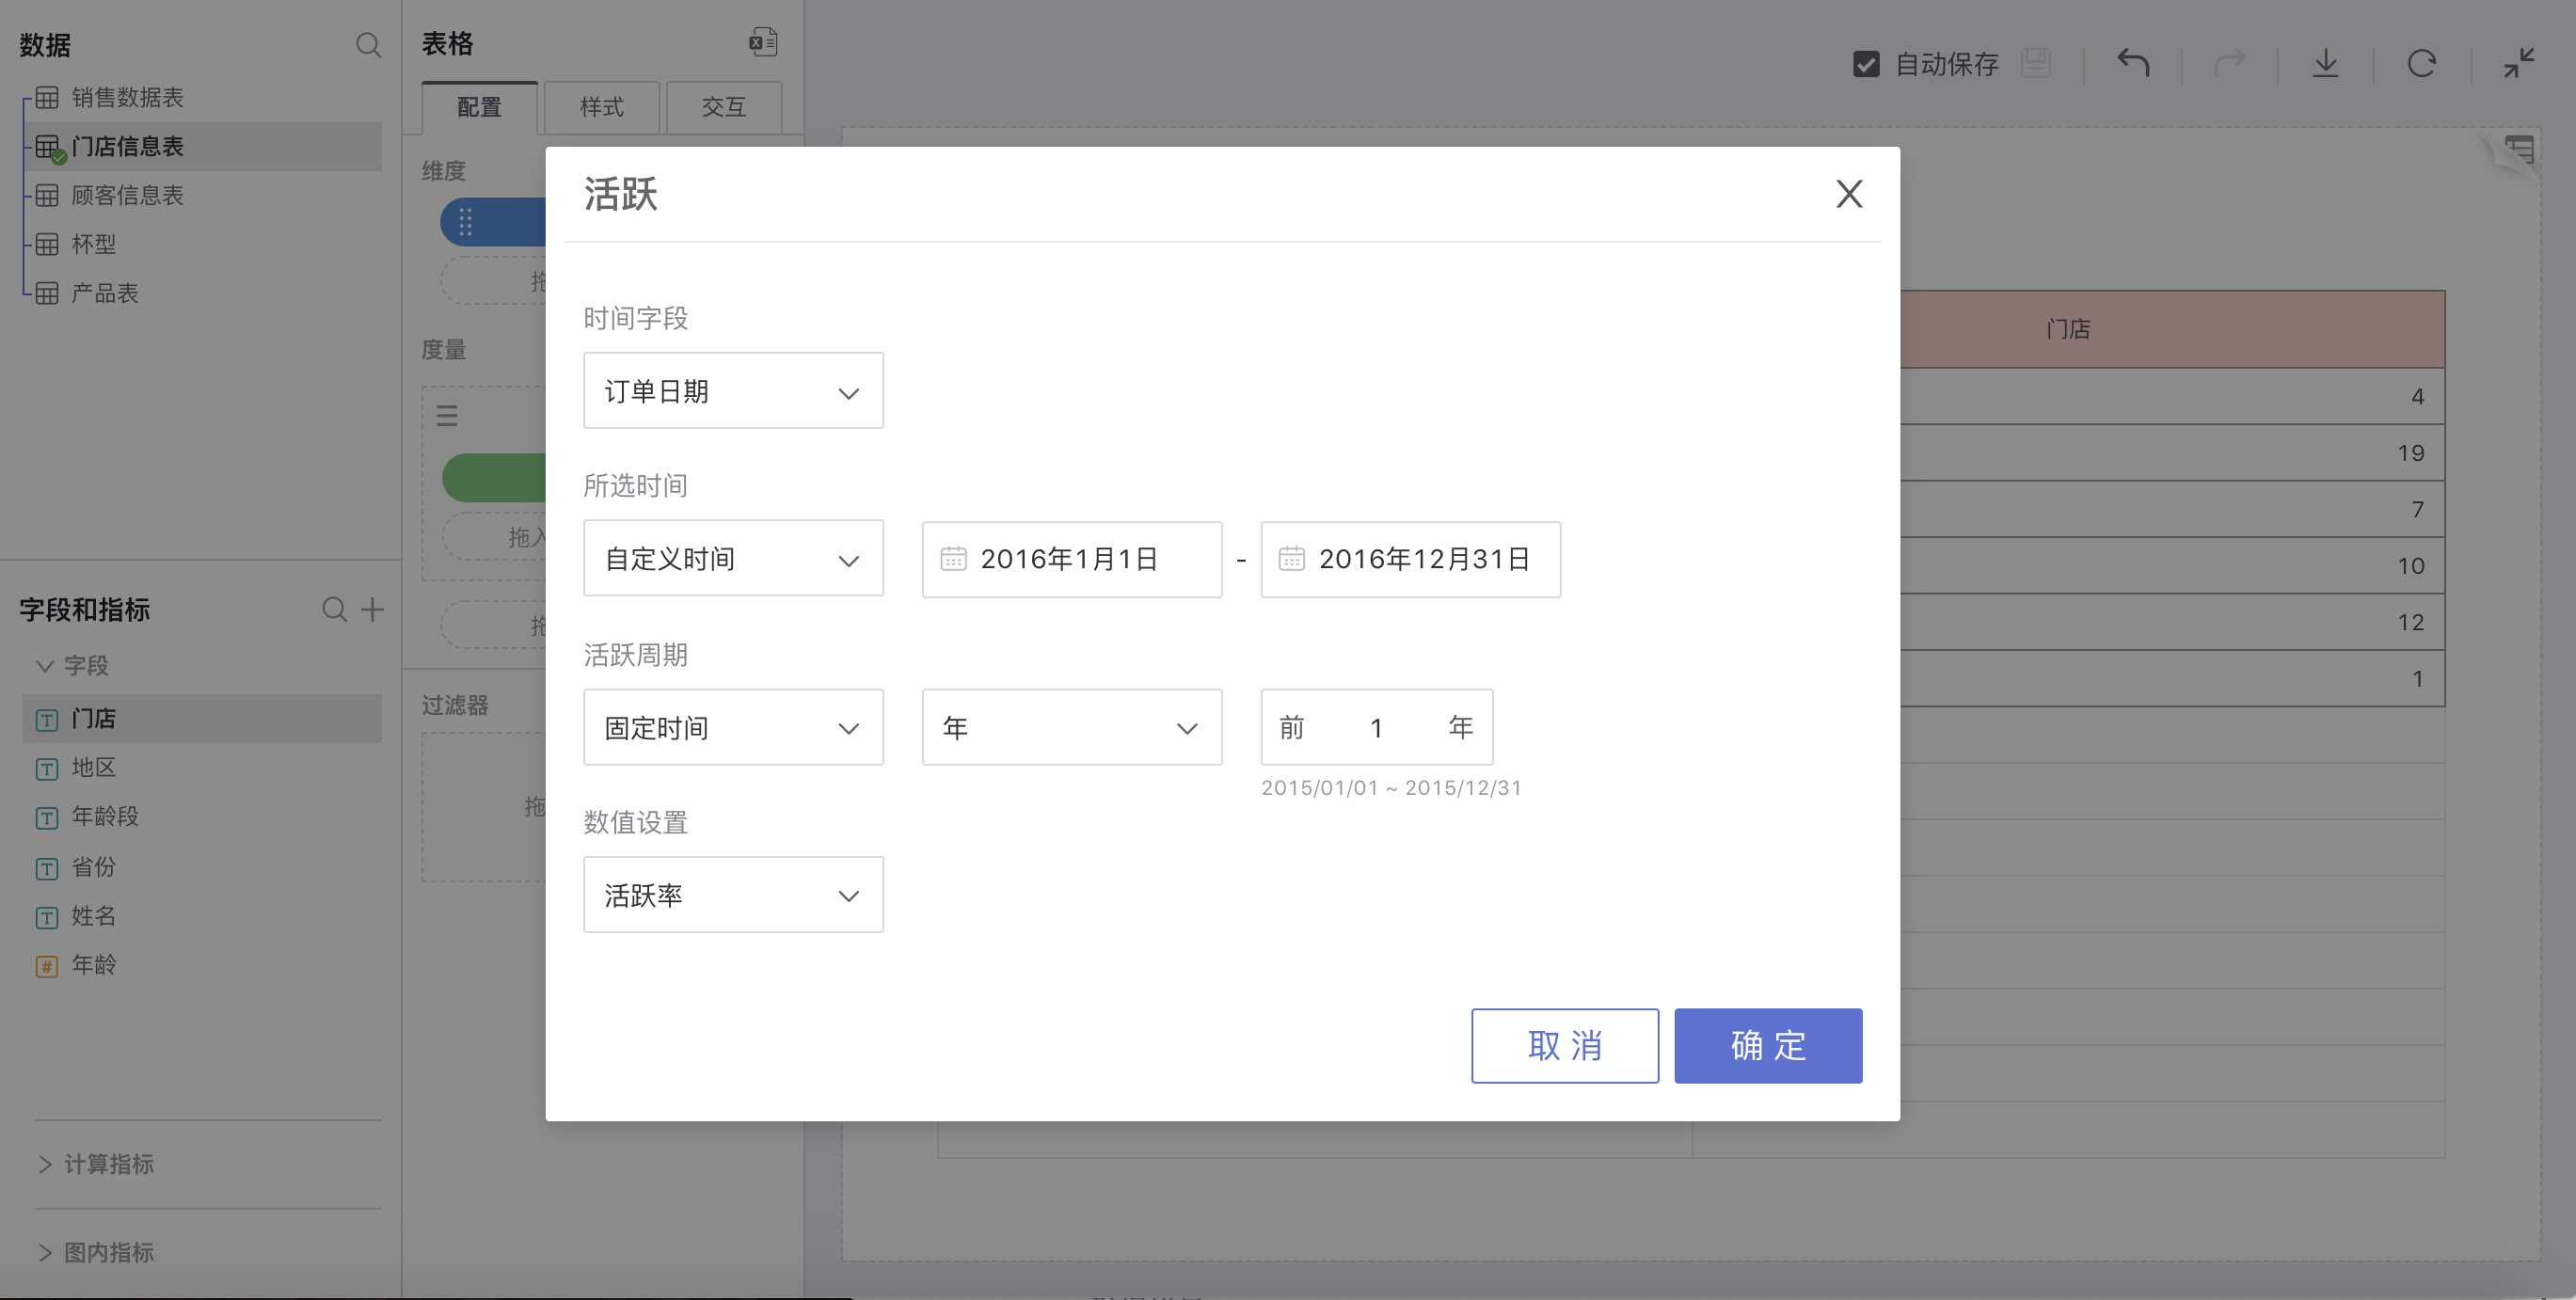
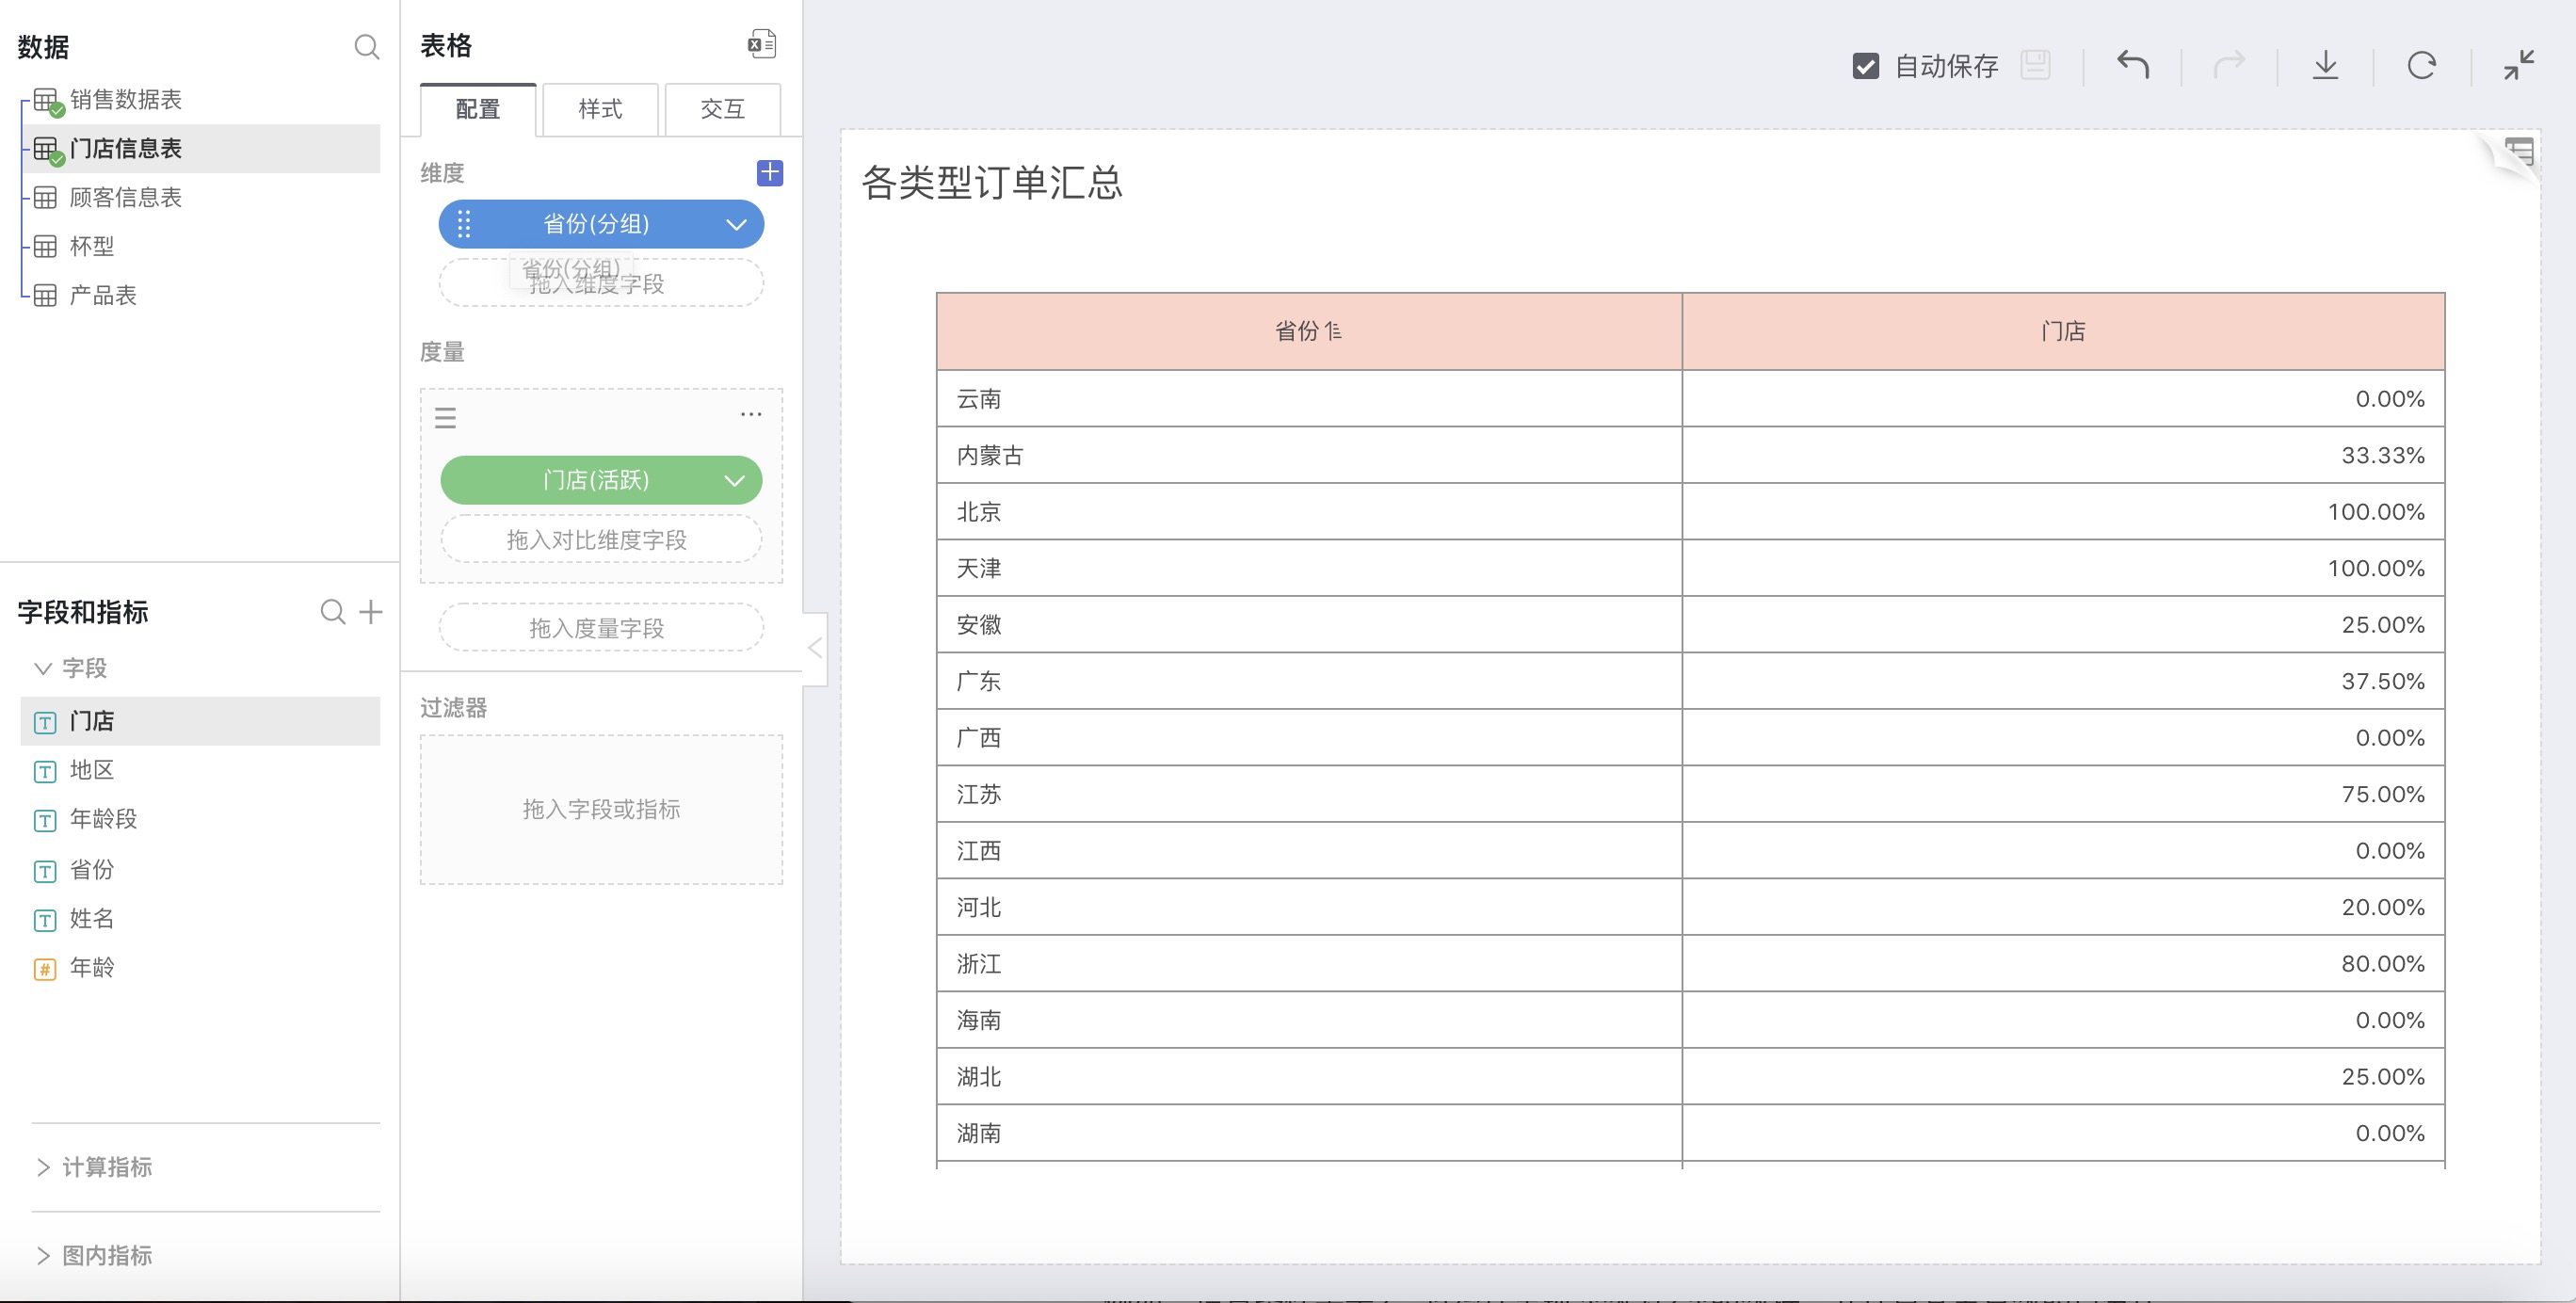
For example: Check the proportion of 2016 customers who had appeared in the previous year
Set up as shown in the picture above. In Yunnan Province, Guangxi Province, Hainan Province, and Hunan Province, all customers in 2016 were new customers; in Beijing and Tianjin, all customers in 2016 were old customers from 2015, with no new customers.
Repeat
Explanation
Calculate Repeat Rate by Conditions
Calculating the repeat rate according to the set conditions means counting the repeated values that meet the conditions.
For example: If the condition is set to 2, it will count the data that appears twice and calculate its percentage of the total.
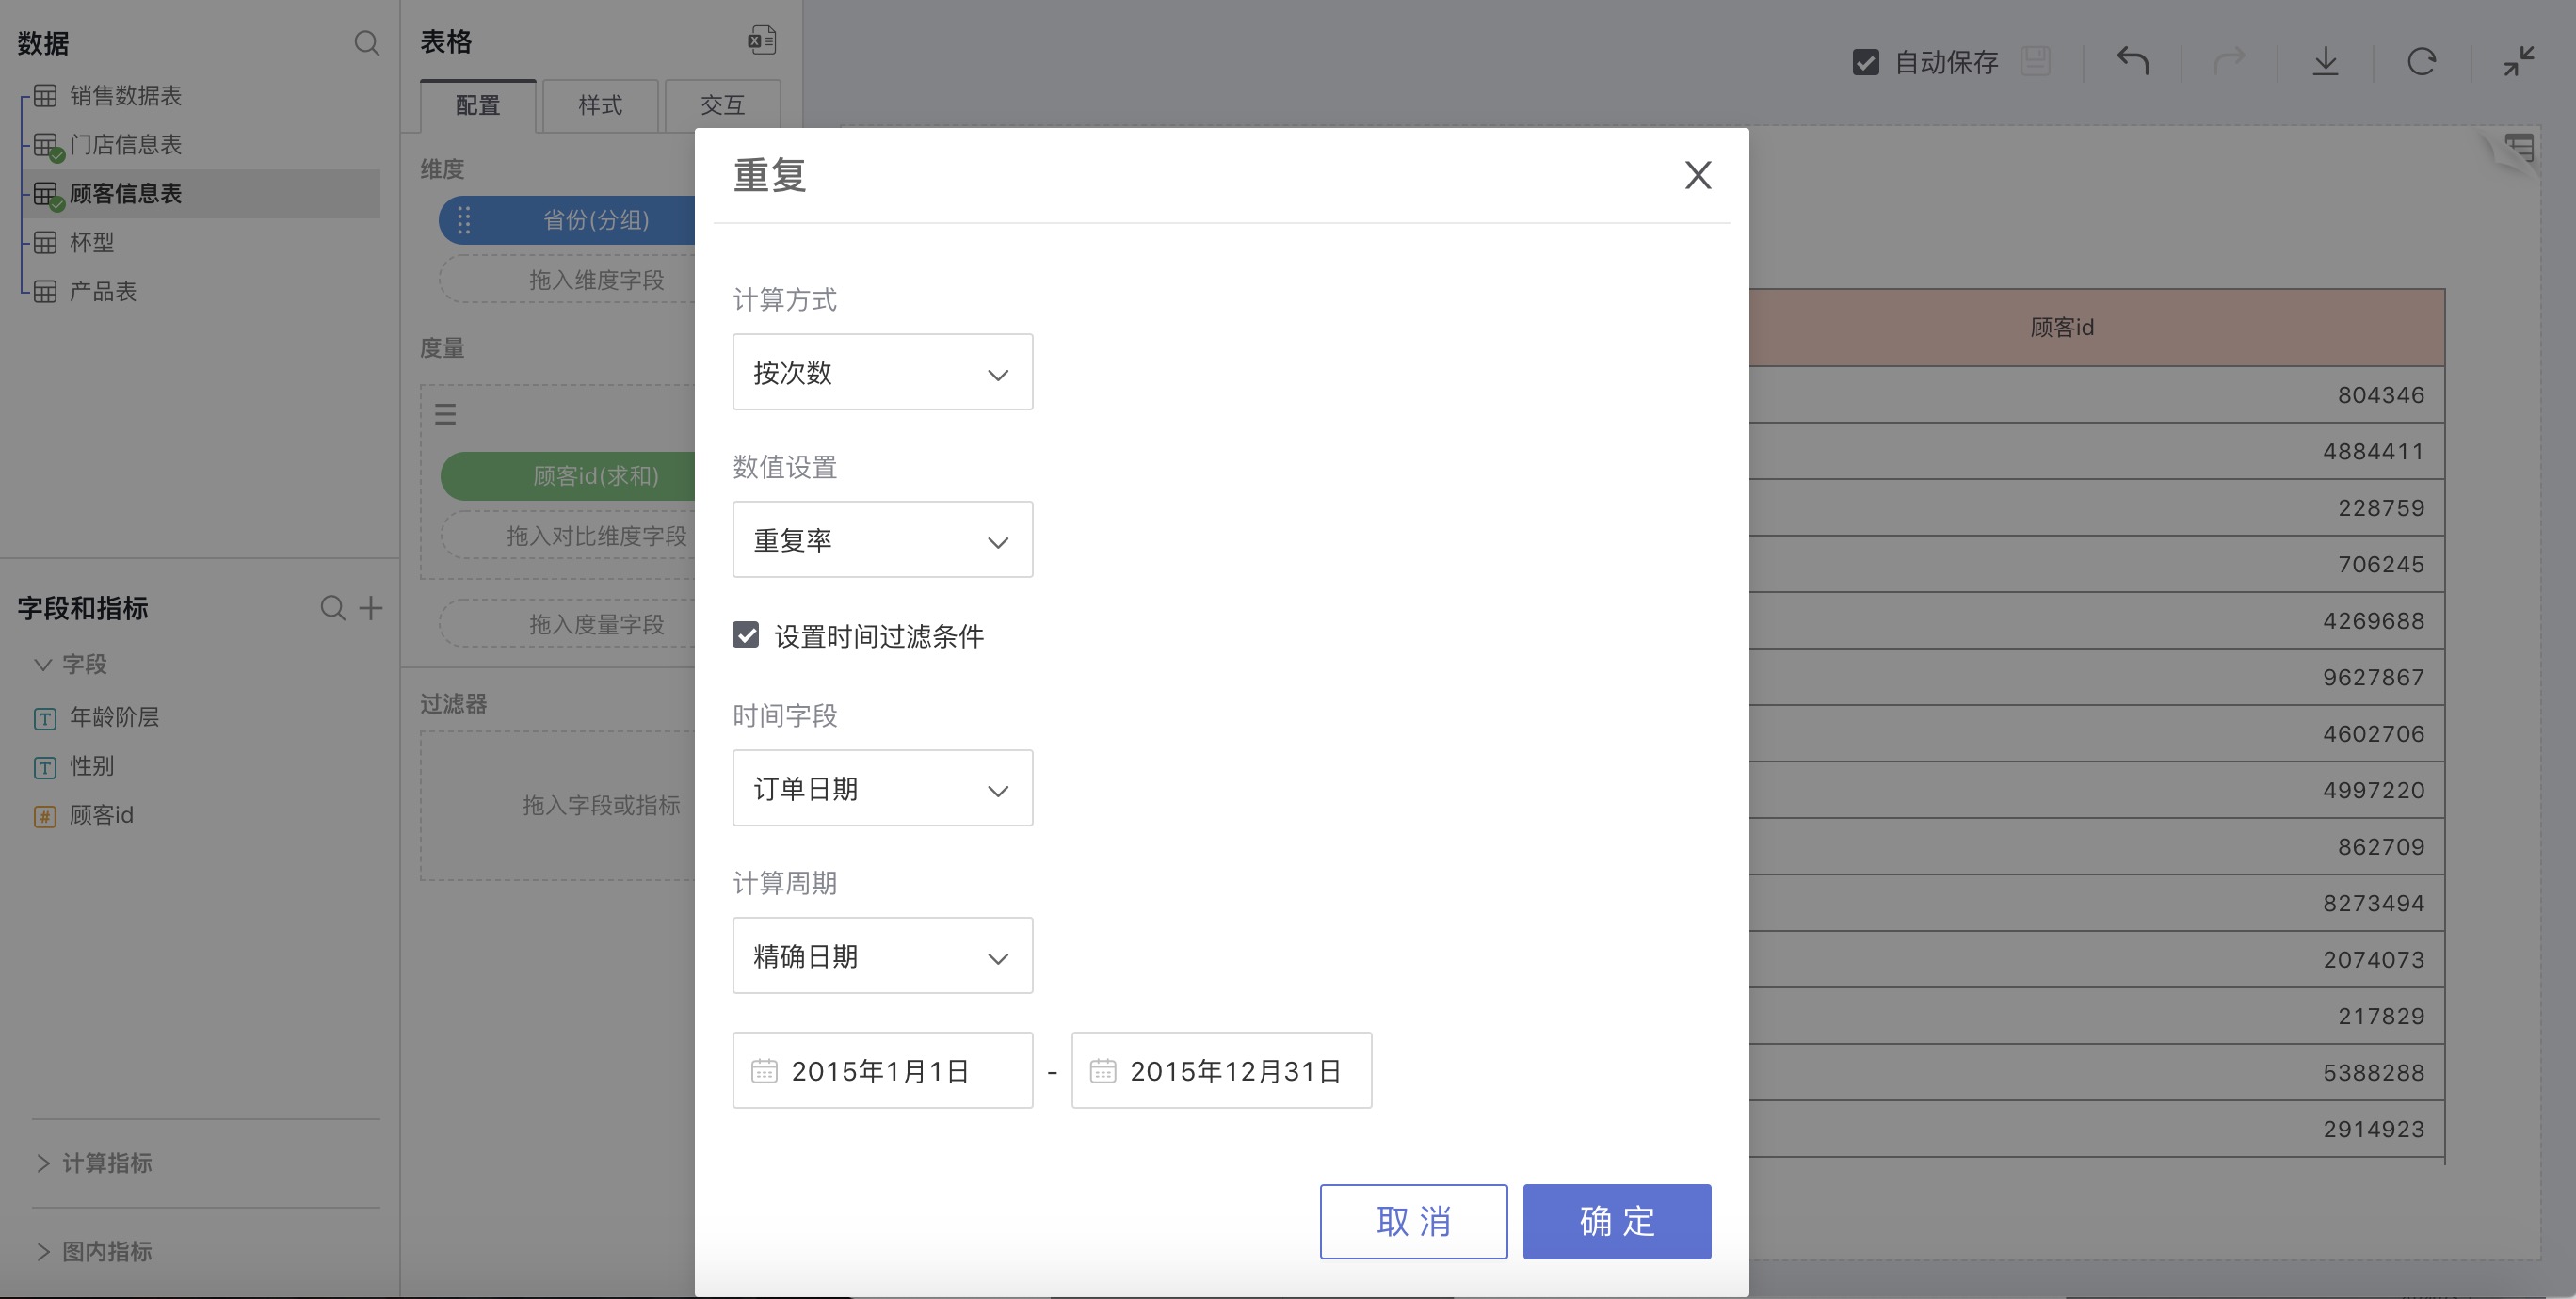
Calculate Repeat Rate by Frequency
Calculating the repeat rate by frequency means tallying all repeated items and summarizing the number of repetitions.
For example: If item A appears twice and item B appears three times, then the number of repeats is 2 + 3 = 5 times.
How to Use
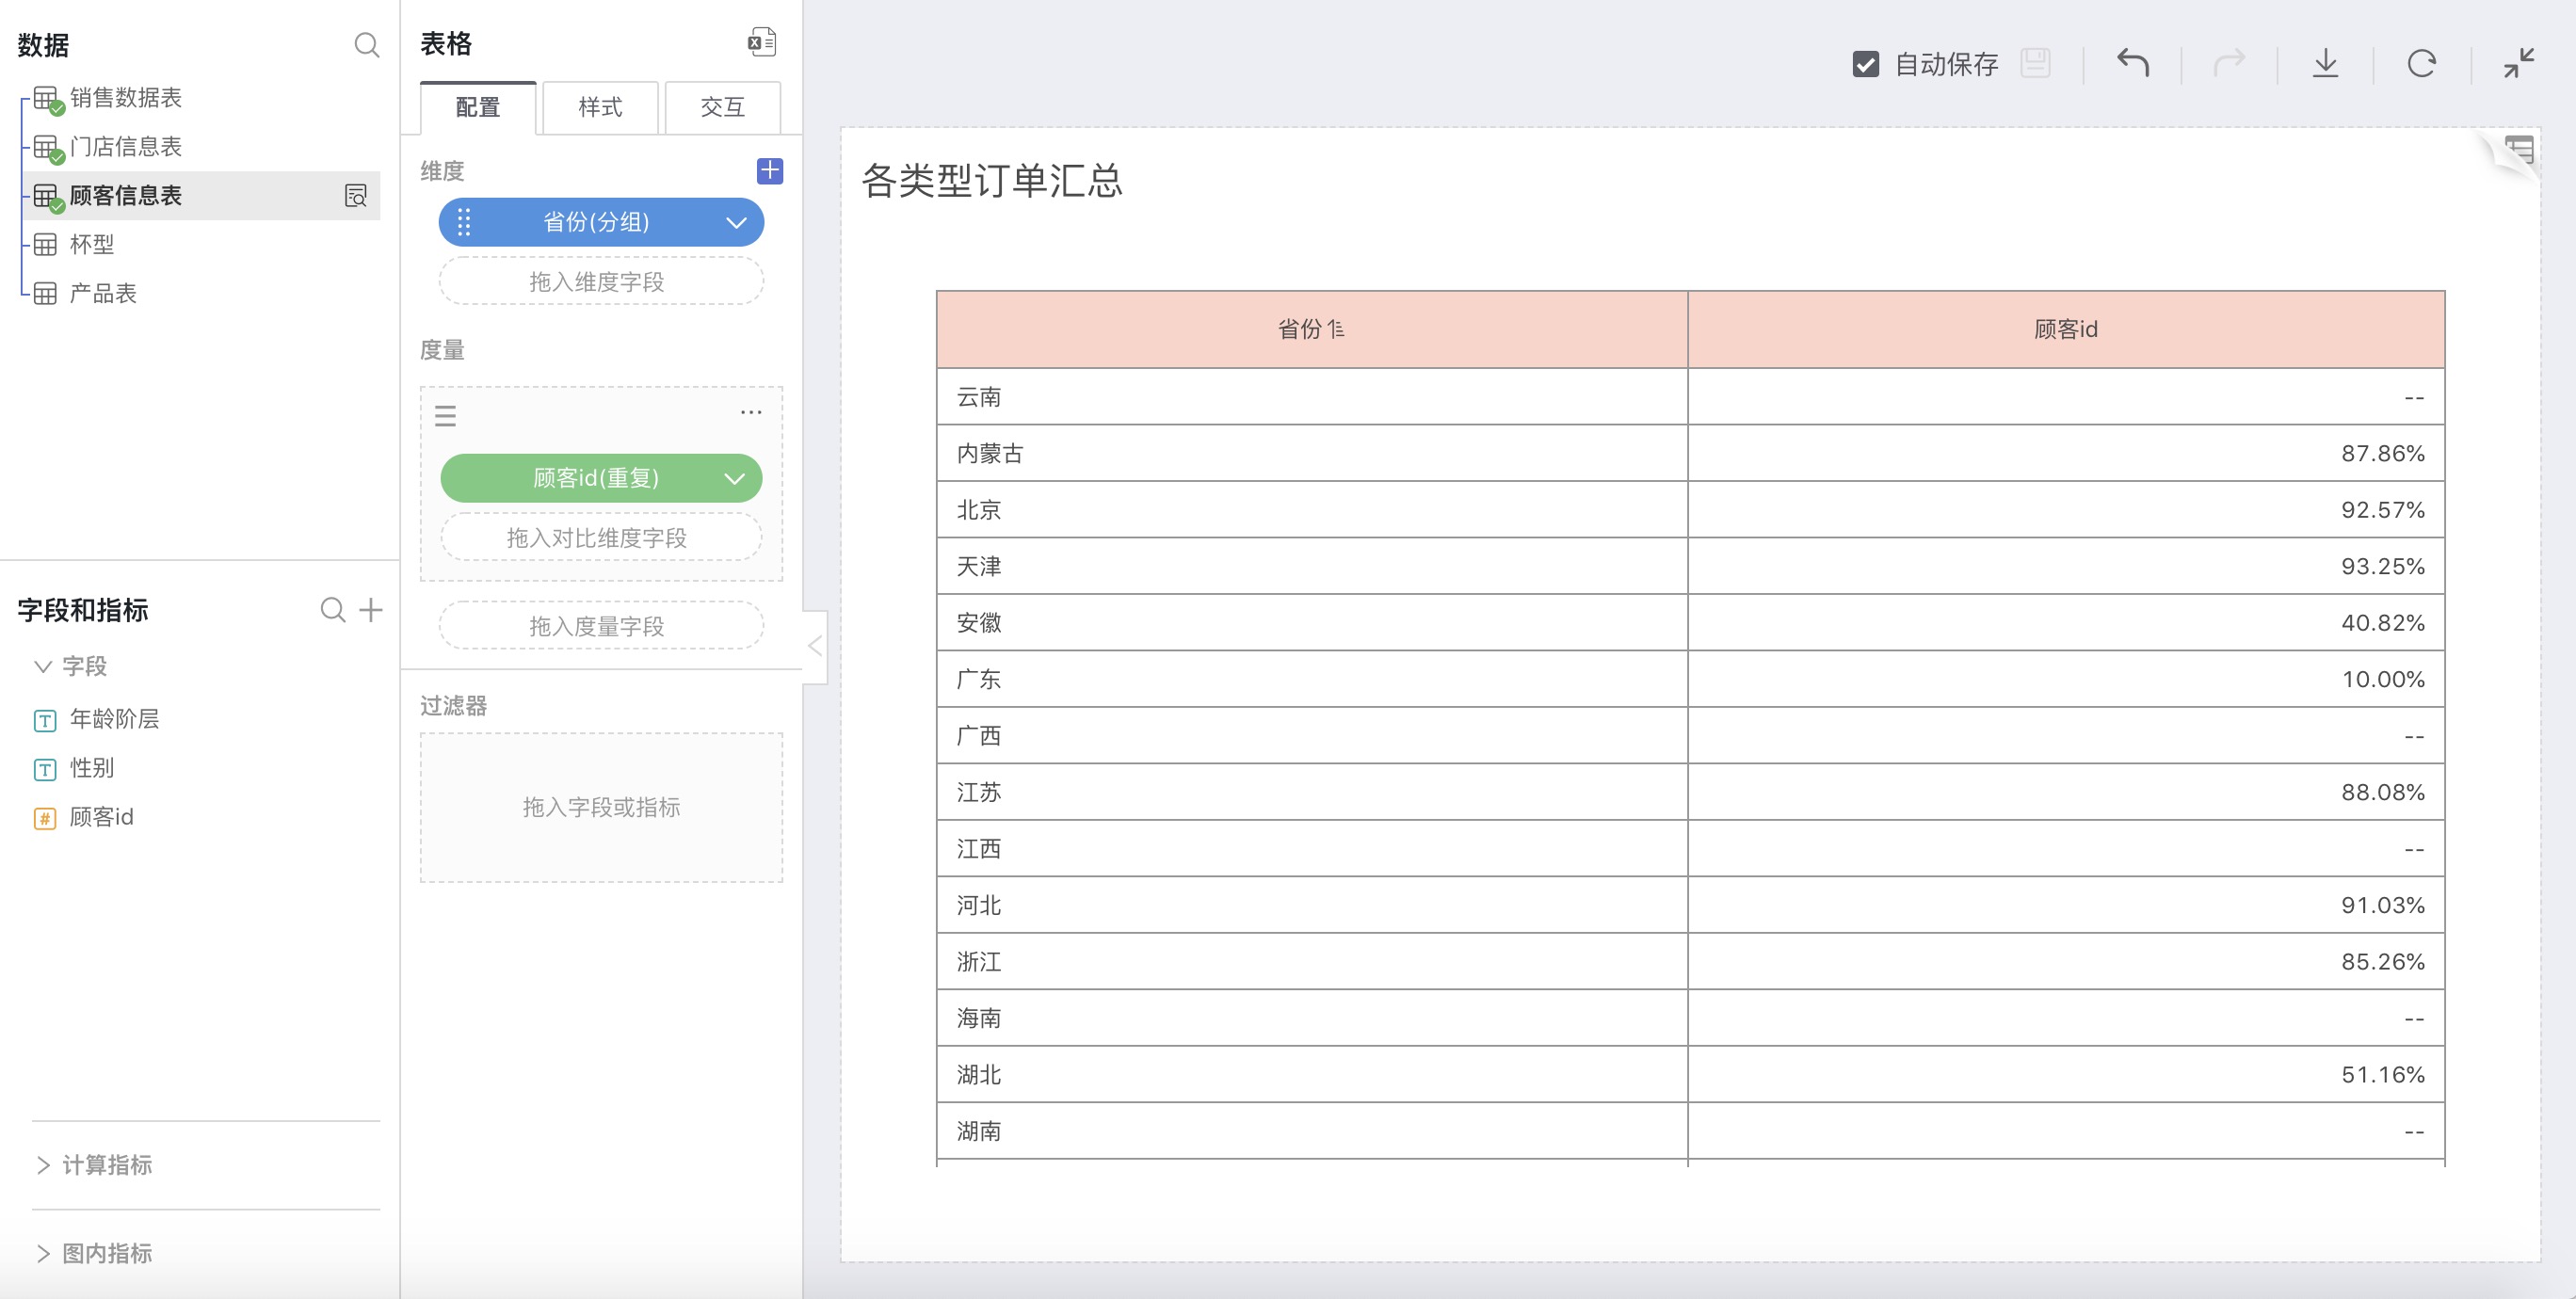
Select Repeat in advanced calculation for measures, and a retention rate settings window will pop up for custom settings. You can set repeat rate or repeat number.
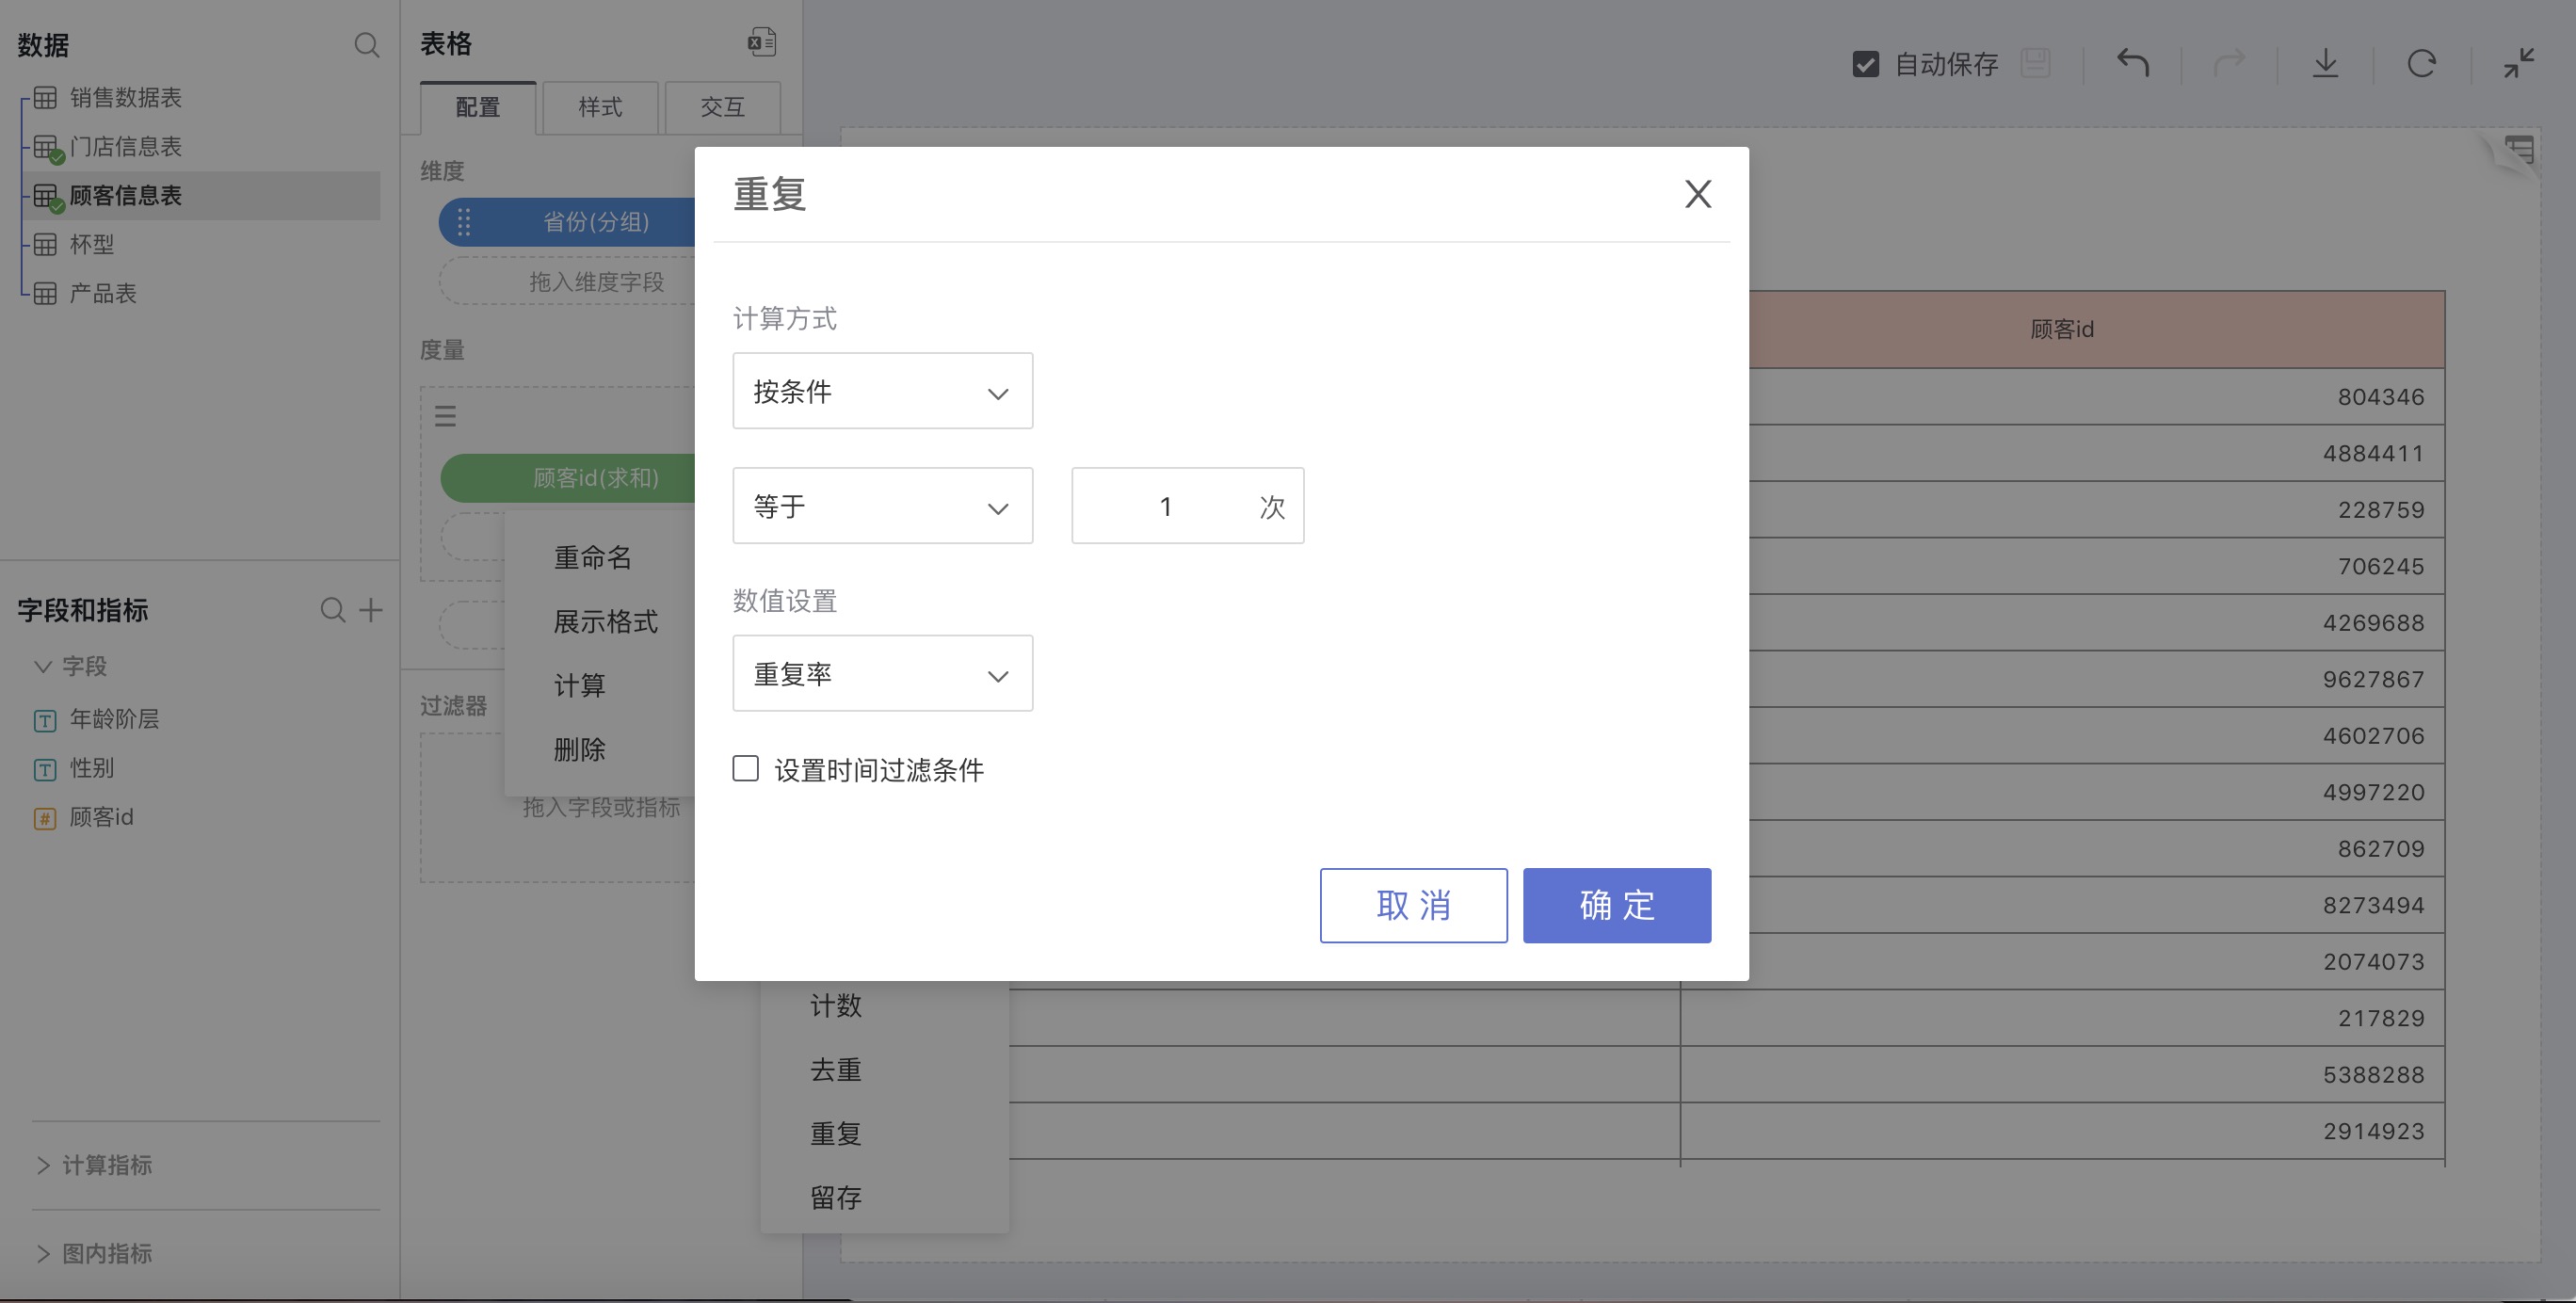
For example: The repeat rate of customers from different provinces in 2015
Moving Calculation
Explanation
Based on a time series, shift sequentially, and perform statistics on a certain number of items (Sum, Average, Min, Max – a total of 4 count methods).
How to Use
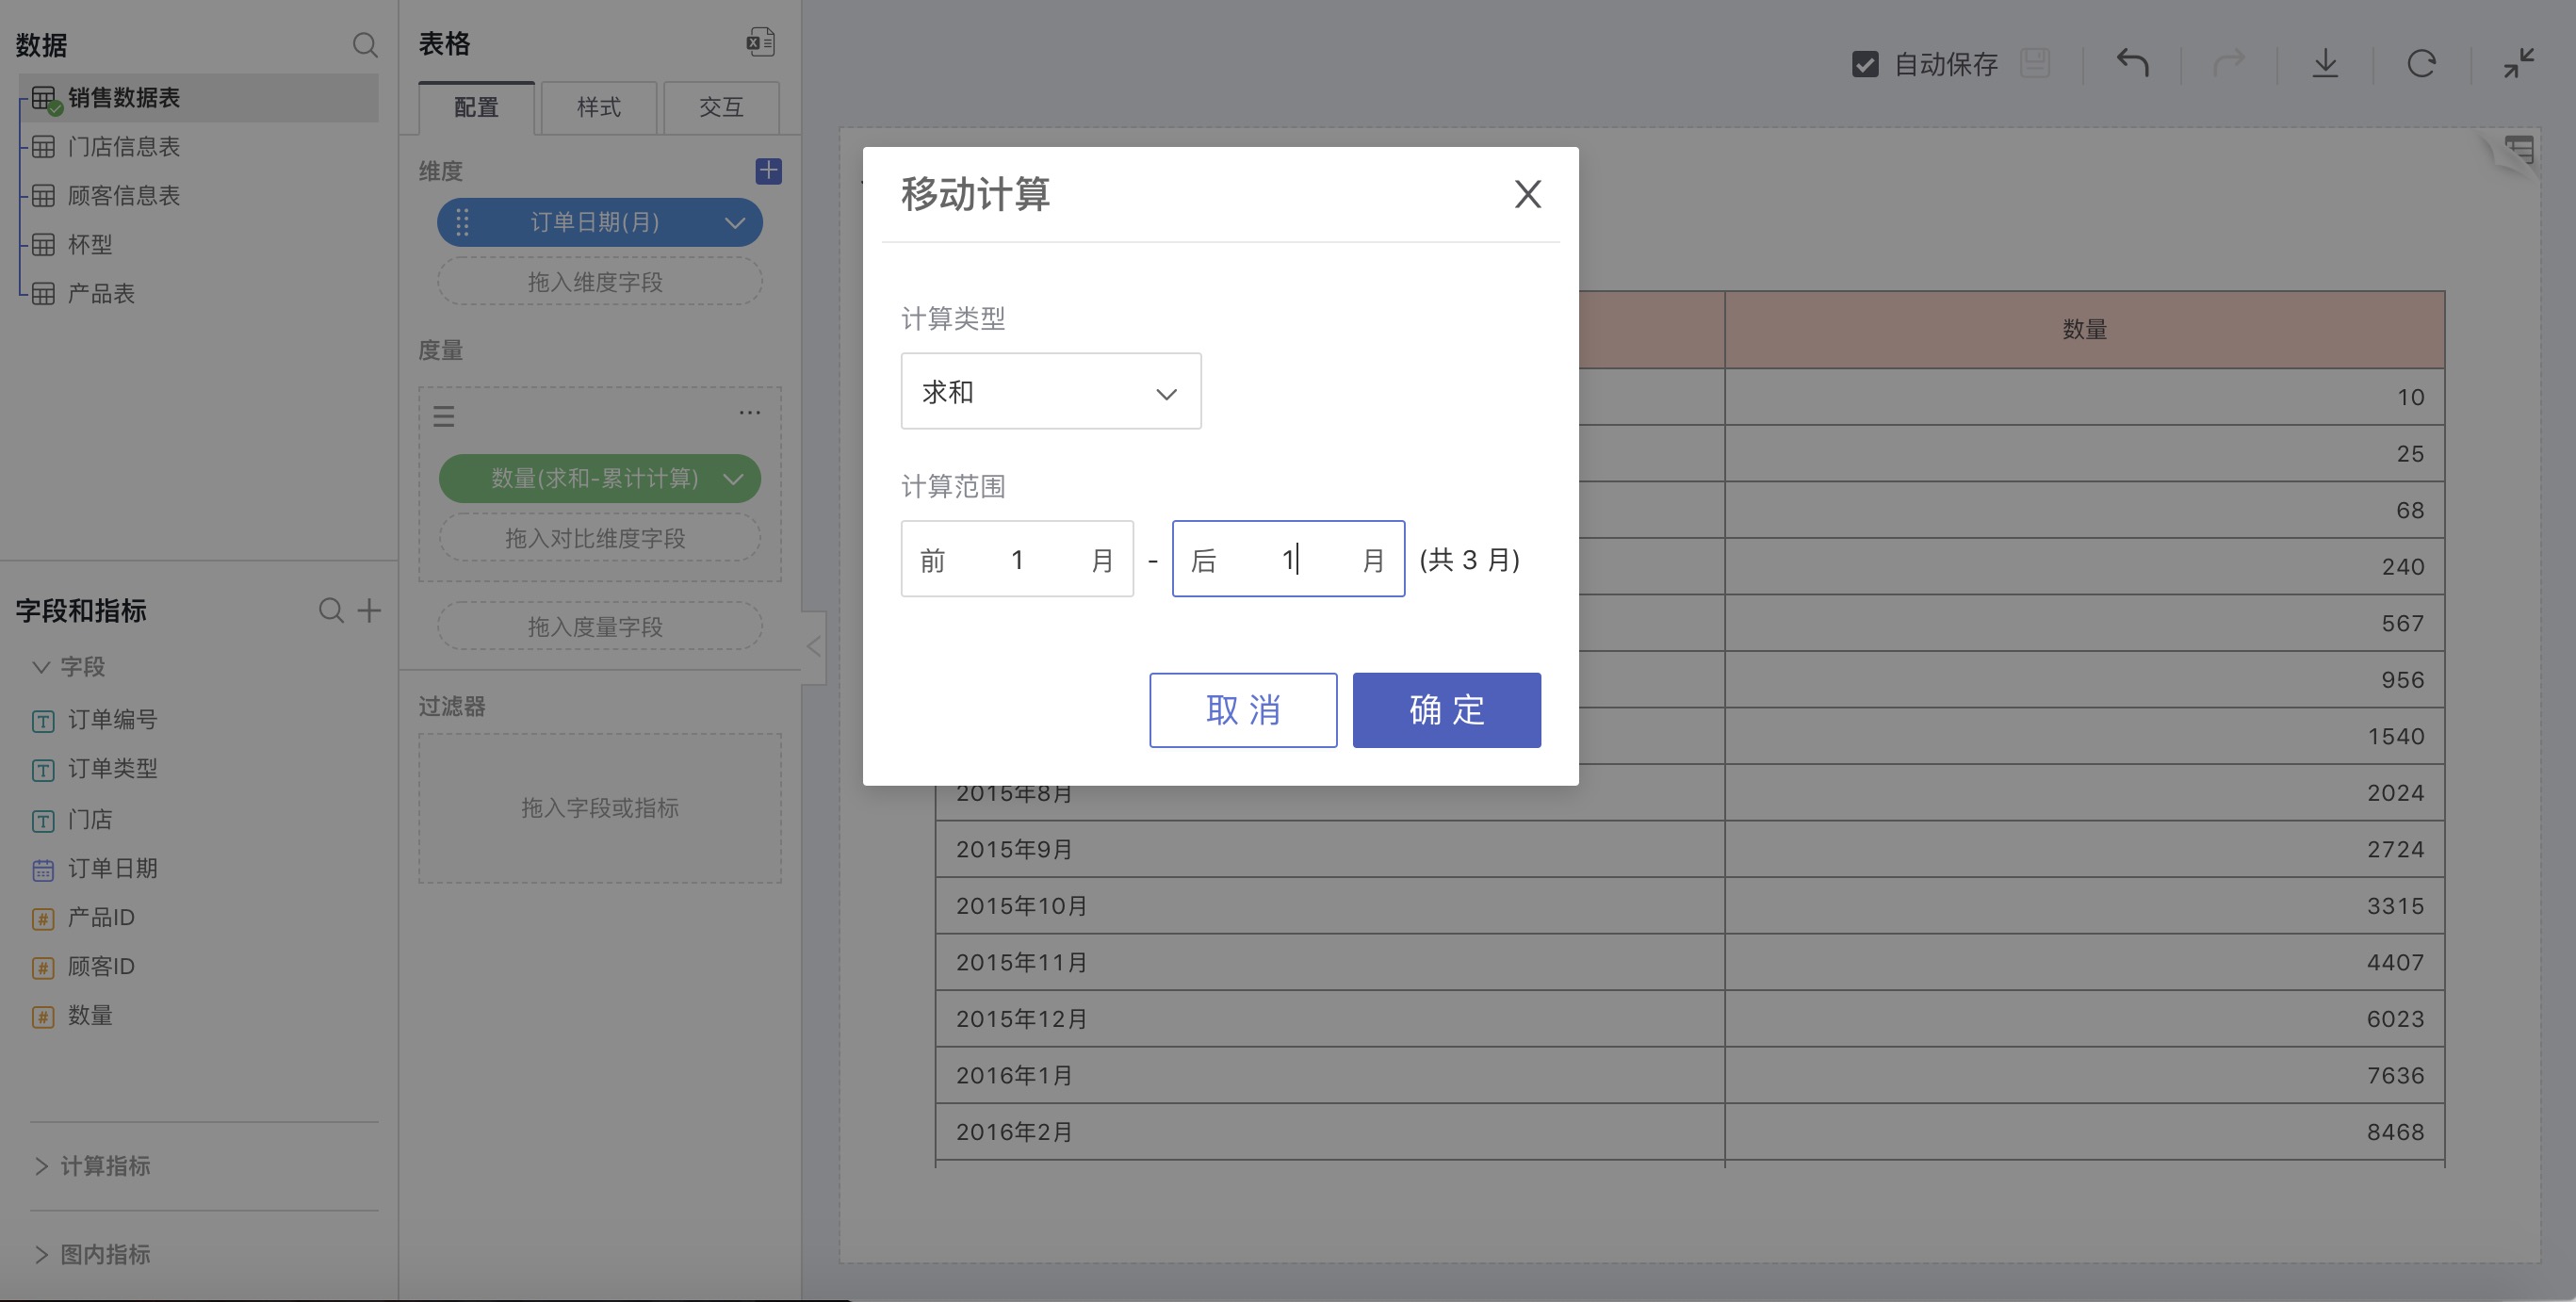
Choose a date field for dimensions, select Moving Calculation in the advanced calculation for measures, and in the pop-up window for Moving Calculation, make custom settings.
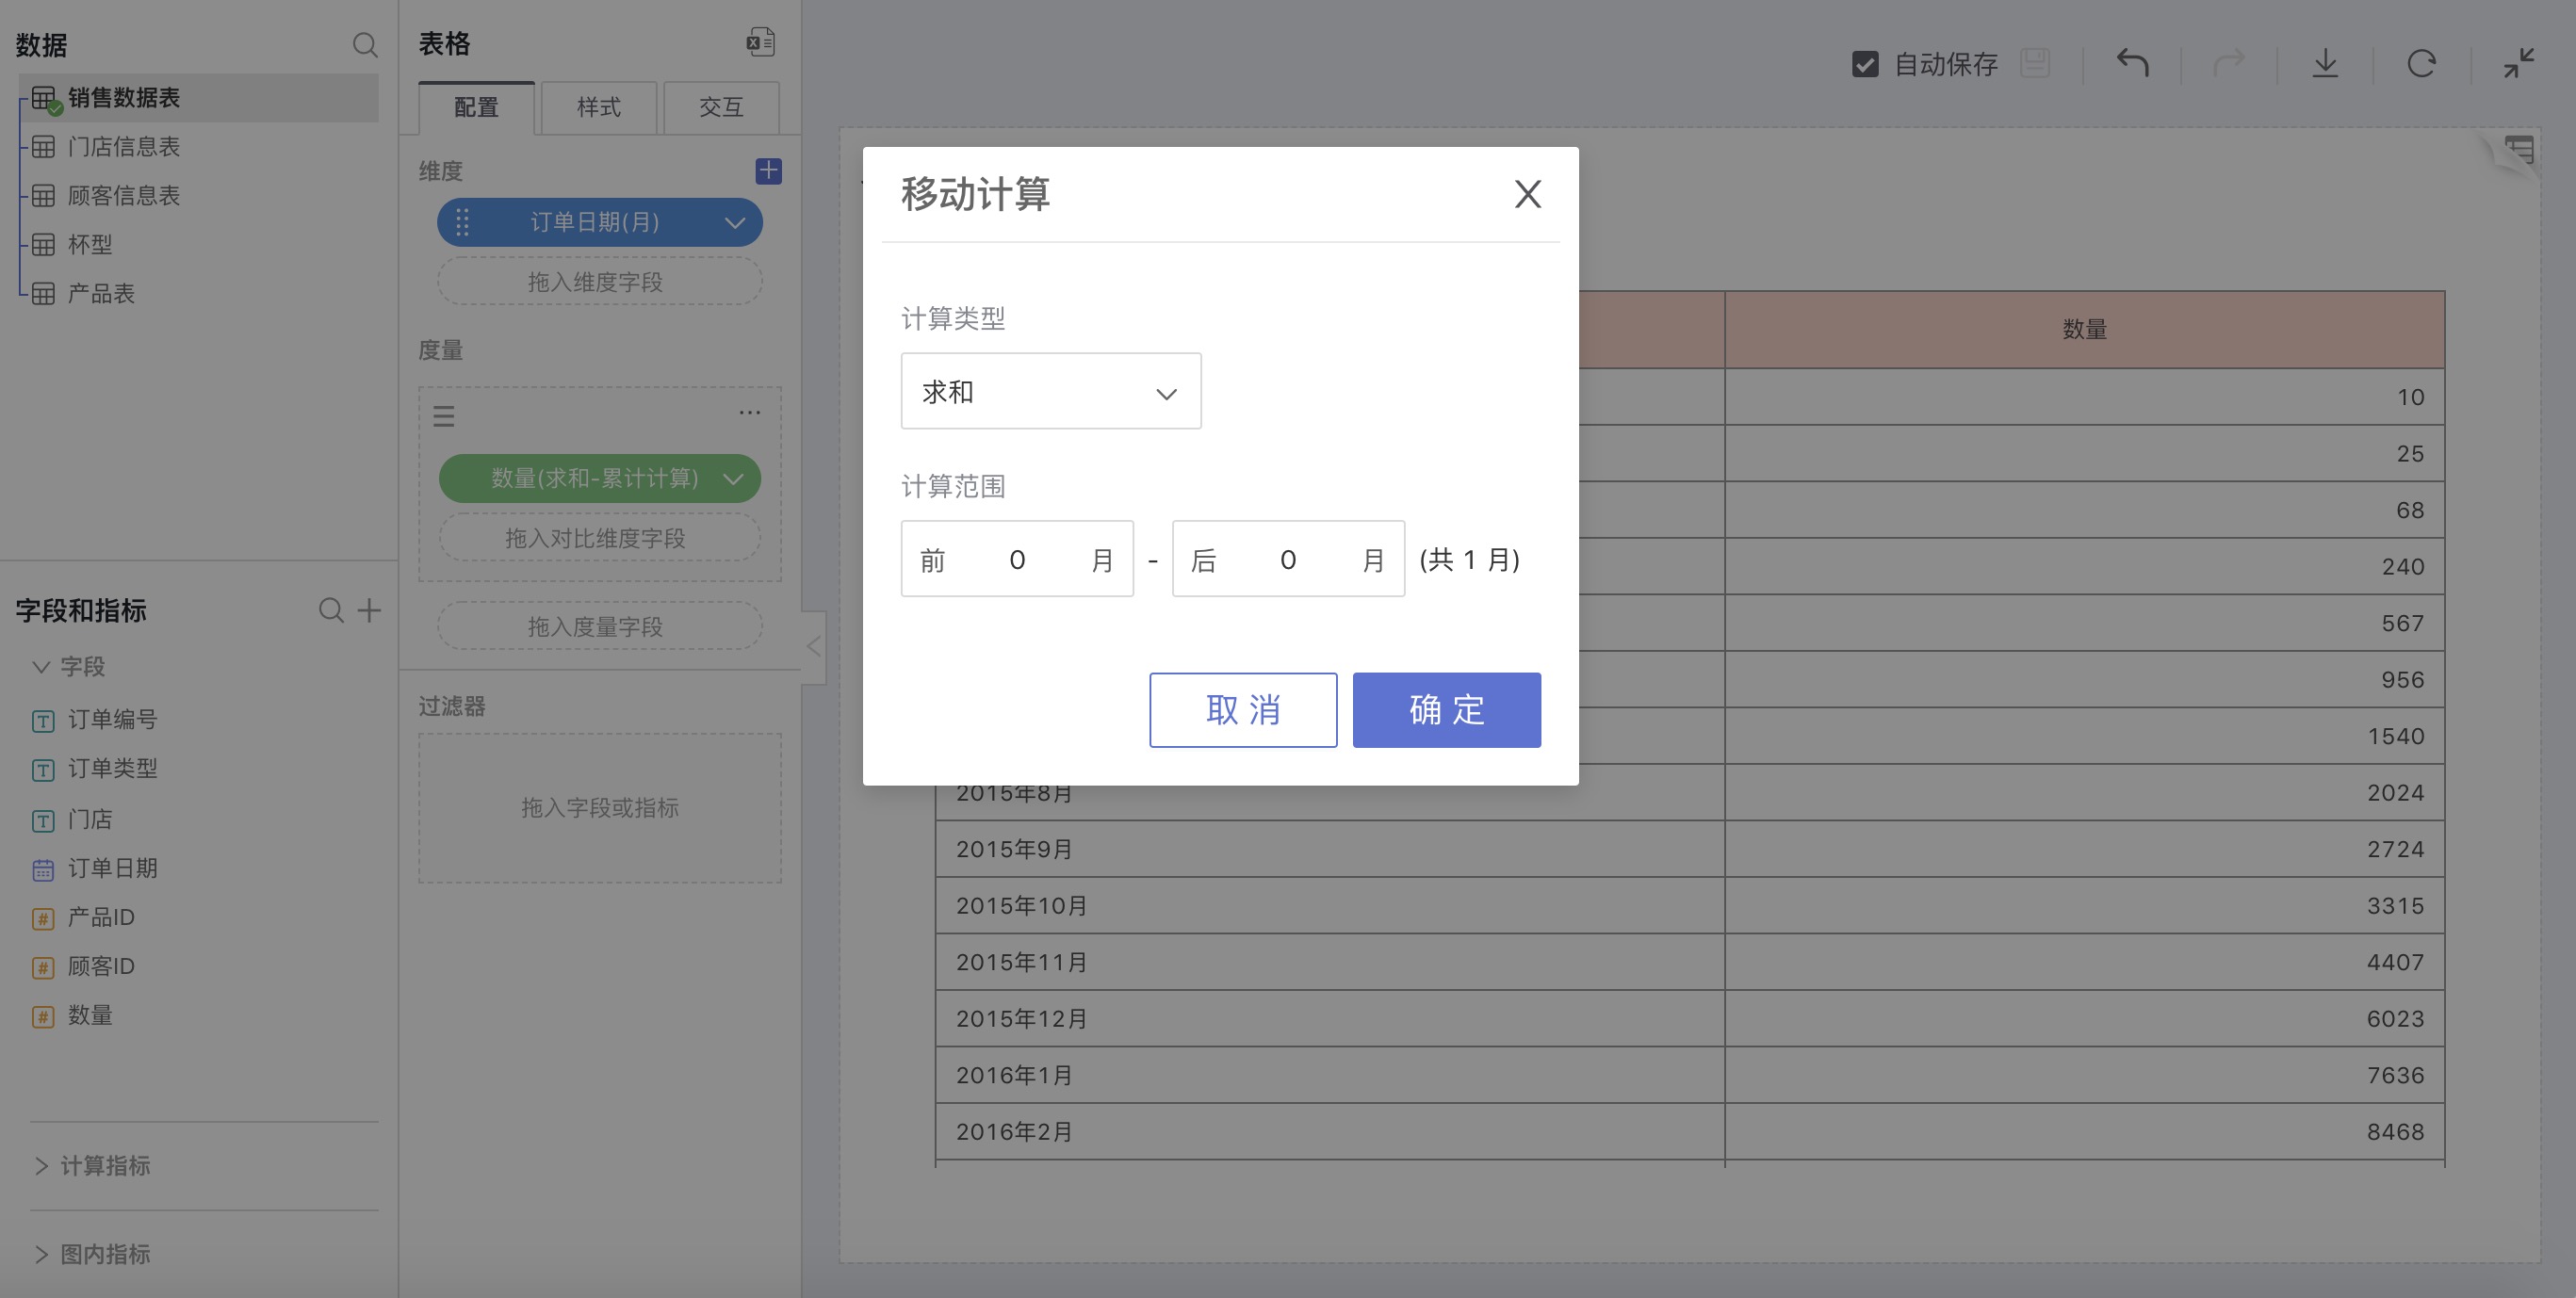
For example: According to the order date, calculate the sum of sales quantities within a range of one month to the left and right of each month.
Cumulative Calculation
Explanation
Calculate statistics for all data within the entire time range (including Sum, Average, Min, Max – a total of 4 cumulative methods).
How to Use
Choose a date field for dimensions, select Cumulative Calculation in the advanced calculation for measures. In the pop-up cumulative calculation settings window, make custom settings.
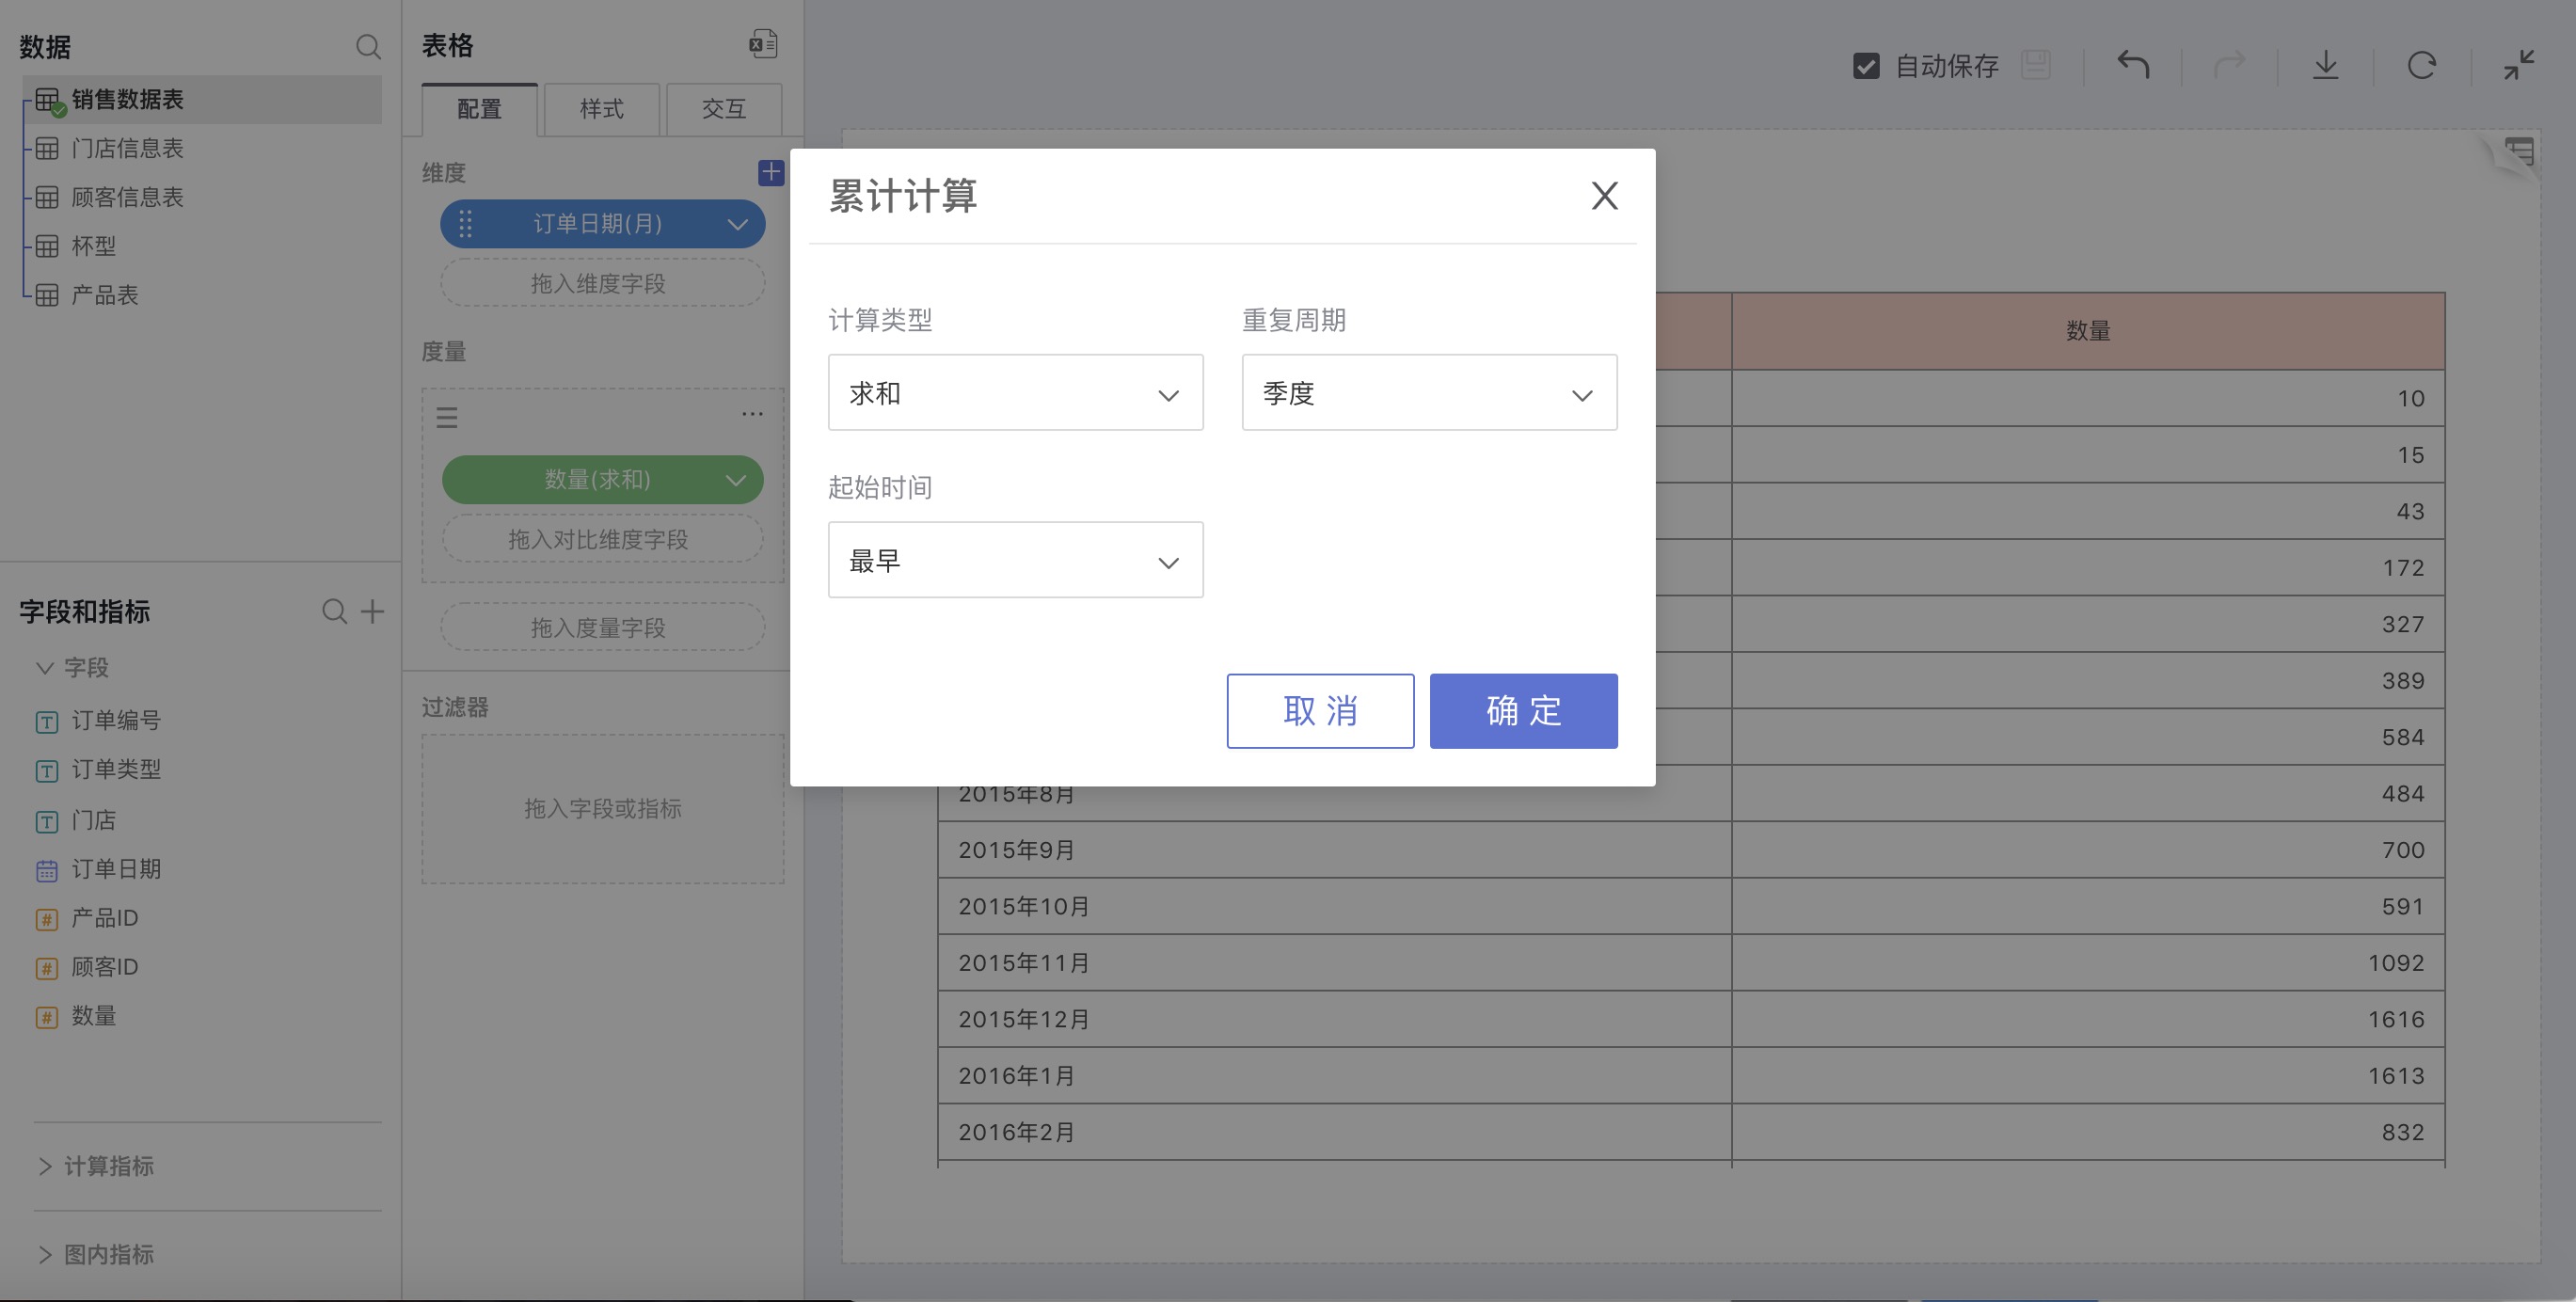
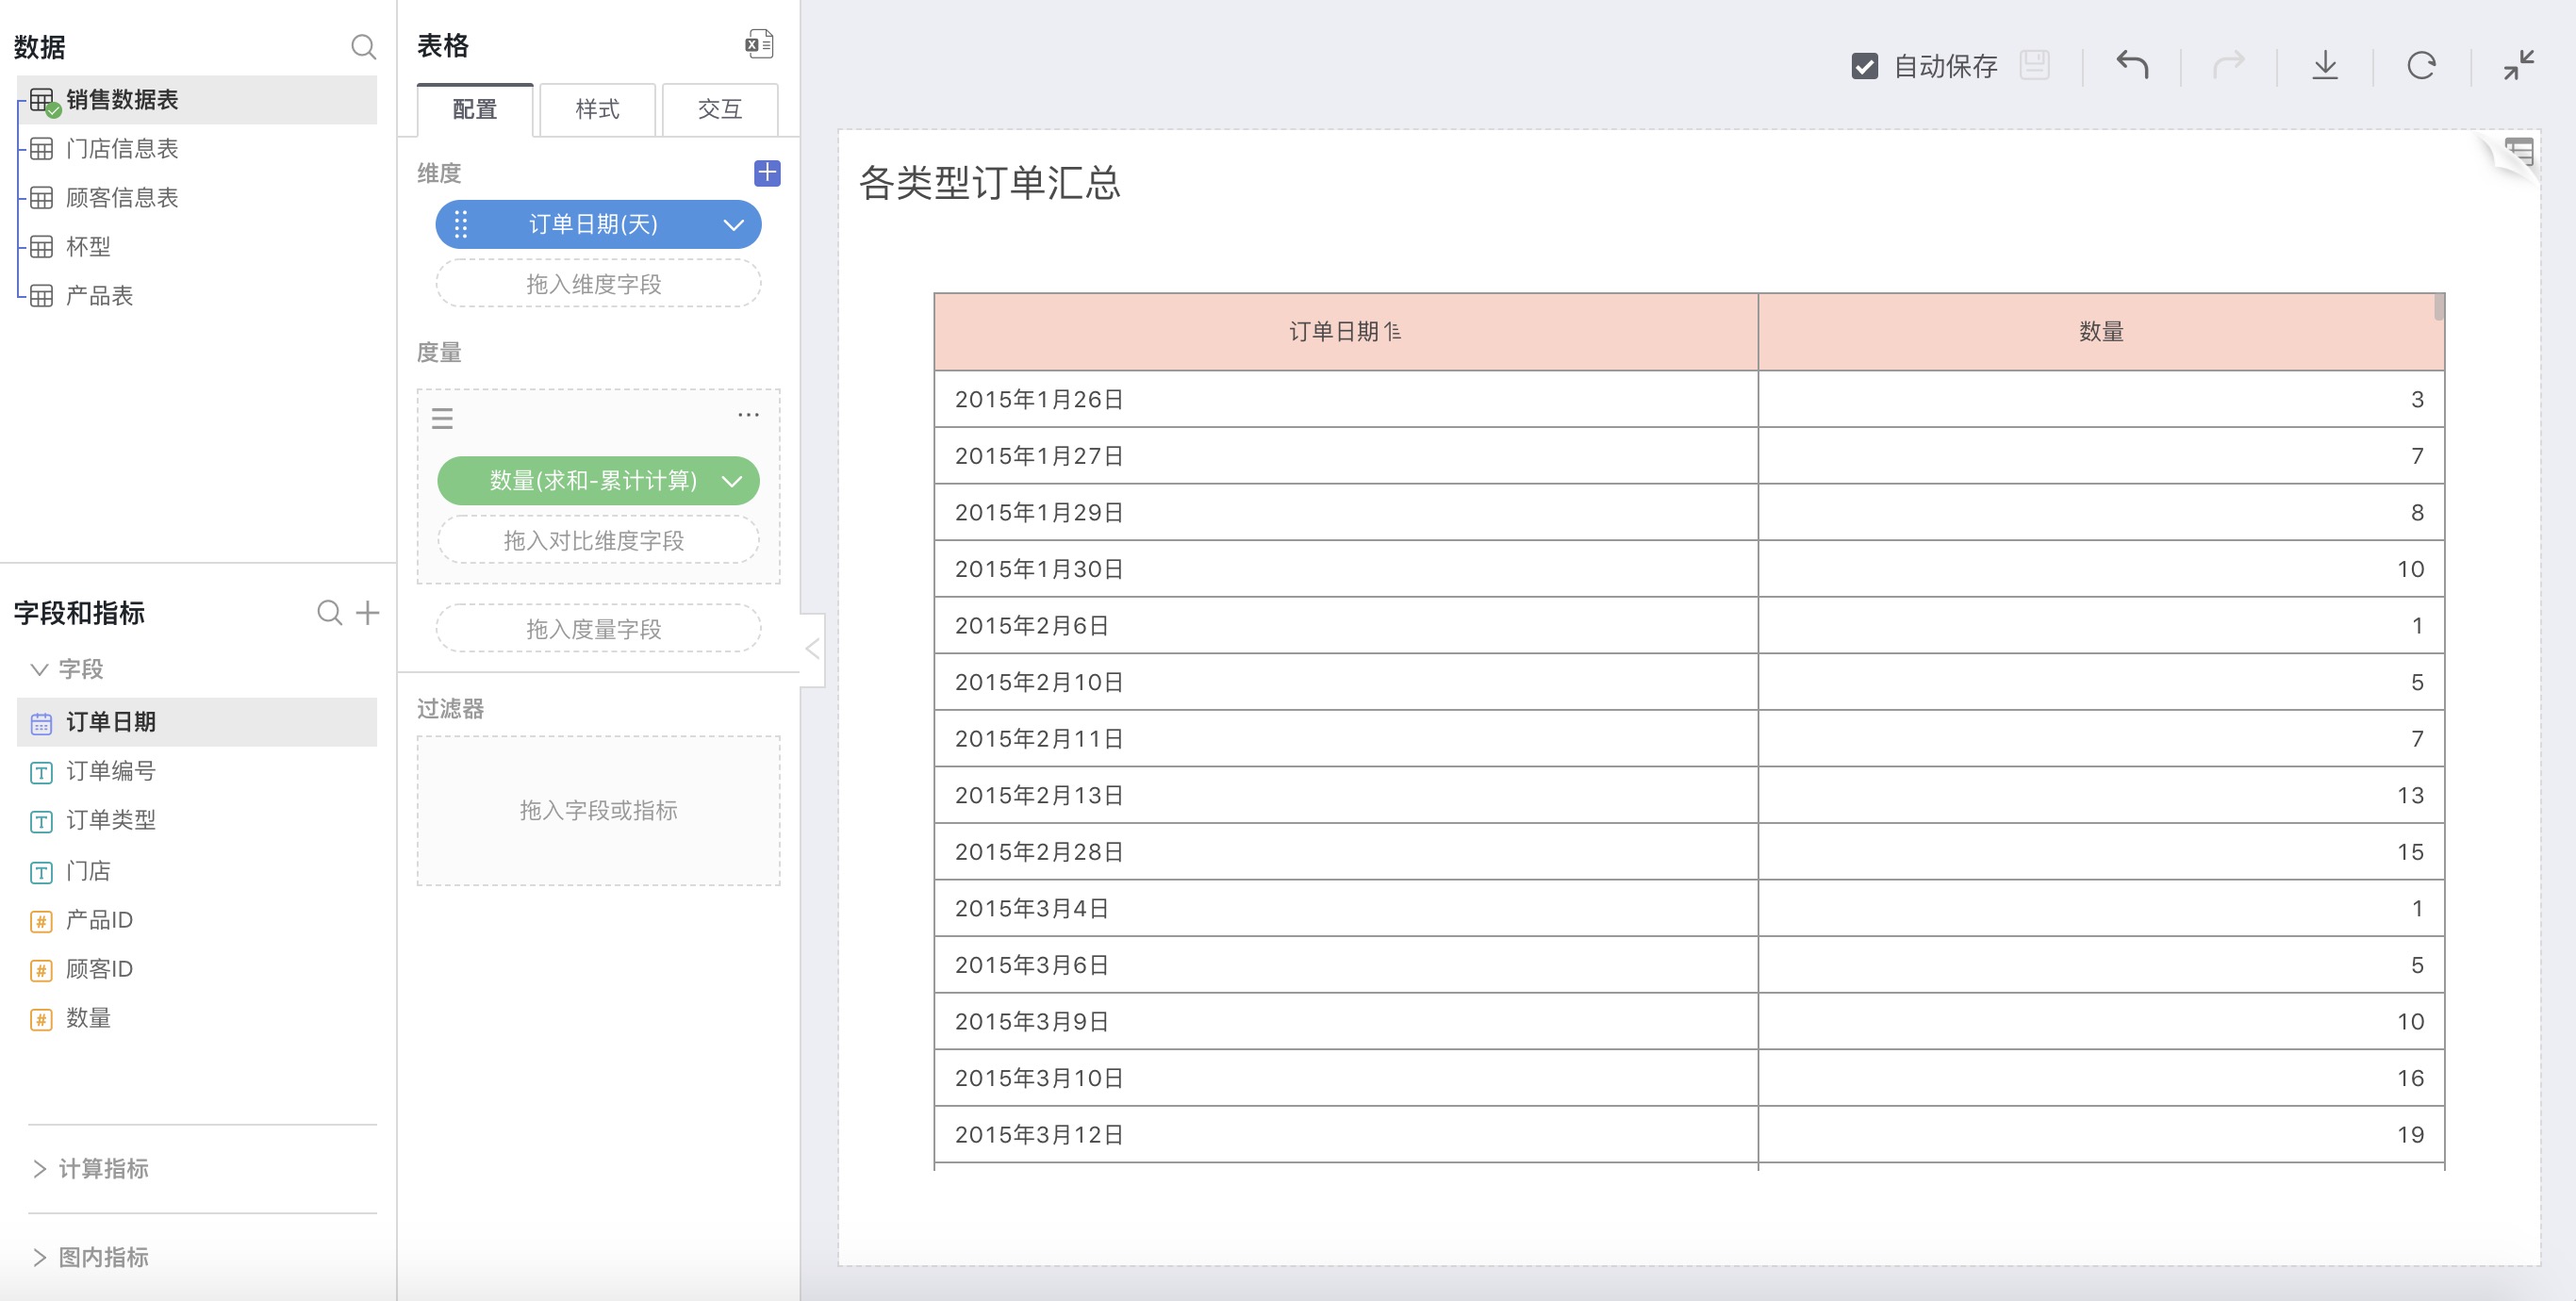
For example: Sum the sales quantities of each month
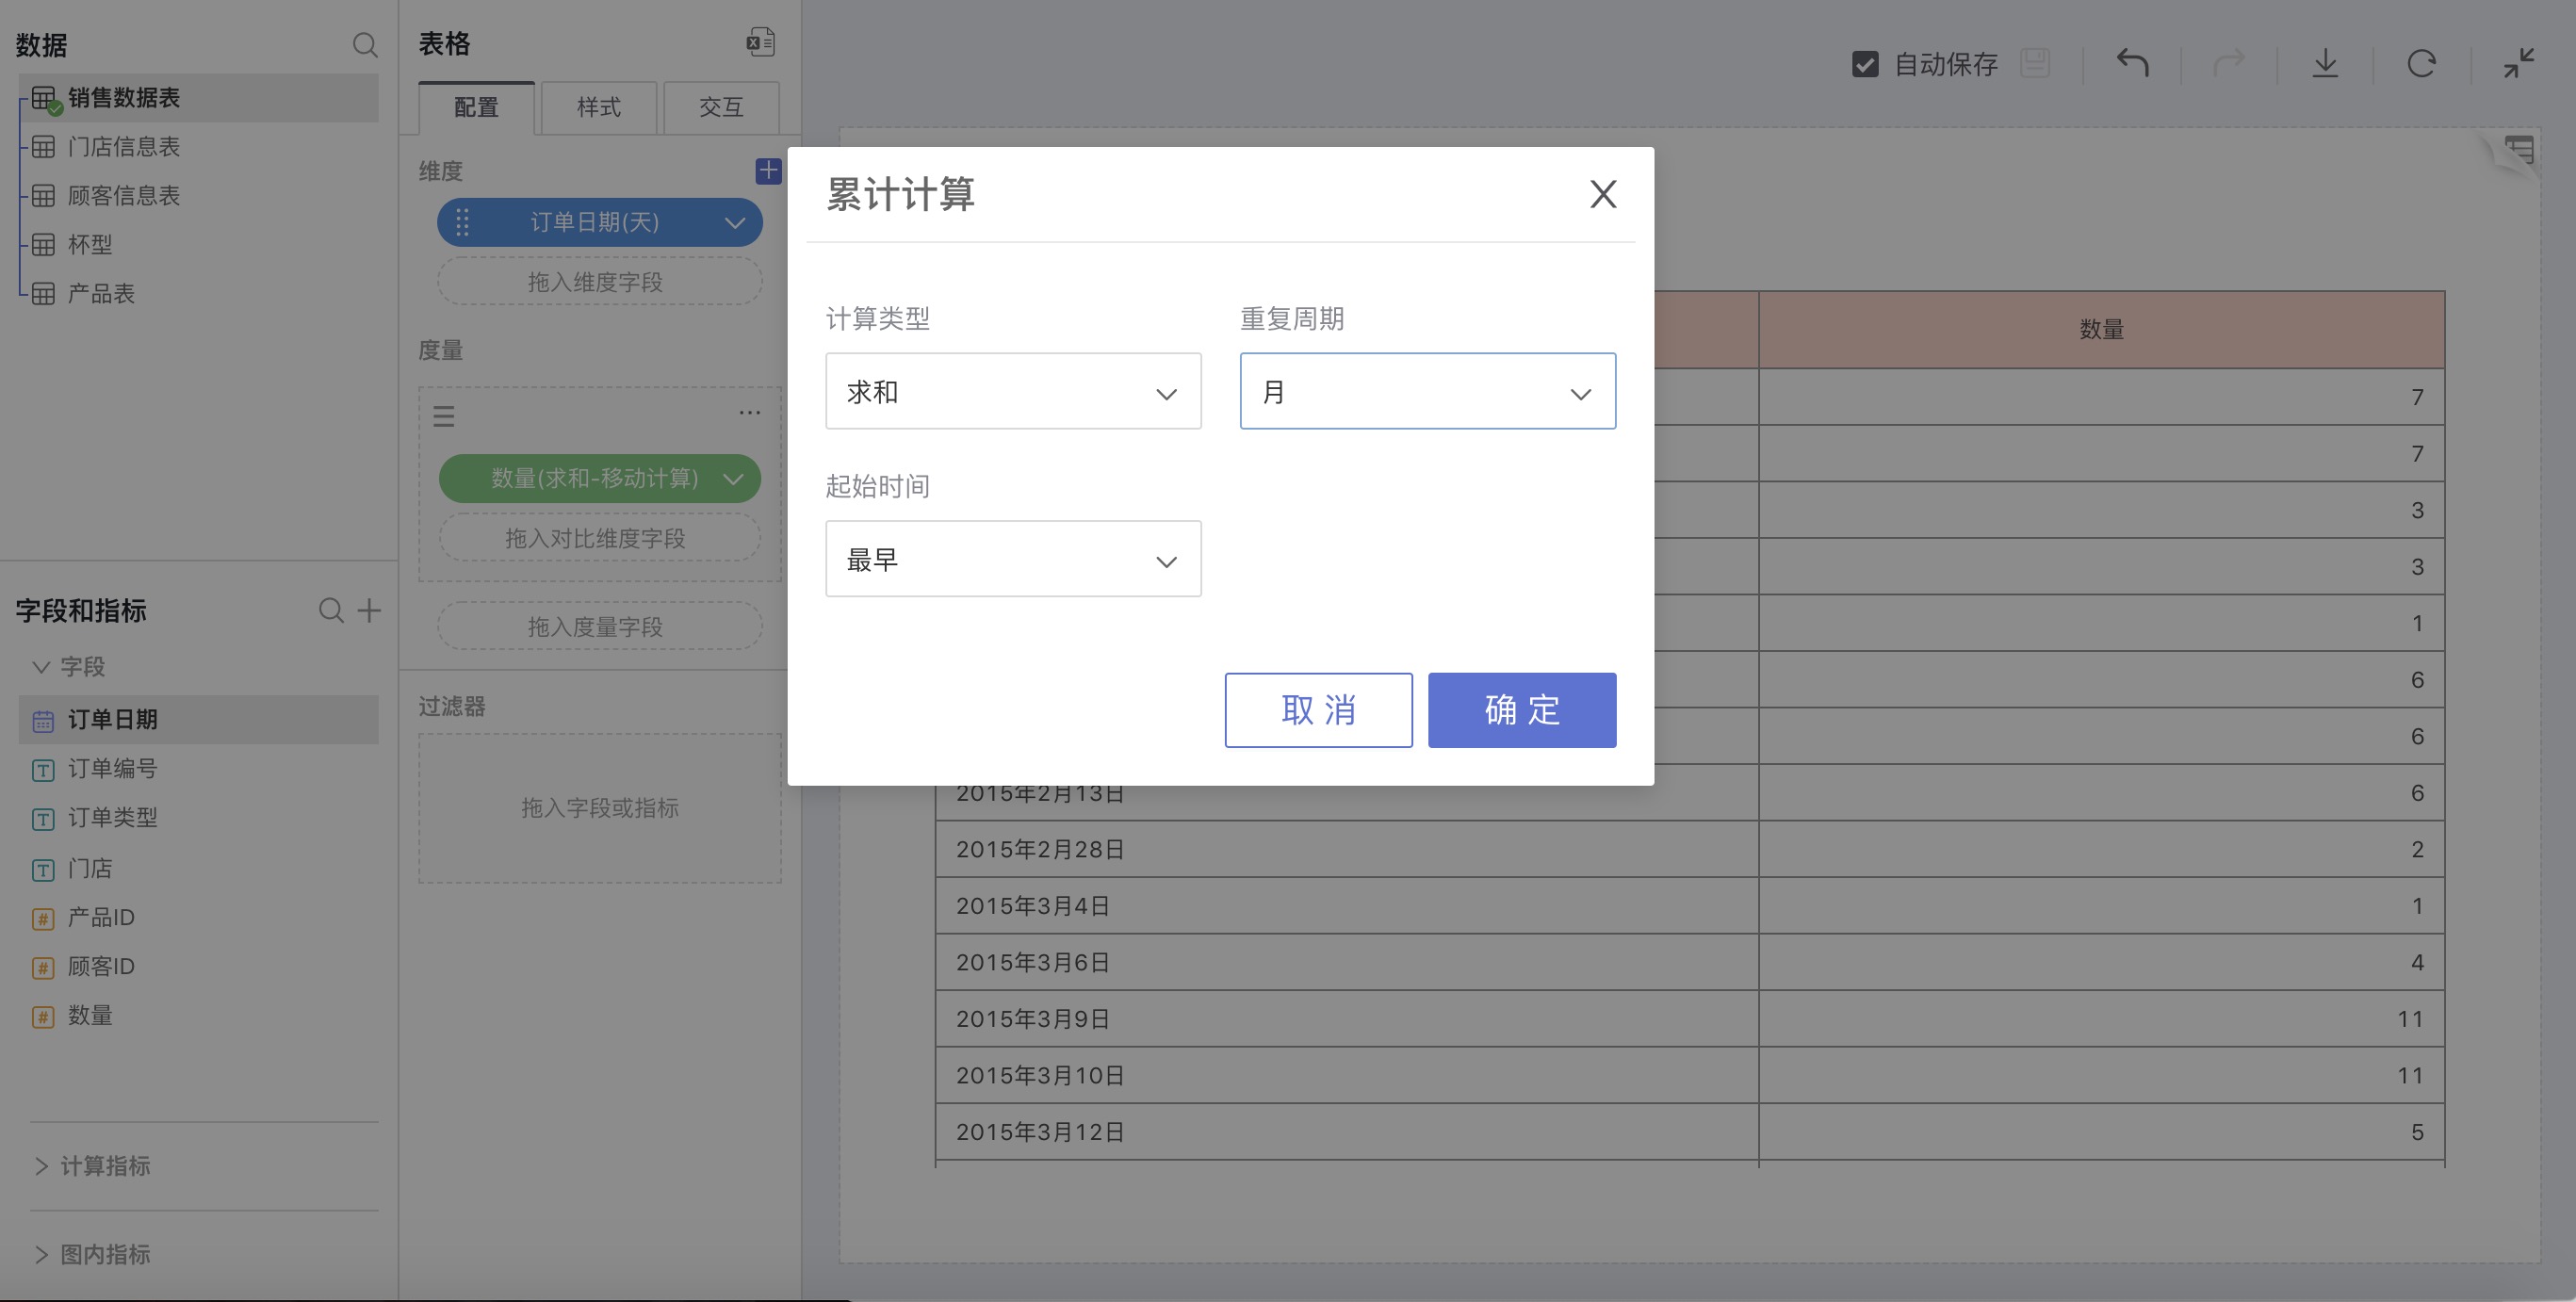
As shown in the following figure: Data for each month will be cumulatively added
Percentile
Explanation
Sort the specified field data, calculate the corresponding cumulative percentile, and the value corresponding to a certain percentile is the percentile number (including None, Percentage, Year-on-Year/Sequential Growth, Cumulative Calculation, Moving Calculation – a total of six calculation methods).
How to Use
Select Percentile in advanced calculation for measures. In the pop-up window, make custom settings.
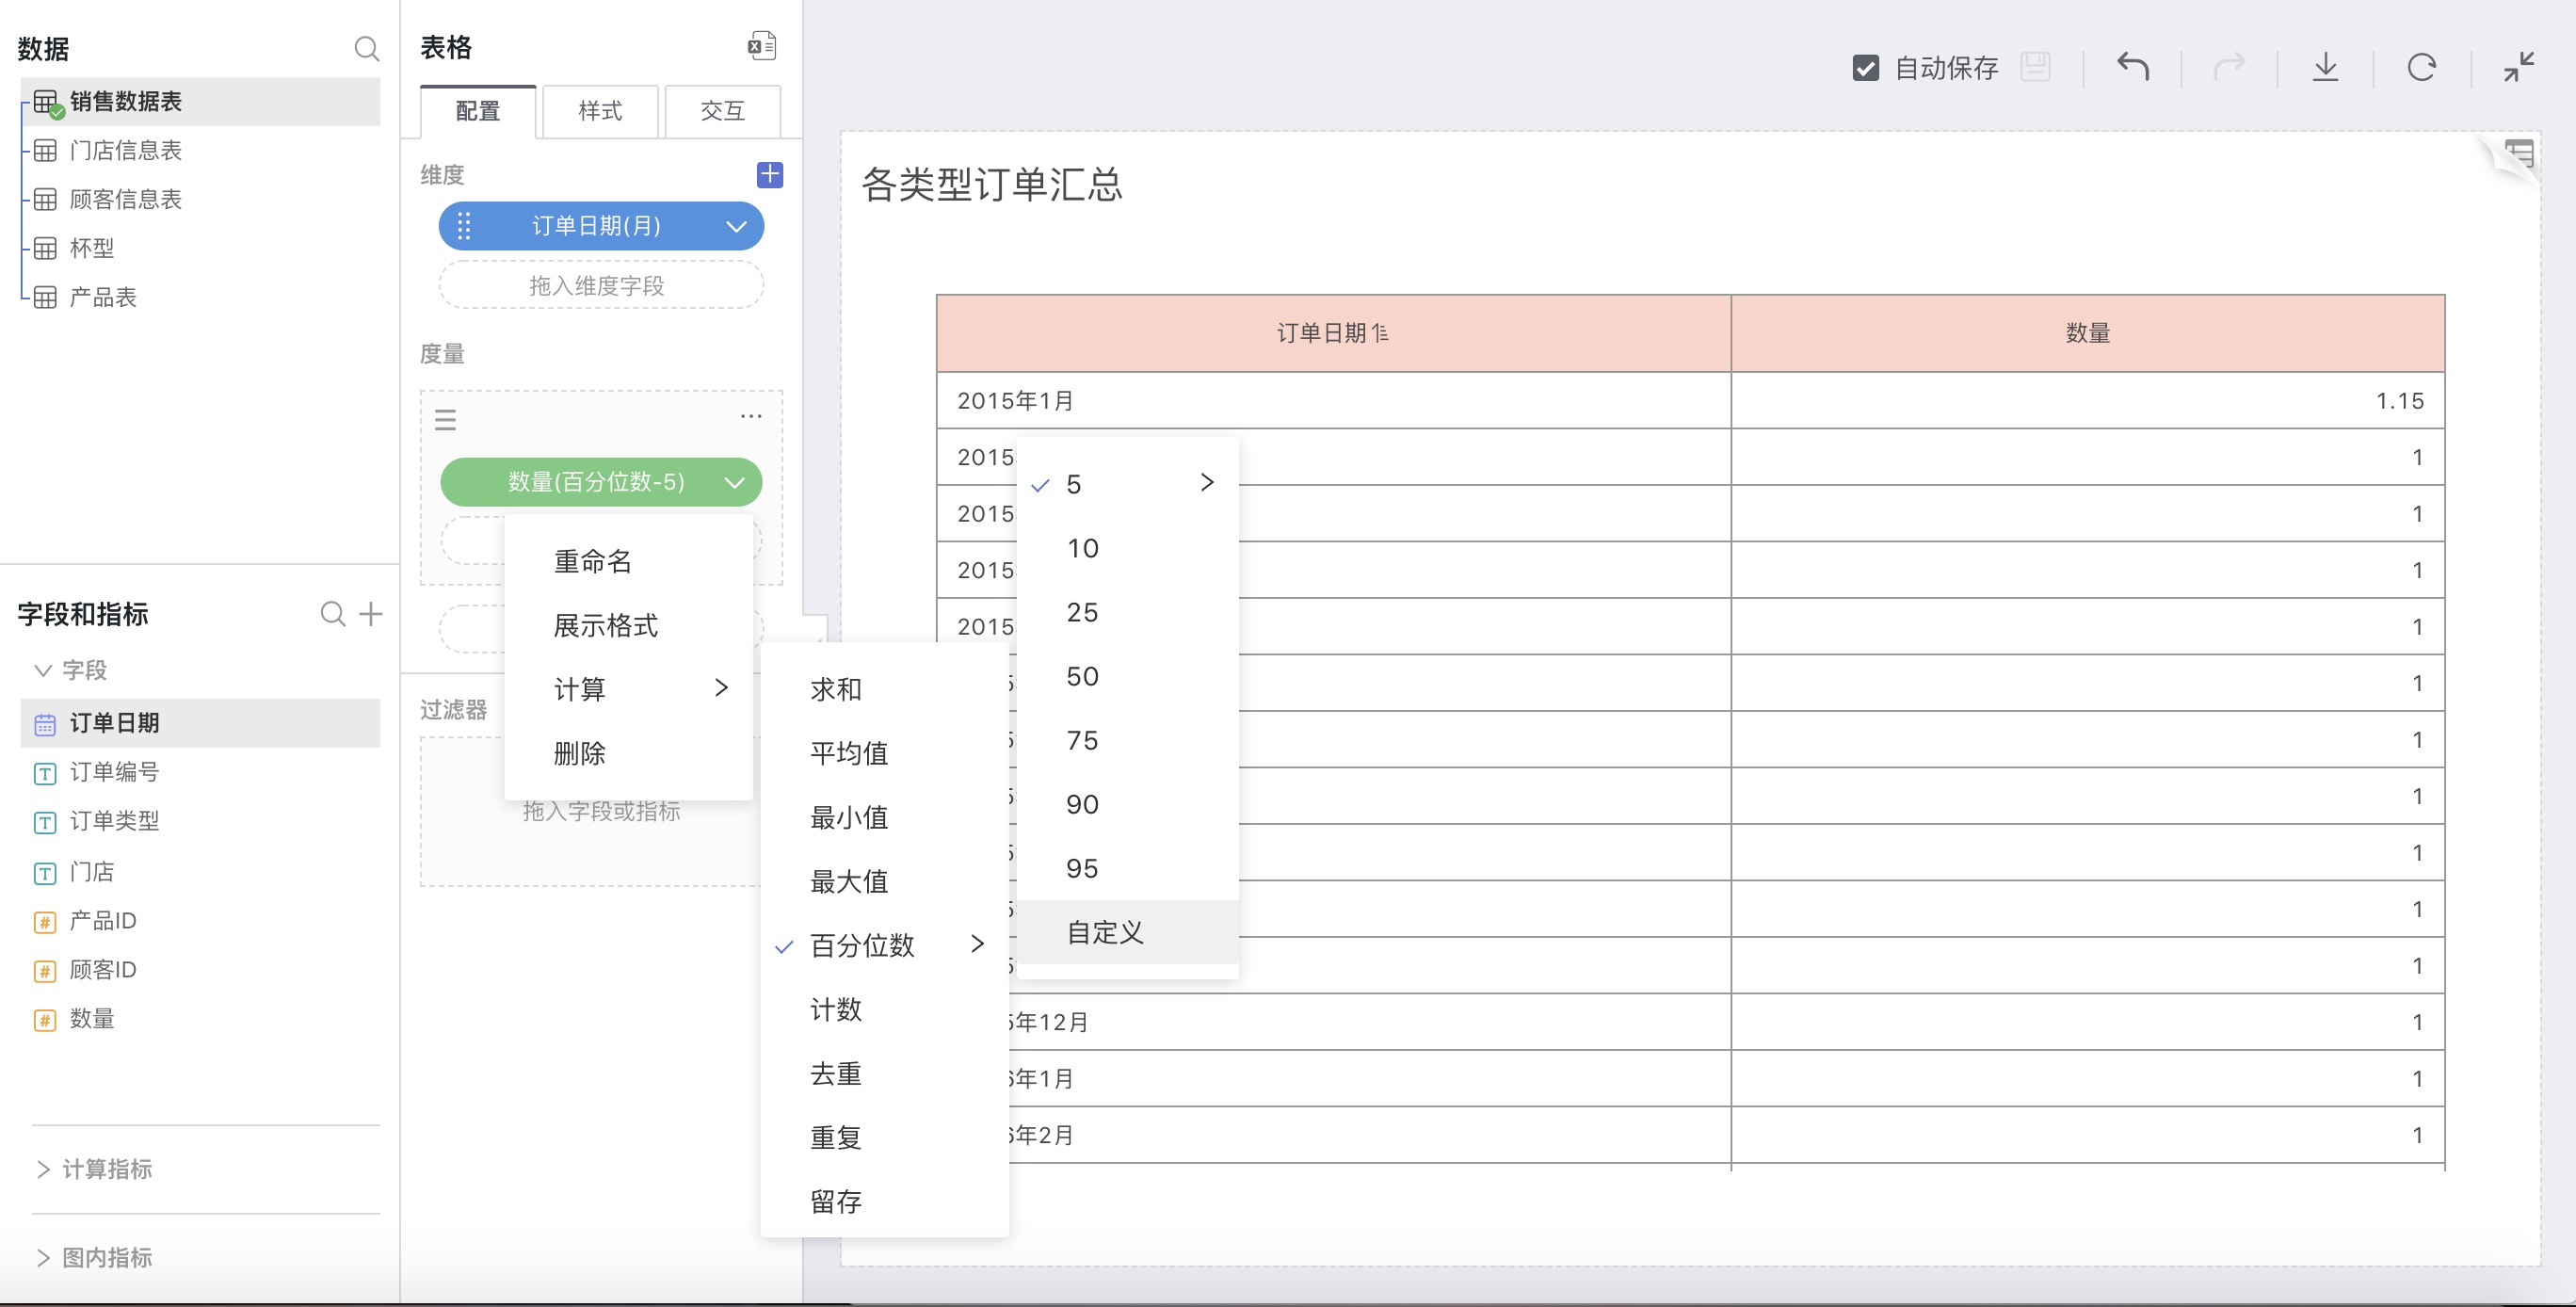
For example: The 85th percentile for each month
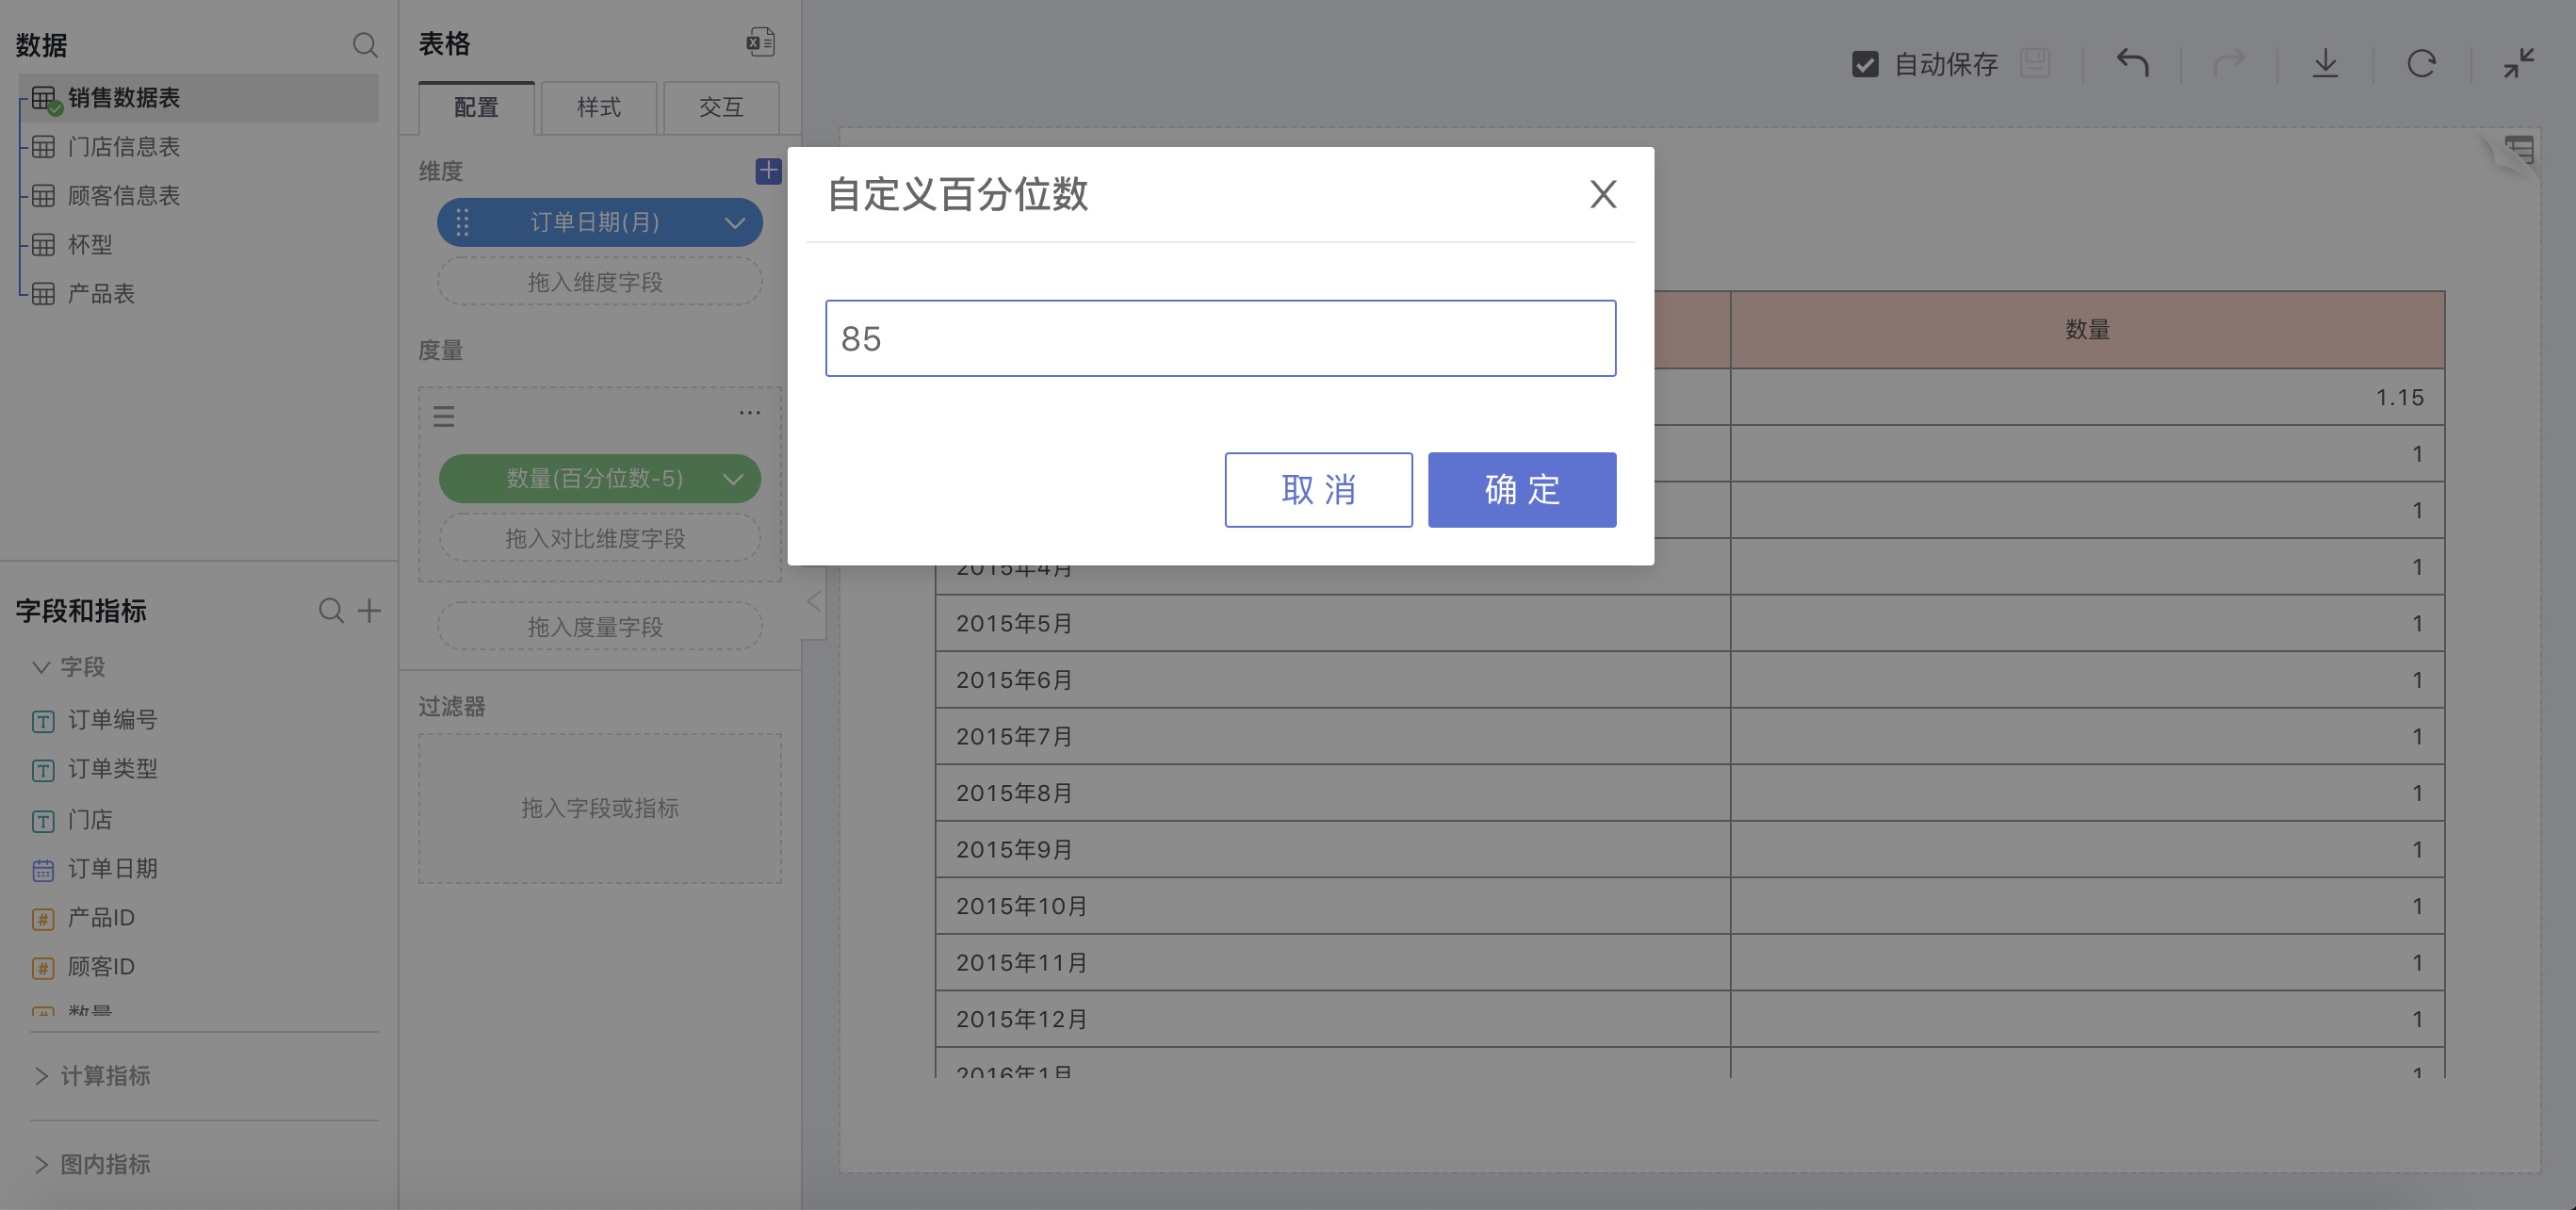
In the calculation method for measures, select Percentile, in the expanded percentile option, choose Custom, and in the pop-up input box, enter 85:
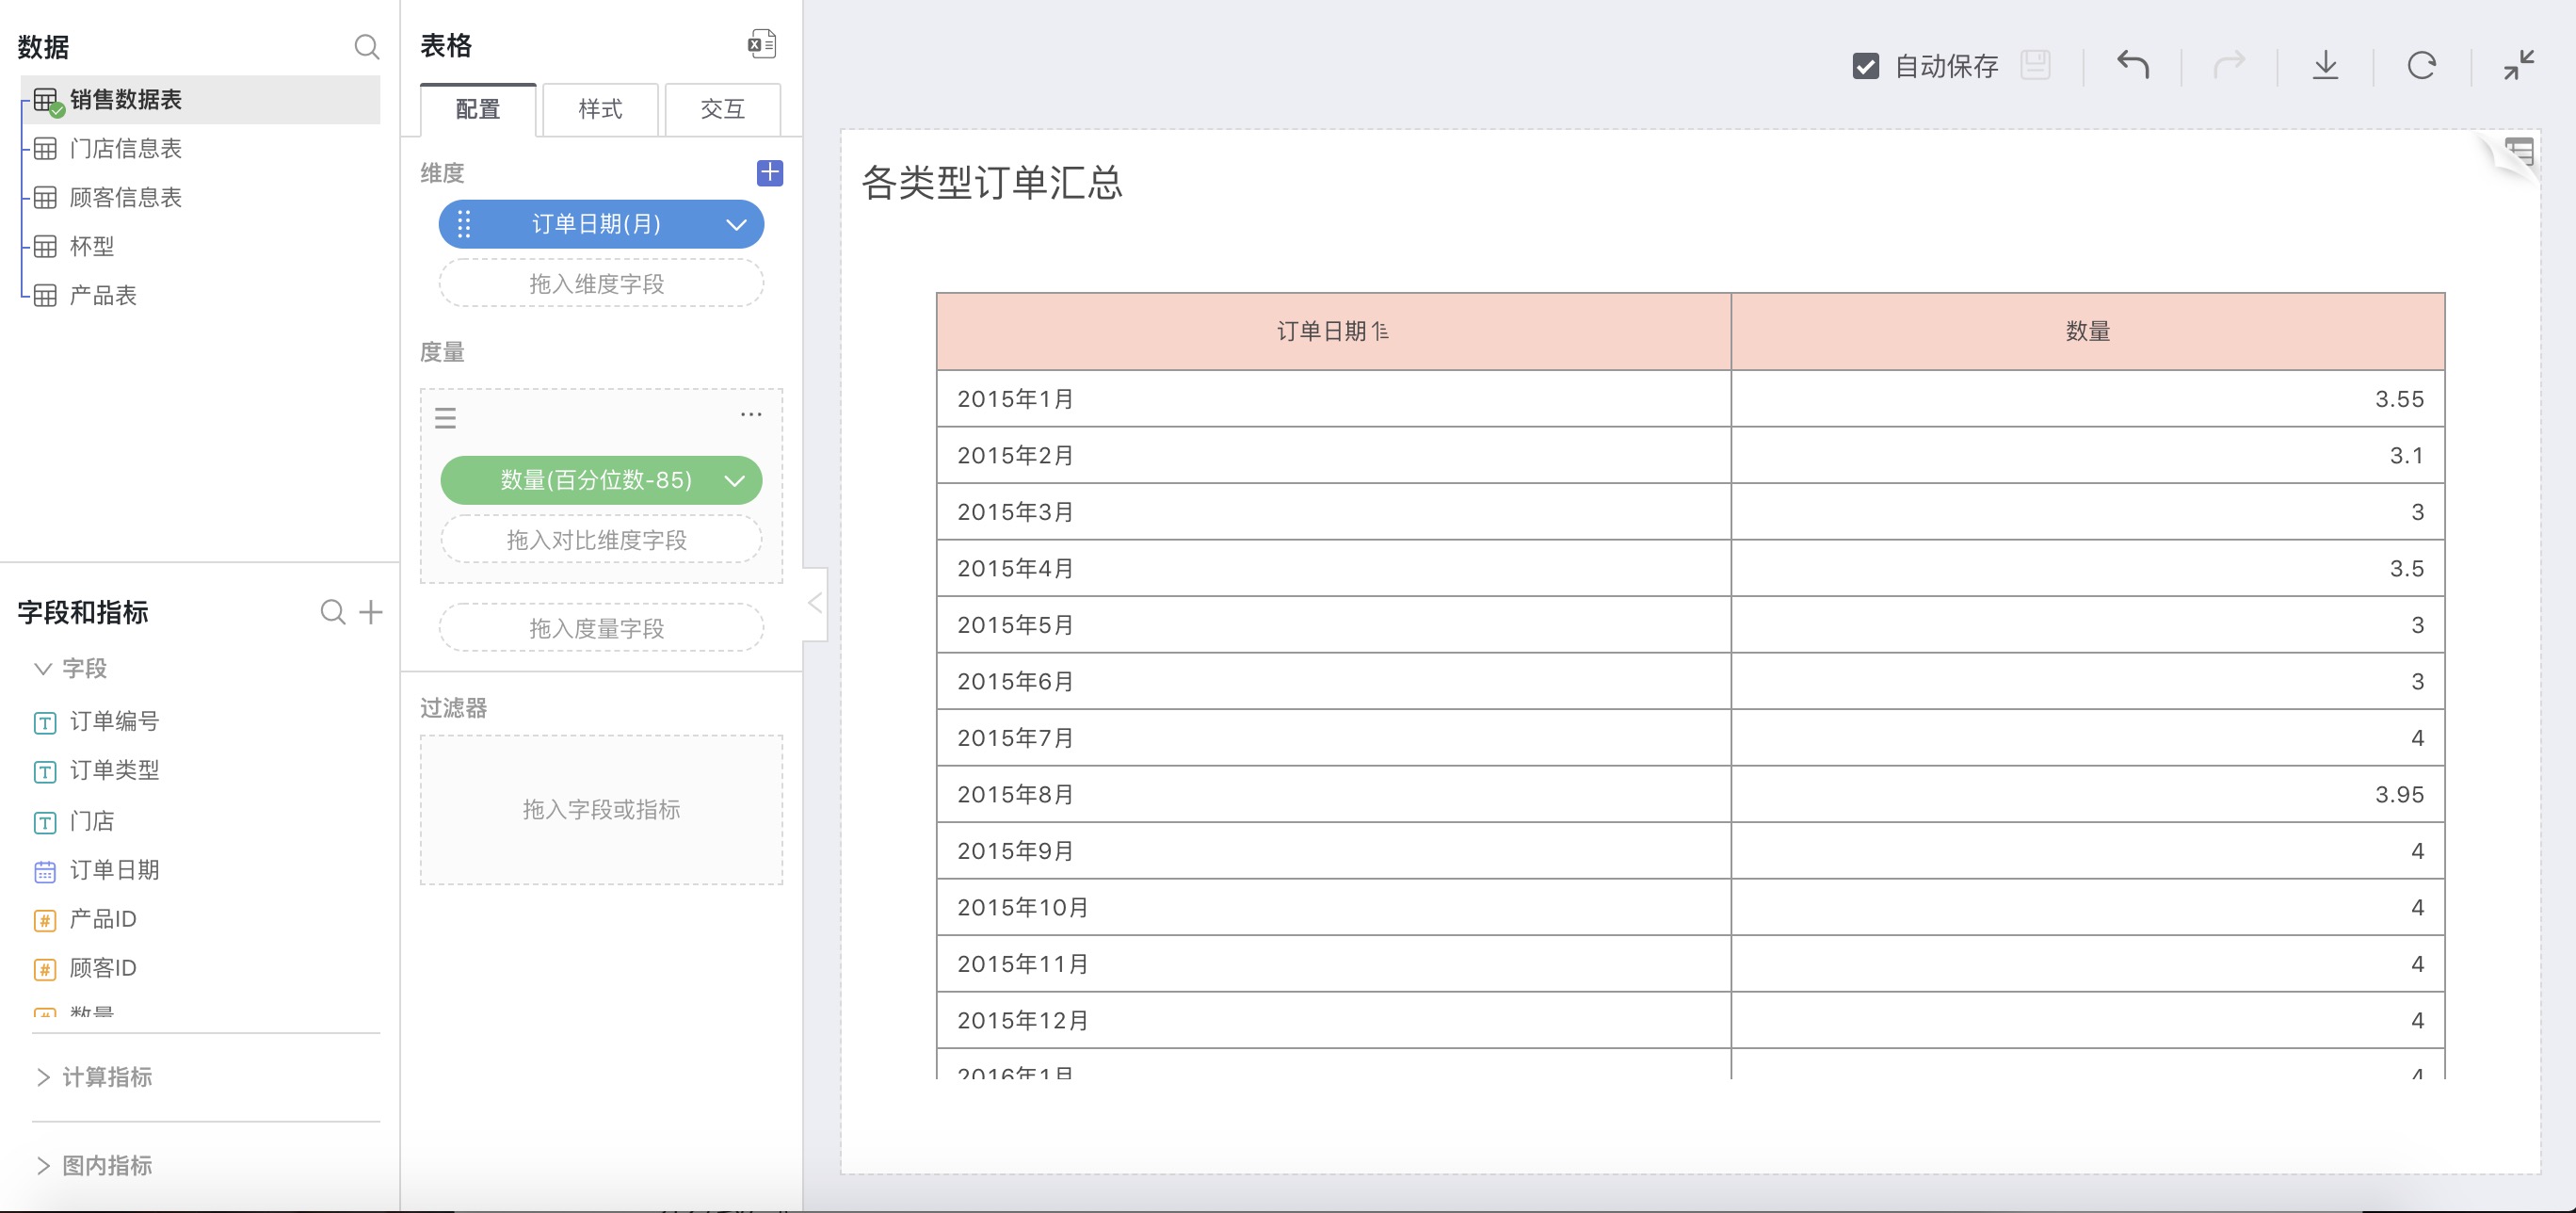
As shown below, the 85th percentile corresponding to the sales volume of each month is:
Median
Explanation
Sort the specified field data and find the value right in the middle to be the median (including None, Percentage, Year-on-Year/Sequential Growth, Cumulative Calculation, Moving Calculation – a total of five calculation methods).
How to Use
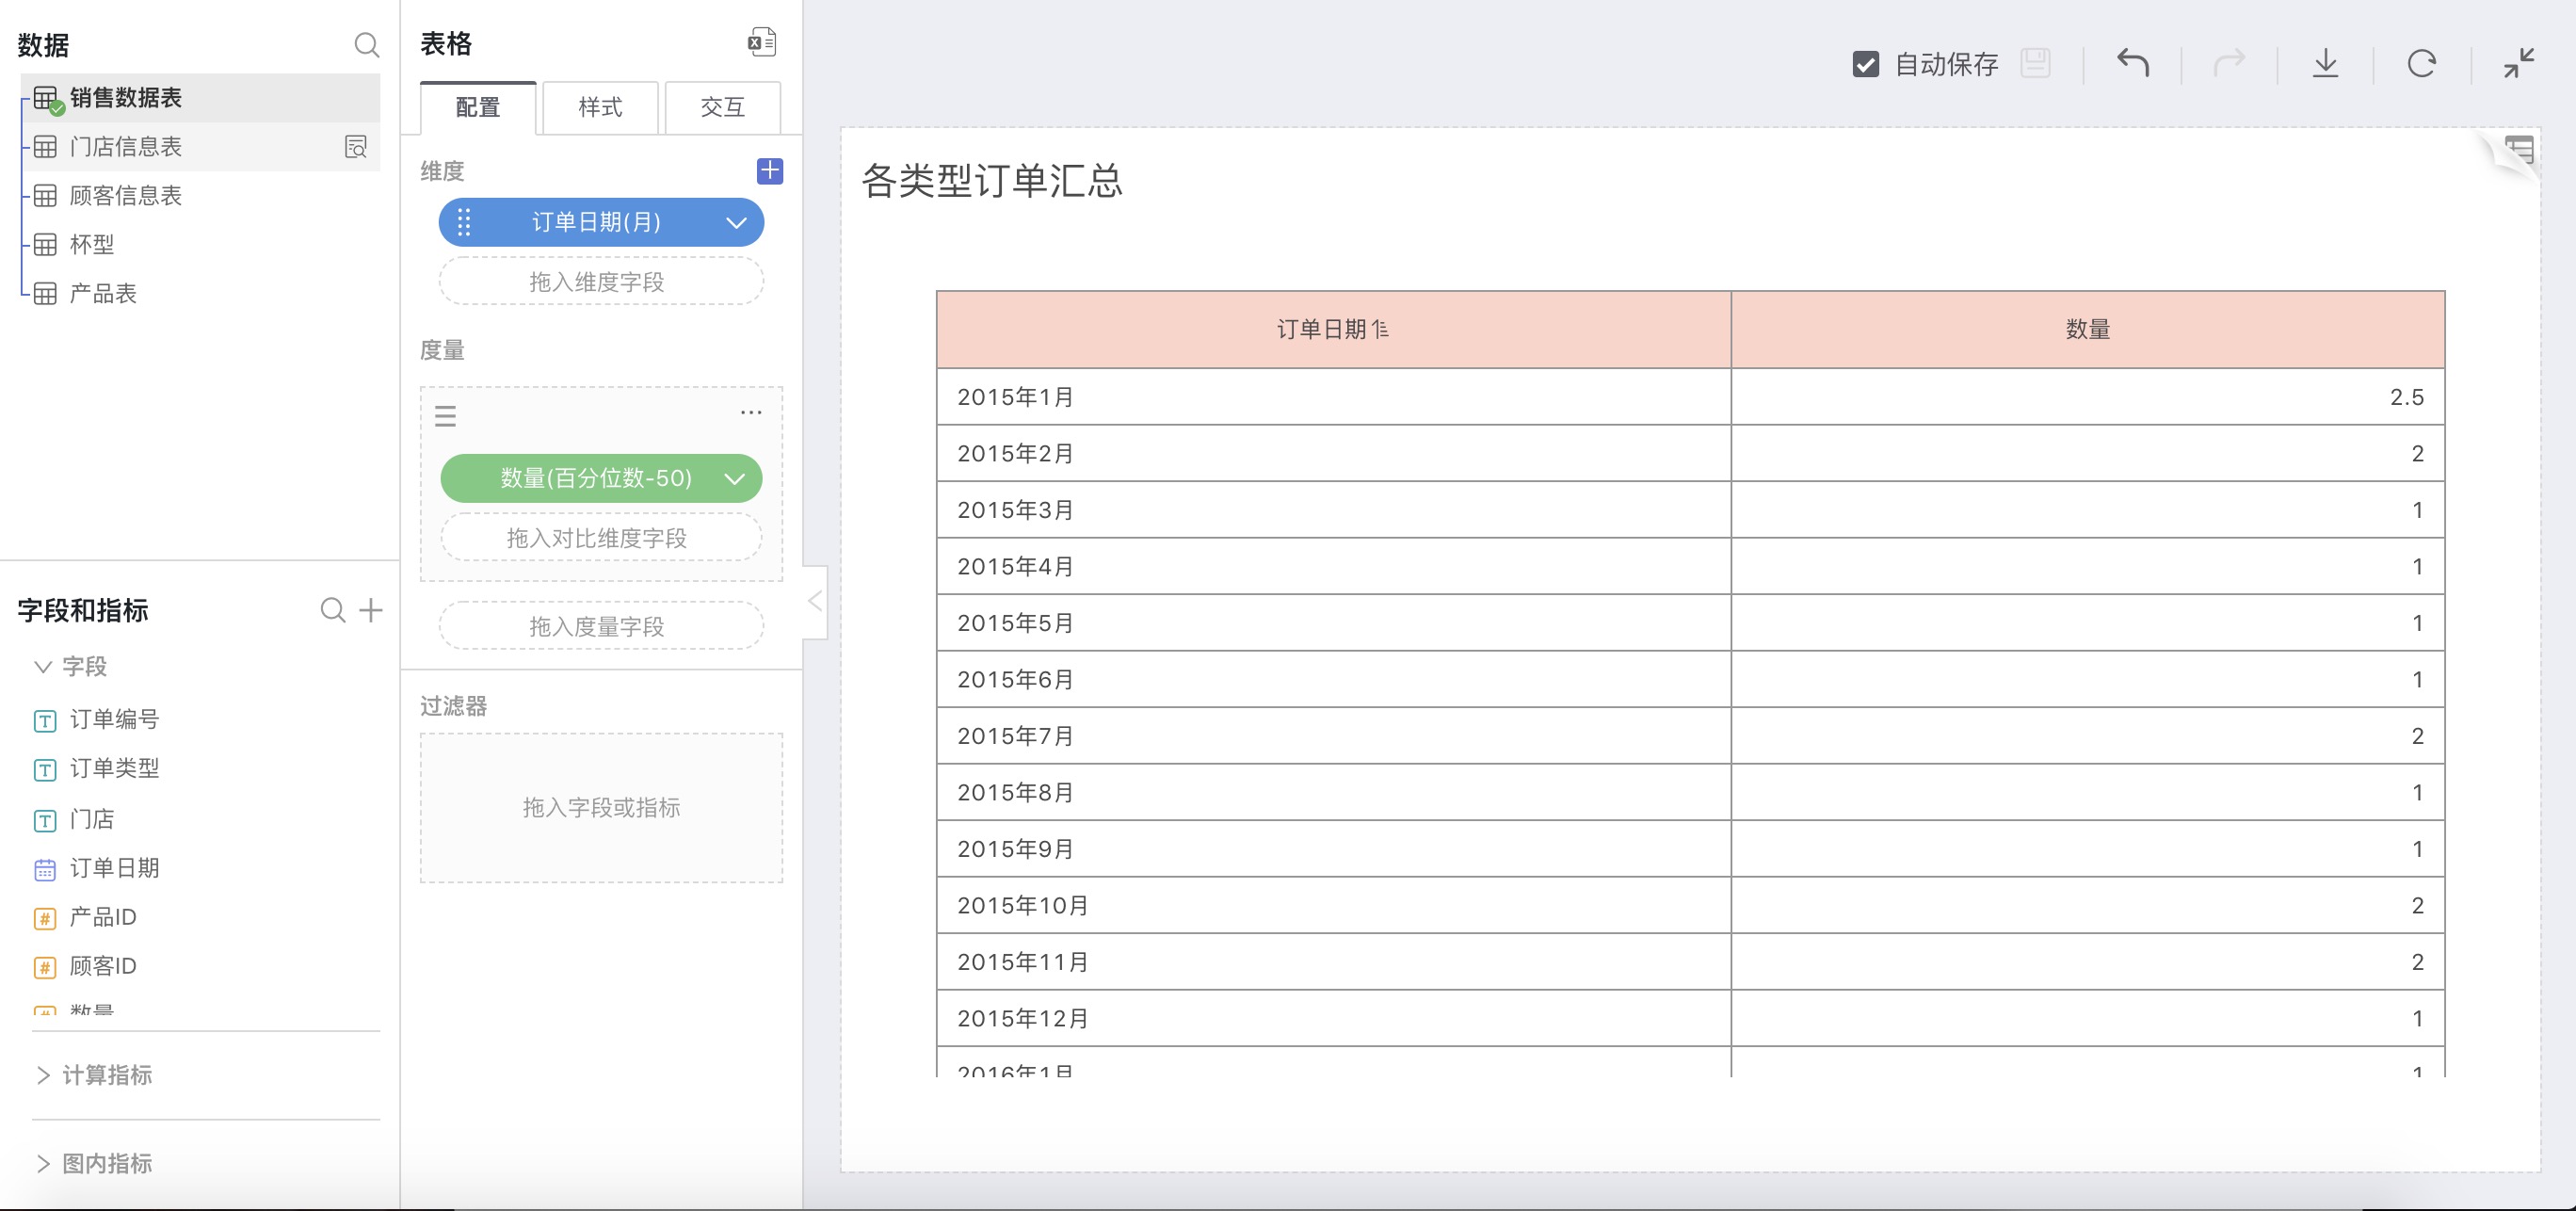
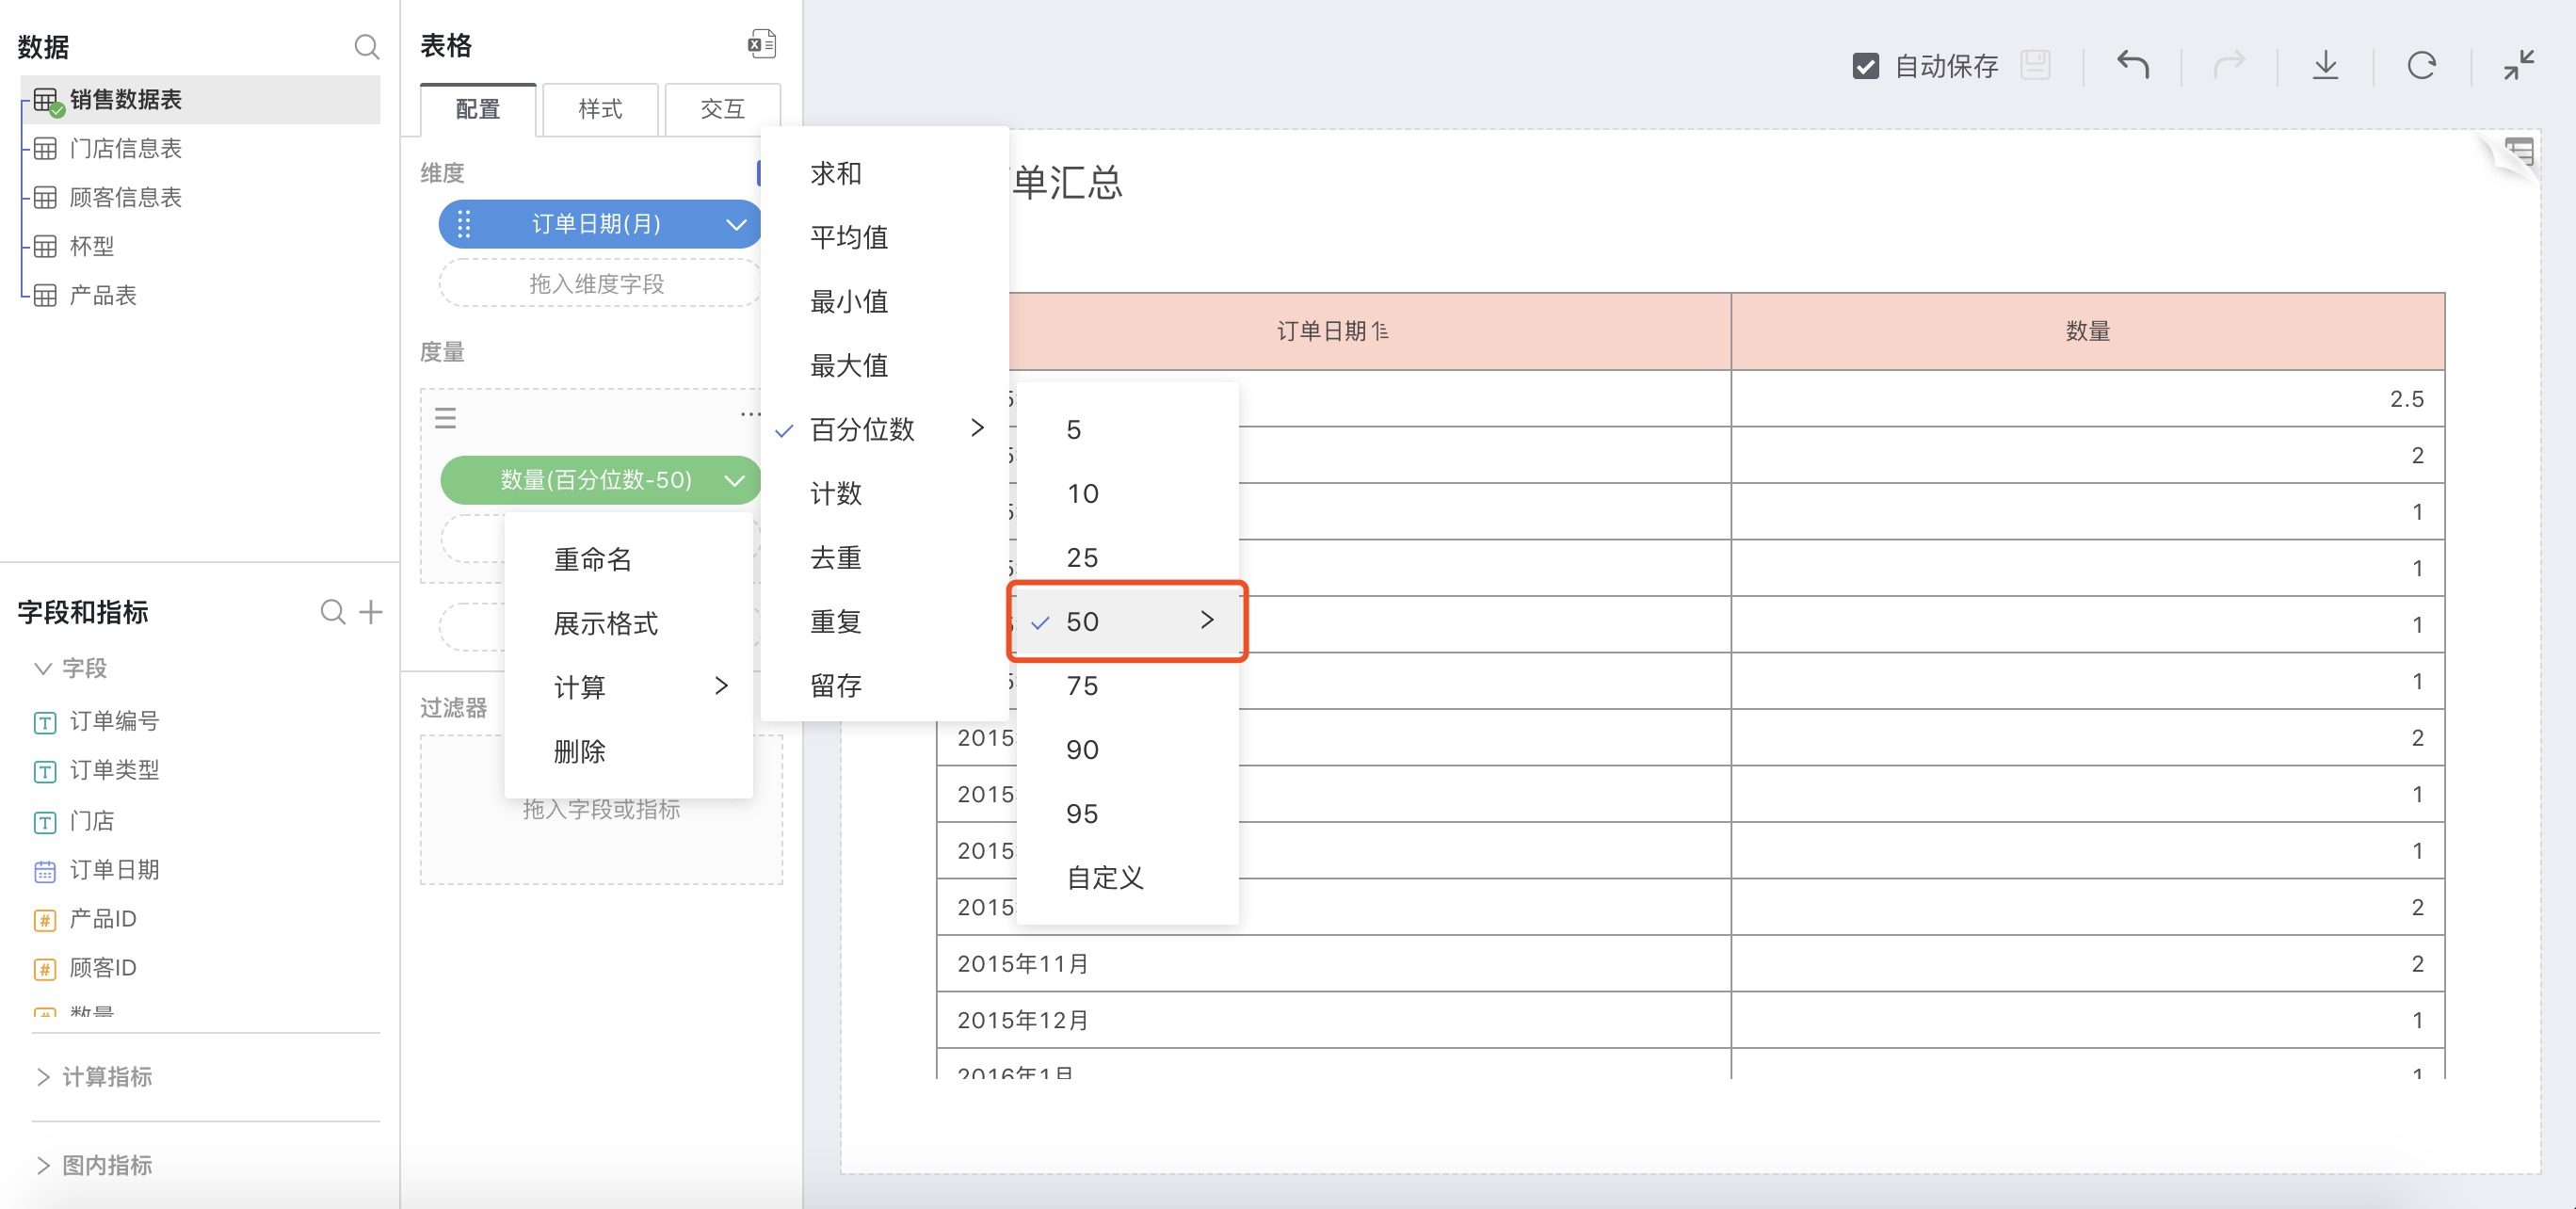
Select Percentile in advanced calculation for measures, in the pop-up window, choose 50%, and customize the calculation method settings.
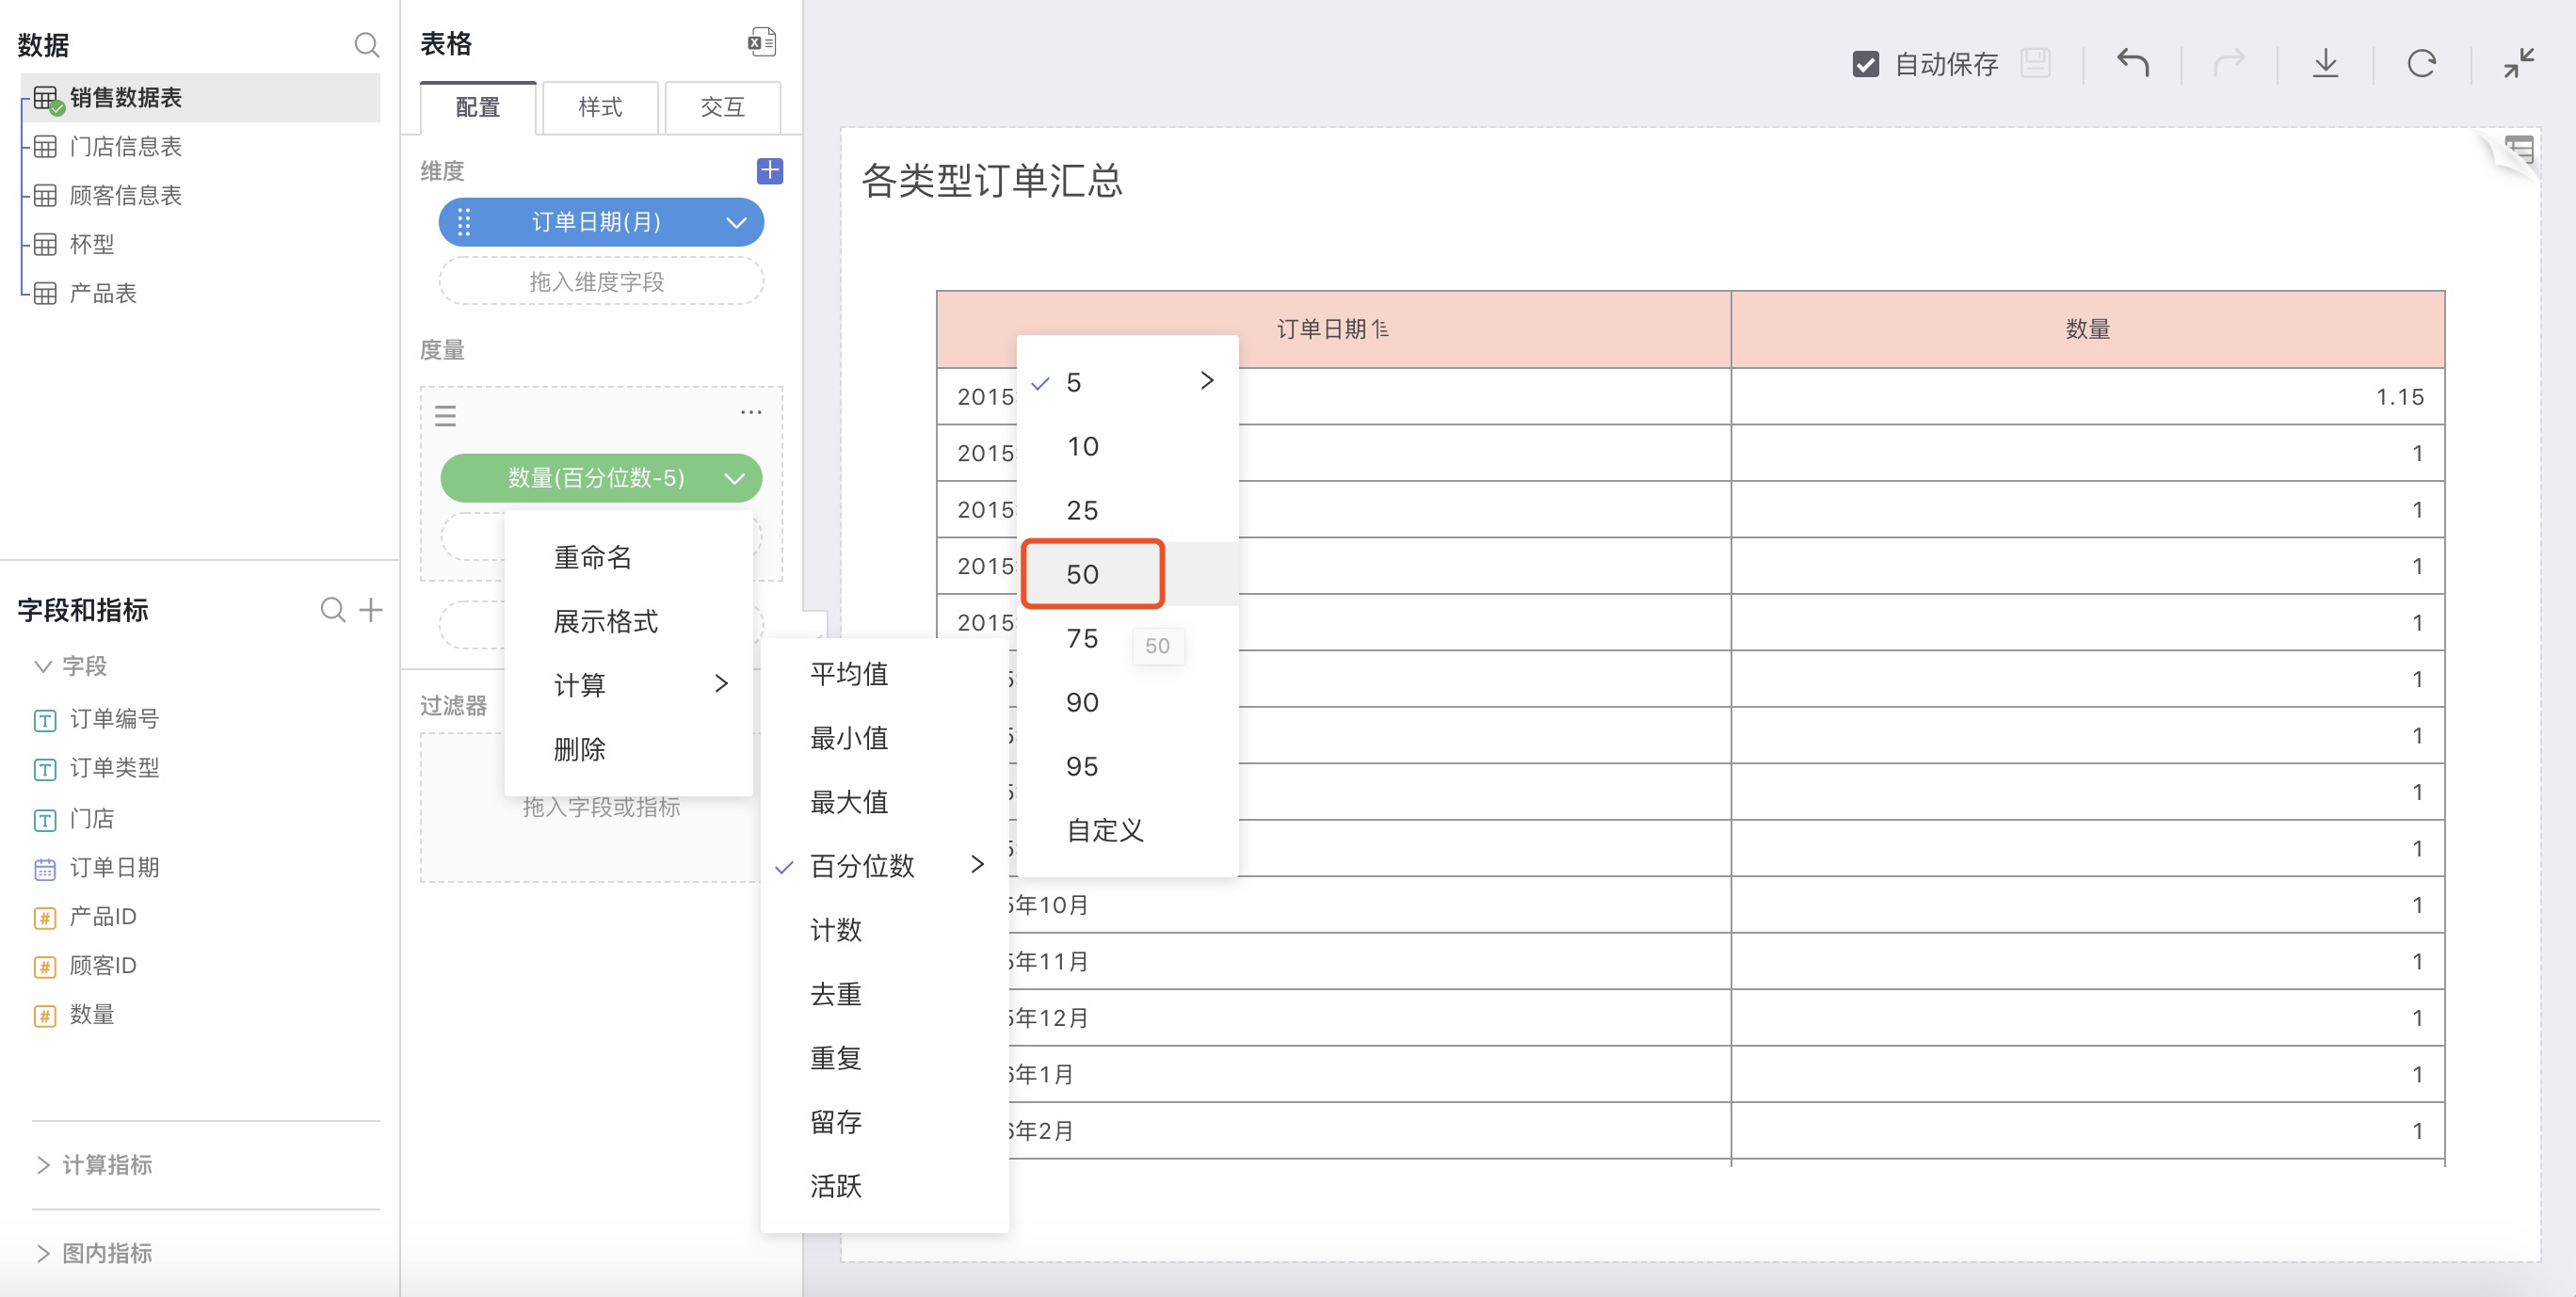
For example: Calculate the percentile for sales volume for each month
In the calculation method for measures, select Percentile, in the expanded percentile option, choose 50:
As shown below, the median sales volume for each month is: