Hengshi Documentation
How to Introduce Data Mart Achievements in HENGSHI SENSE 3.0 Visual Creation
The 3.0 version provides centralized data mart management, which is the function of the data mart:
The data mart supports the establishment of a hierarchical data mart structure, authorizing by users, user groups, and organizational structures, and distributing data to the right people. It supports unified management of calculated fields and indicators, enabling the internal realization of key KPI statistical logic, with statistical algorithms maintaining consistency across departments, putting an end to data inconsistencies. Comprehensive data permission settings support various permission modes for data connection and row-level permissions, meeting different permission management scenarios.
This chapter takes the coffee analysis data as an example and describes in detail the subsequent functionalities after users have established data collections in the data mart. Coffee analysis data and analysis scenarios are explained in detail in Advanced Calculation Instructions.
Before using the documentation in this chapter, please first understand the restrictions on the visibility of different user roles in the data mart:
| User Role | Data Mart Visibility | Create Folder in Data Mart | Create DataSet in Data Mart Folder |
|---|---|---|---|
| System Management | Not Visible | - - - - - | - - - - - |
| Data Management | Visible | Unable to create, no prompt | - - - - - |
| Data Analysis | Not Visible | - - - - - | - - - - - |
| Data Viewing | Not Visible | - - - - - | - - - - - |
| System Management + Data Management | Visible | Can create | Can create any dataset |
| System Management + Data Analysis | Not Visible | - - - - - | - - - - - |
| System Management + Data Viewing | Not Visible | - - - - - | - - - - - |
| Data Management + Data Analysis | Visible | Unable to create, no prompt | - - - - - |
| Data Management + Data Viewing | Visible | Unable to create, no prompt | - - - - - |
| Data Analysis + Data Viewing | Not Visible | - - - - - | - - - - - |
| System Management + Data Management + Data Analysis | Visible | Can create | Can create any dataset |
| System Management + Data Management + Data Viewing | Visible | Can create | Can create any dataset |
| System Management + Data Analysis + Data Viewing | Not Visible | - - - - - | - - - - - |
| Data Management + Data Analysis + Data Viewing | Visible | Unable to create, no prompt | - - - - - |
| System Management + Data Management + Data Analysis + Data Viewing | Visible | Can create | Can create any dataset |
The above table records the visibility of any user to the data mart and the operations that can be performed in the data mart.
Users with roles of System Management + Data Management can create folders and data packages in the data mart; Users with the Data Management role cannot create new folders or data packages in the data mart, but they can create datasets in authorized folders.
Below, taking coffee analysis as an example, we briefly introduce the entire process from completing data processing in the app mart to using the data from the data package to create charts in data visualization.
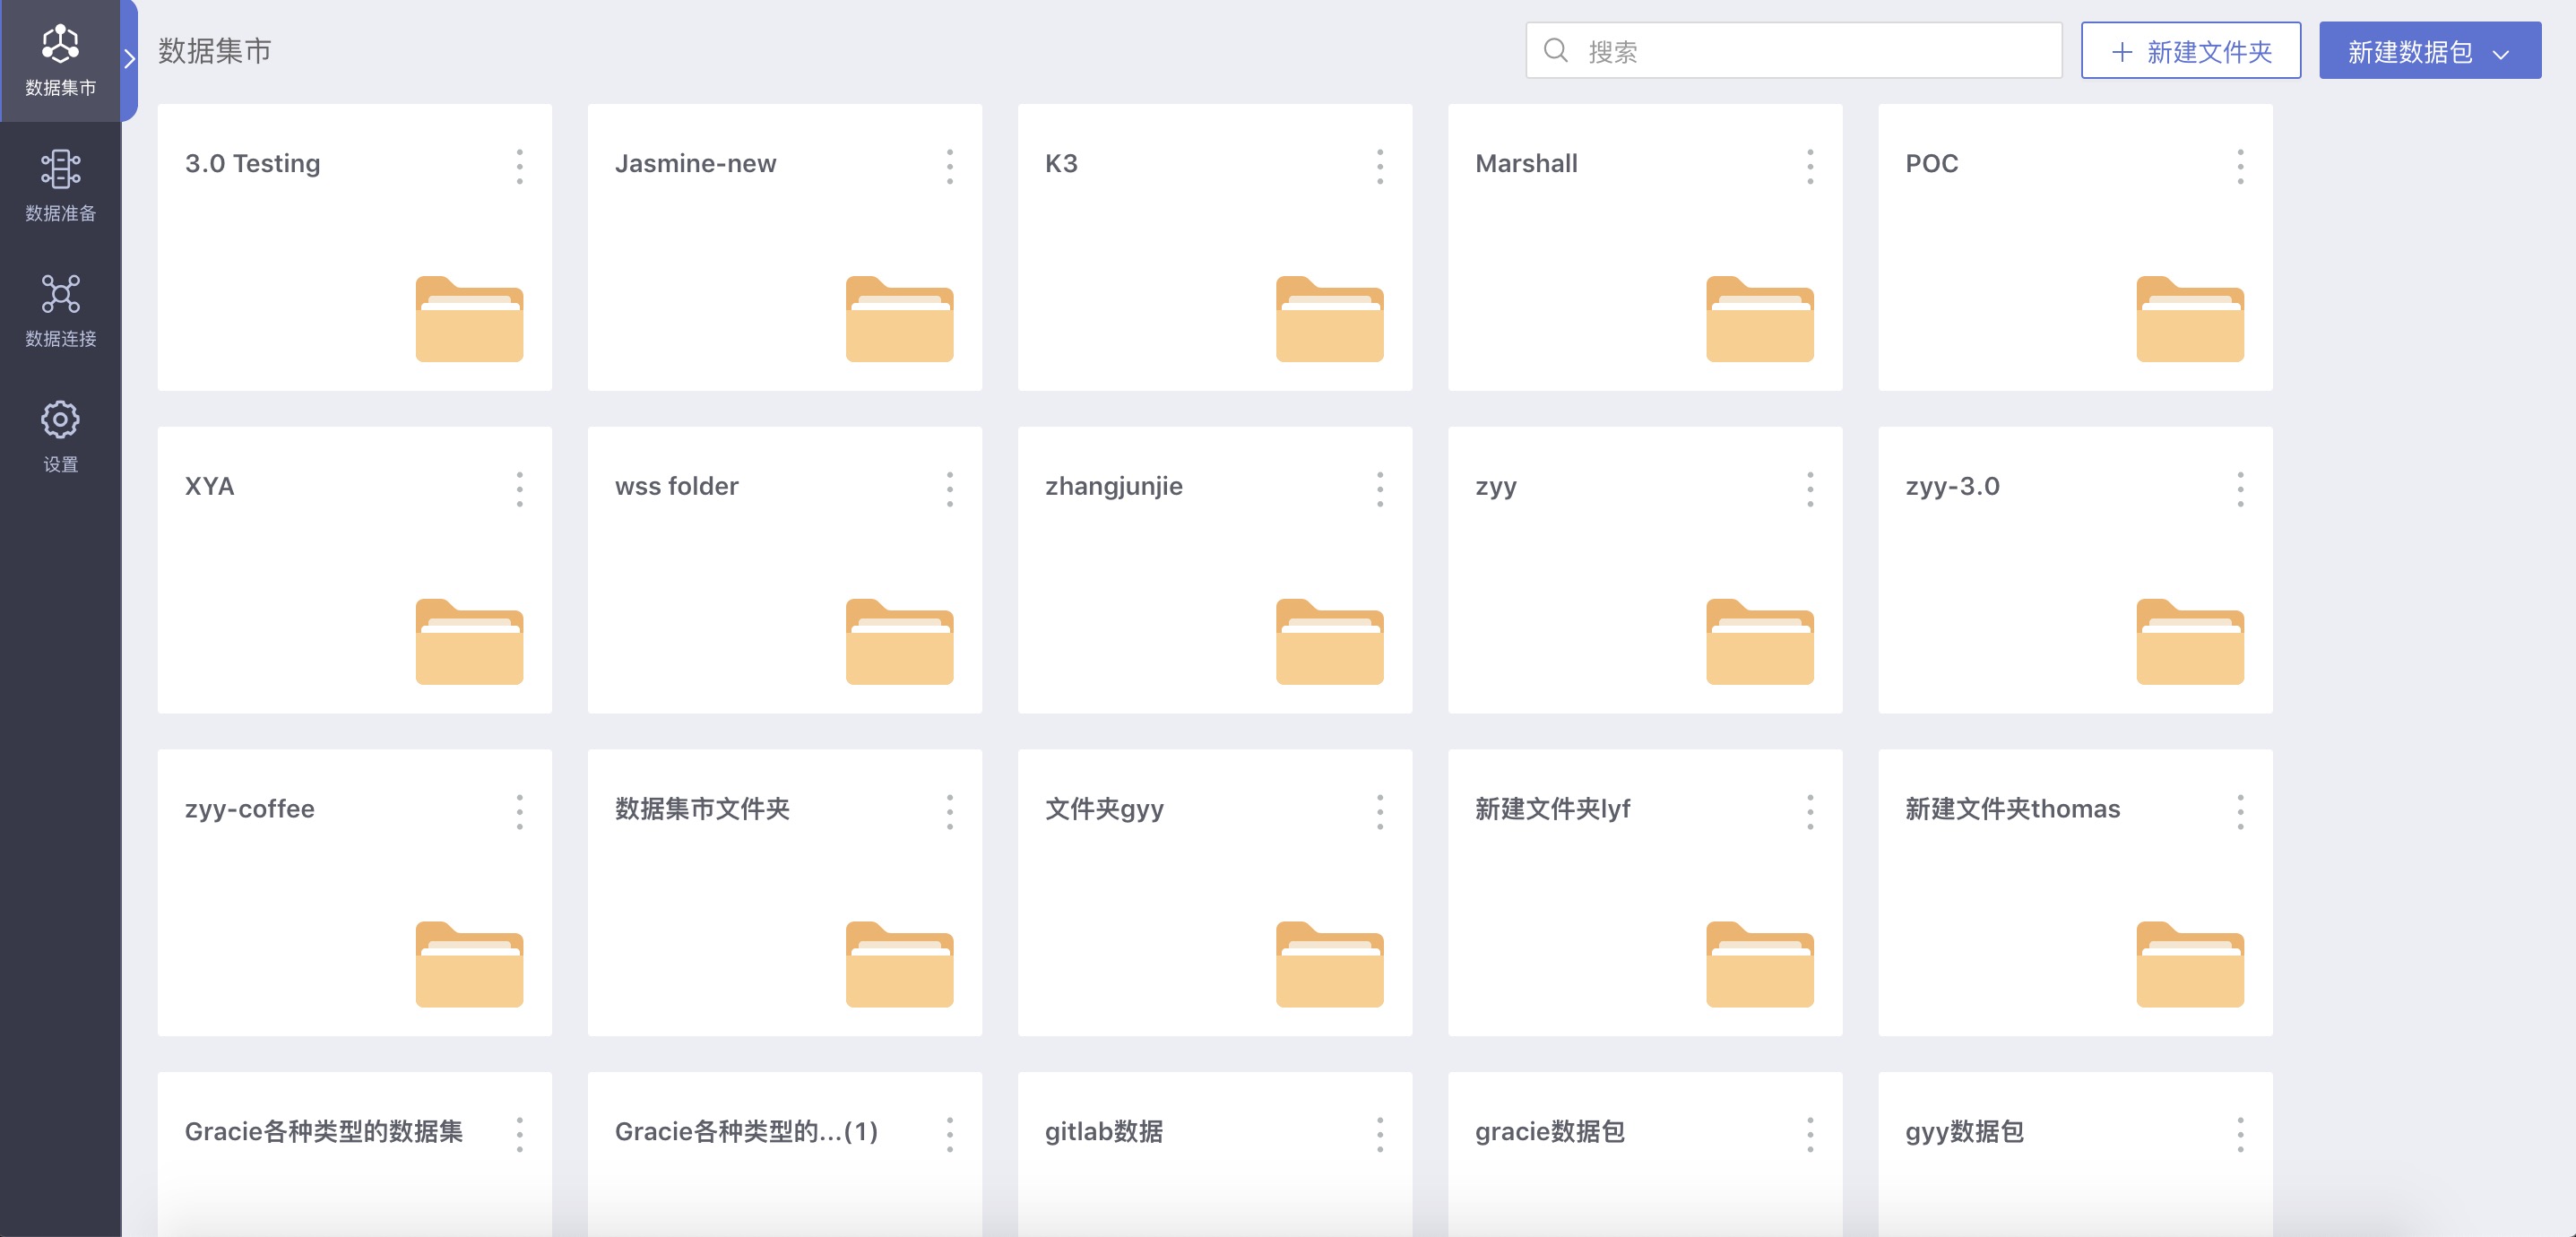
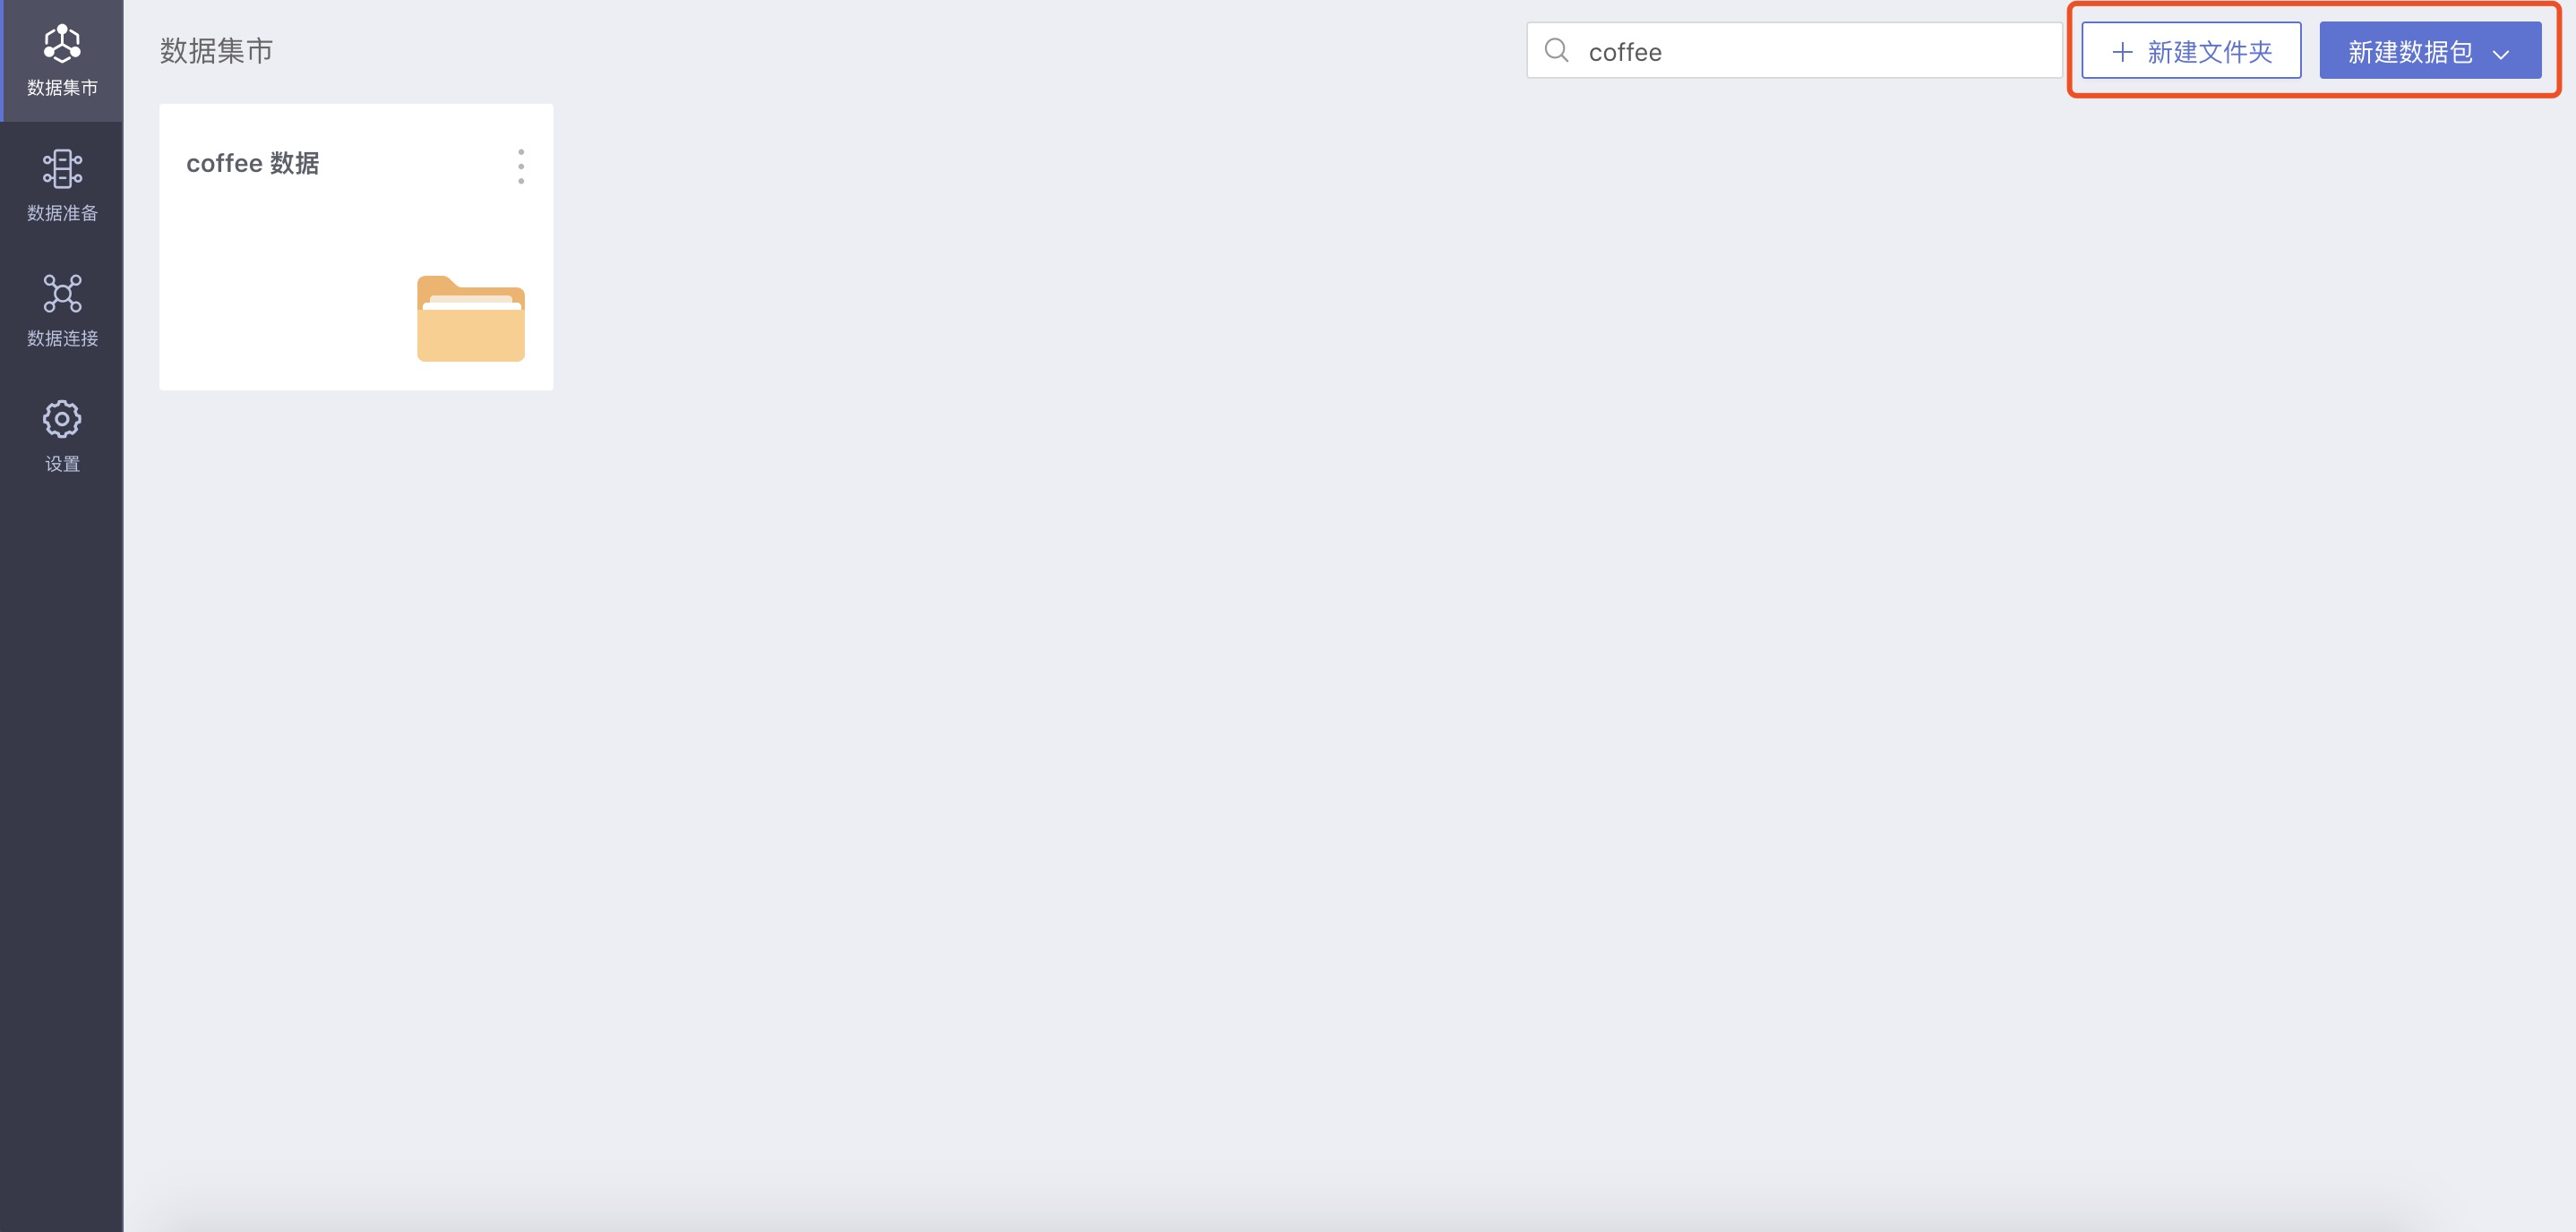
Create New Folder/Data Package
Those with System Management + Data Management roles create new folders or data packages in the data mart
Set Permission Management for the Folder or Data Package
After completing the above steps, you can set permission management for the folder or data package in the three-dot menu on the cover page of the app mart list:
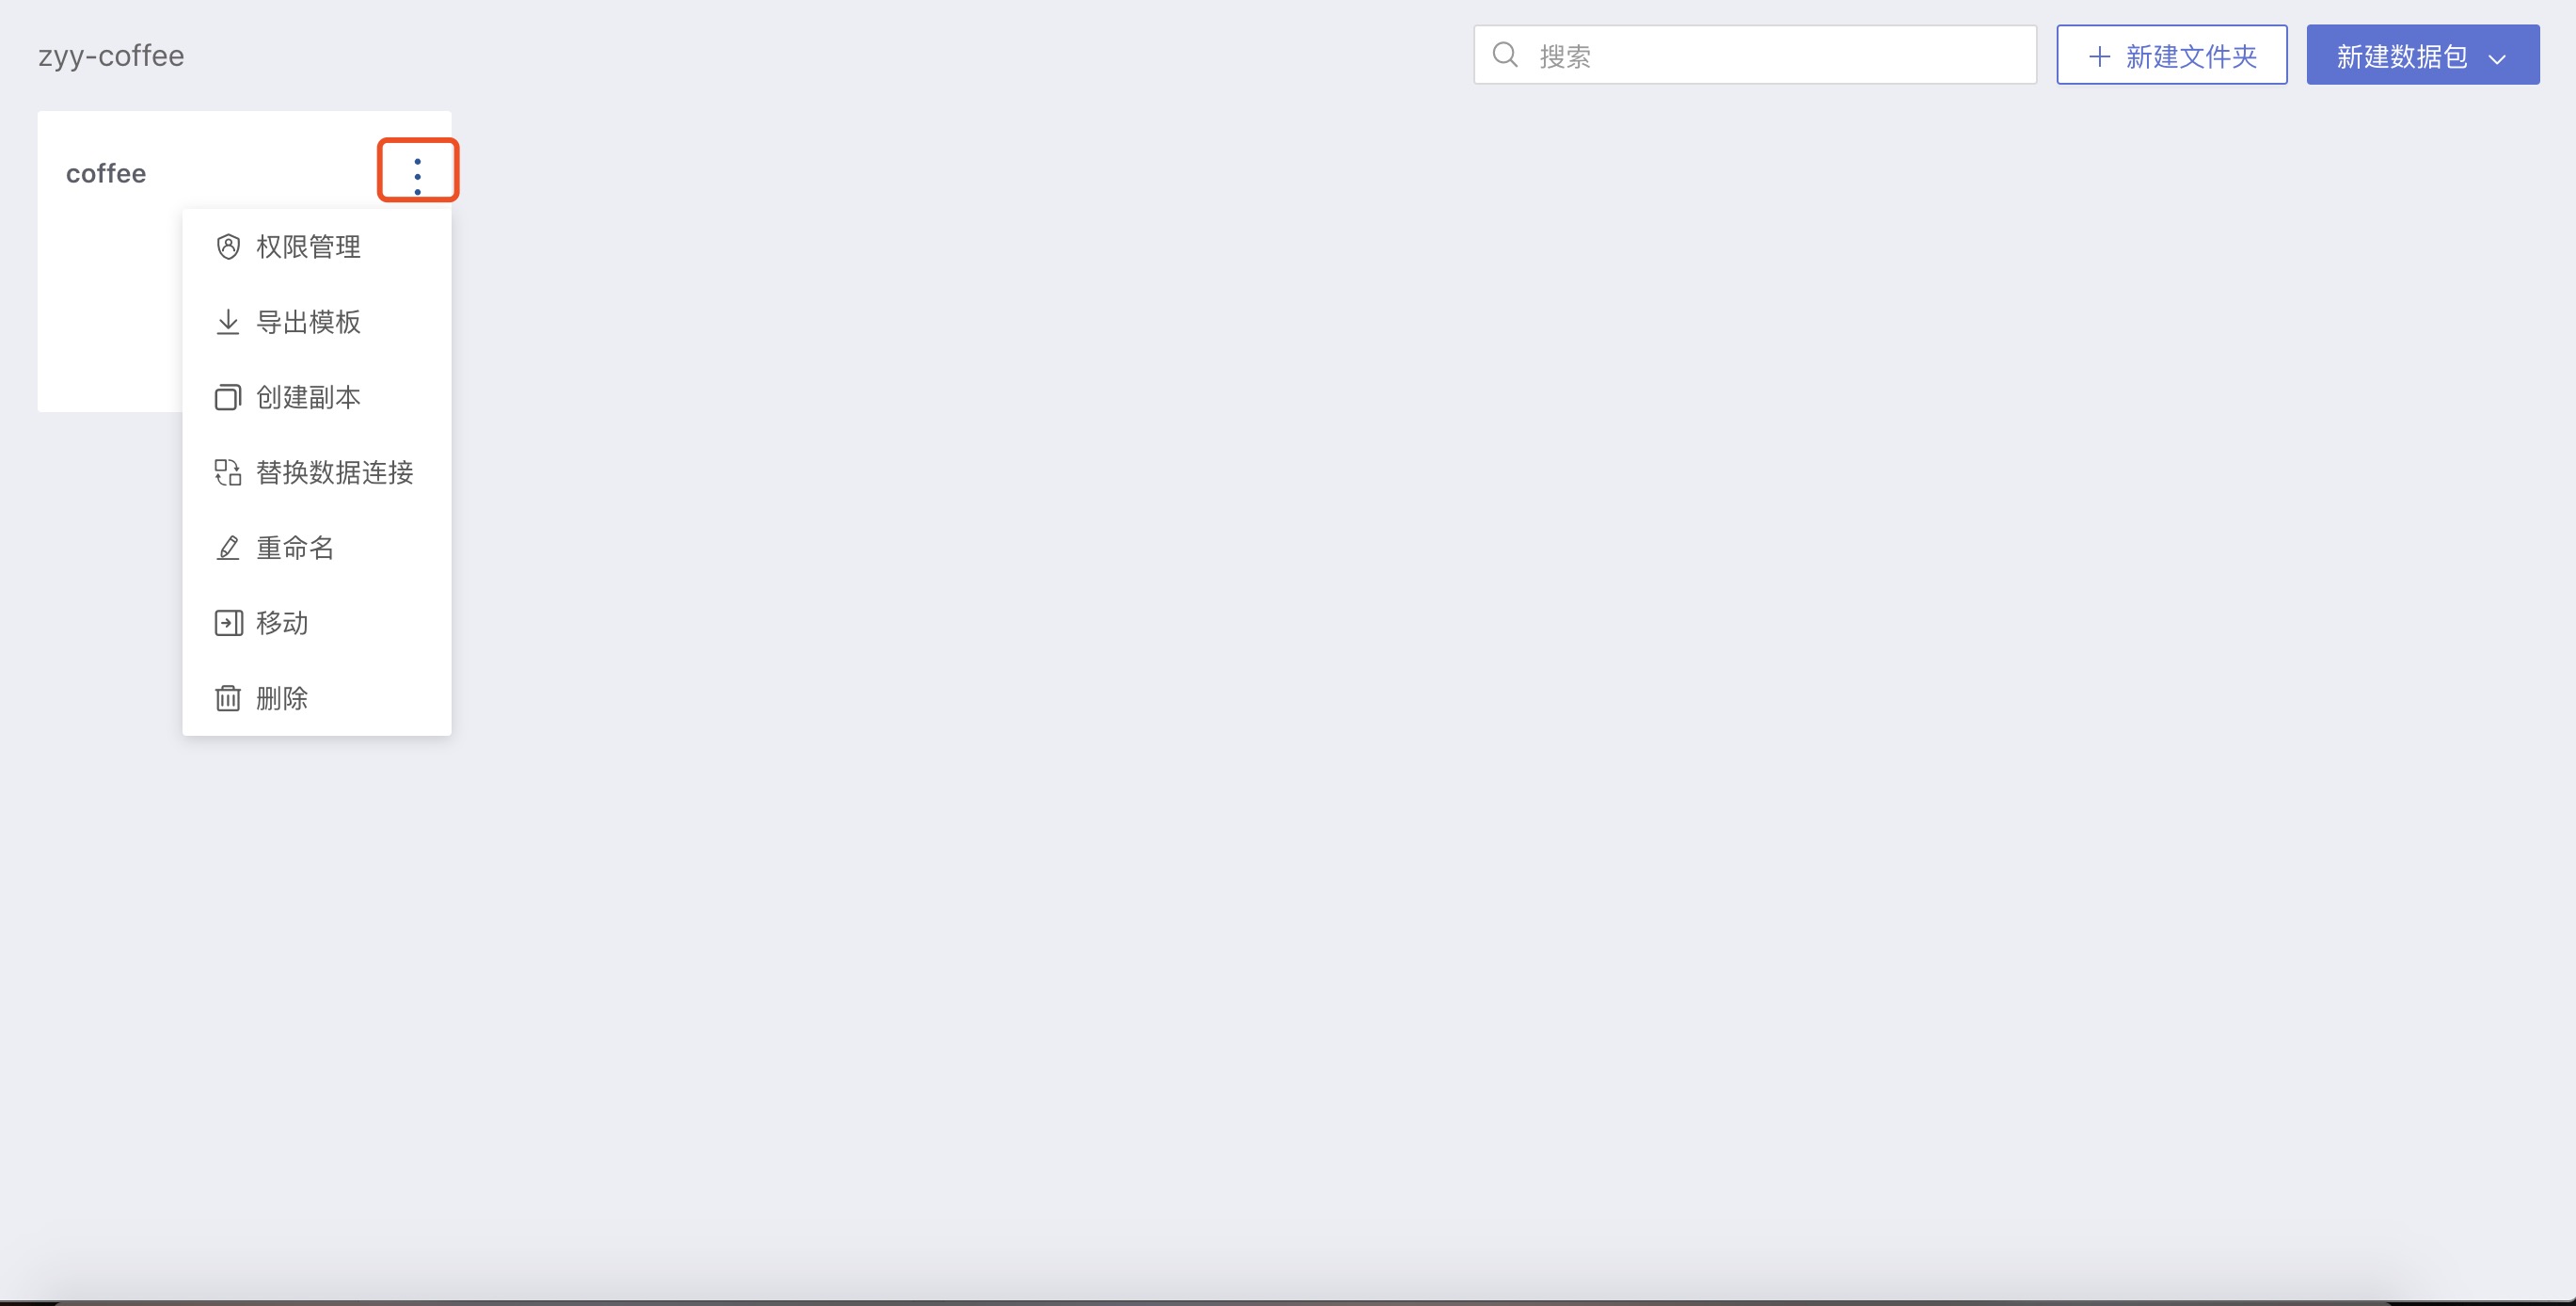
Click Permission Management, and in the pop-up window, set the management and viewing permissions for the data package:
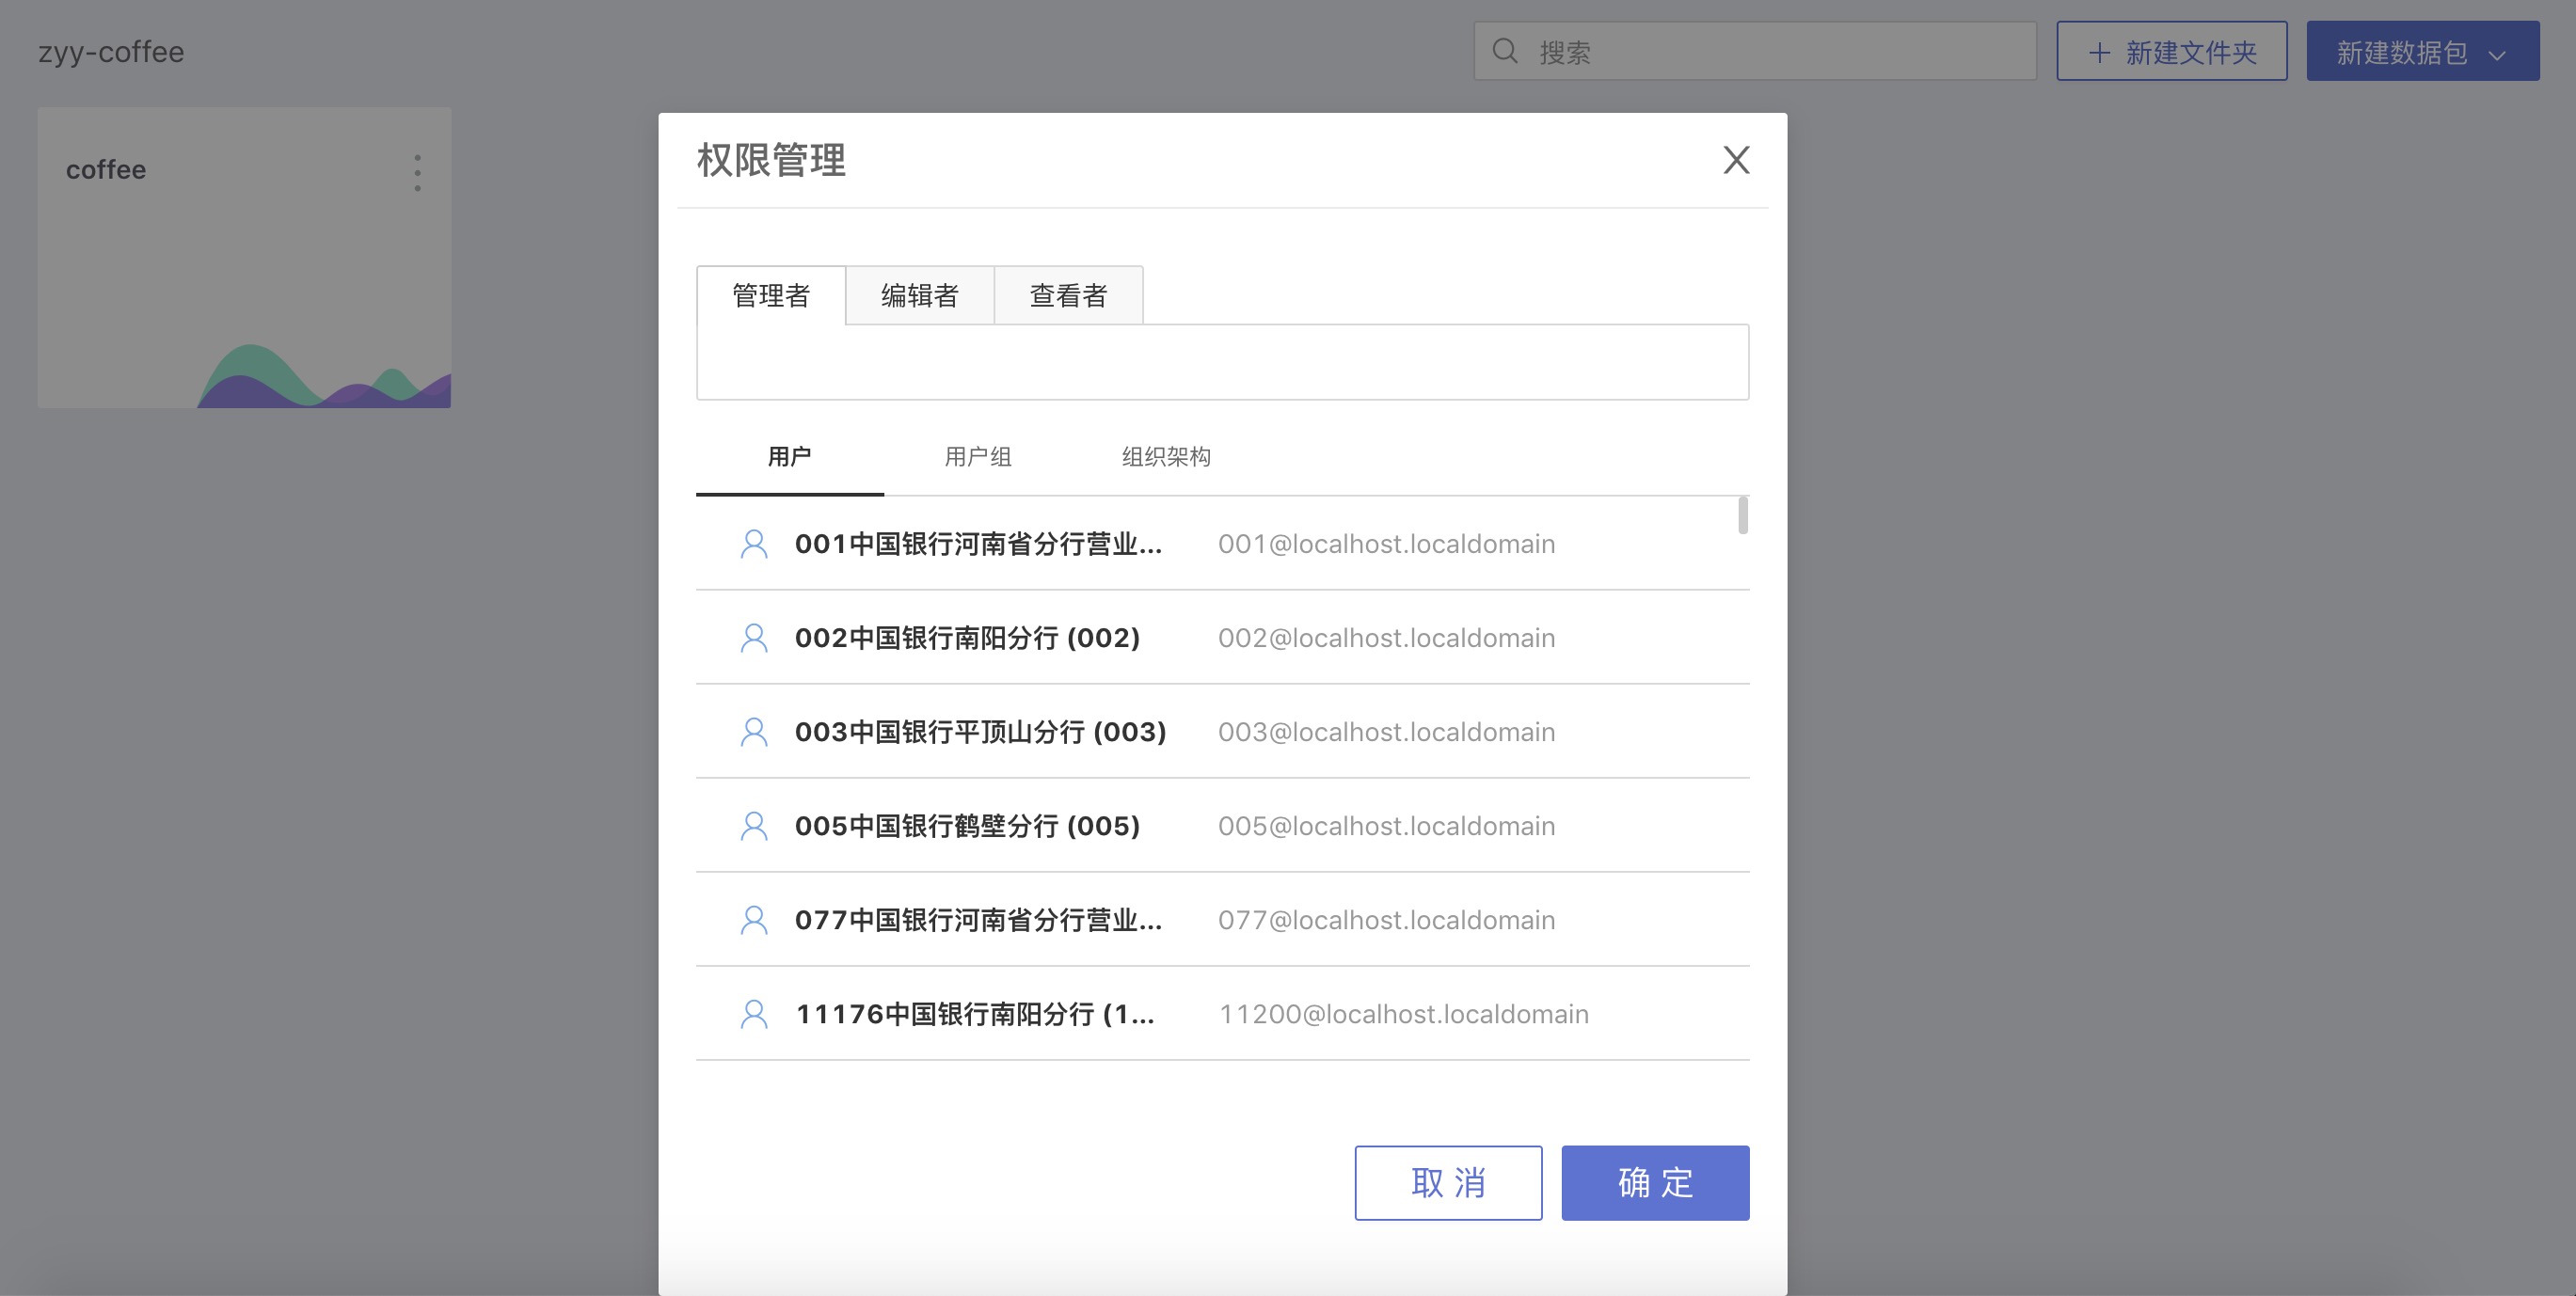
Administrator: Has the same permissions as the folder's creator, can modify the folder's access permissions, view, use, edit data packages in the folder, and datasets within the data packages;
Editor: Can only view, use, and edit data packages in the folder and datasets within the data packages;
Viewer: Can only view and use datasets within the folder and data packages.
Set specific permissions according to the different responsibilities between different departments in each company.
Create New Folder or Data Package
In the folder, you can continue to create new folders or data packages. Users with Administrator or Editor permissions can create folders and data packages in that folder.
Set Data Permissions for the Datasets in the Data Package
On the Settings page of the data package, you can set the permissions using which account the users will view the dataset data when viewing, using the data package. Users with Administrator or Editor permissions of the folder in which the data package is located can set data permissions in the data package.
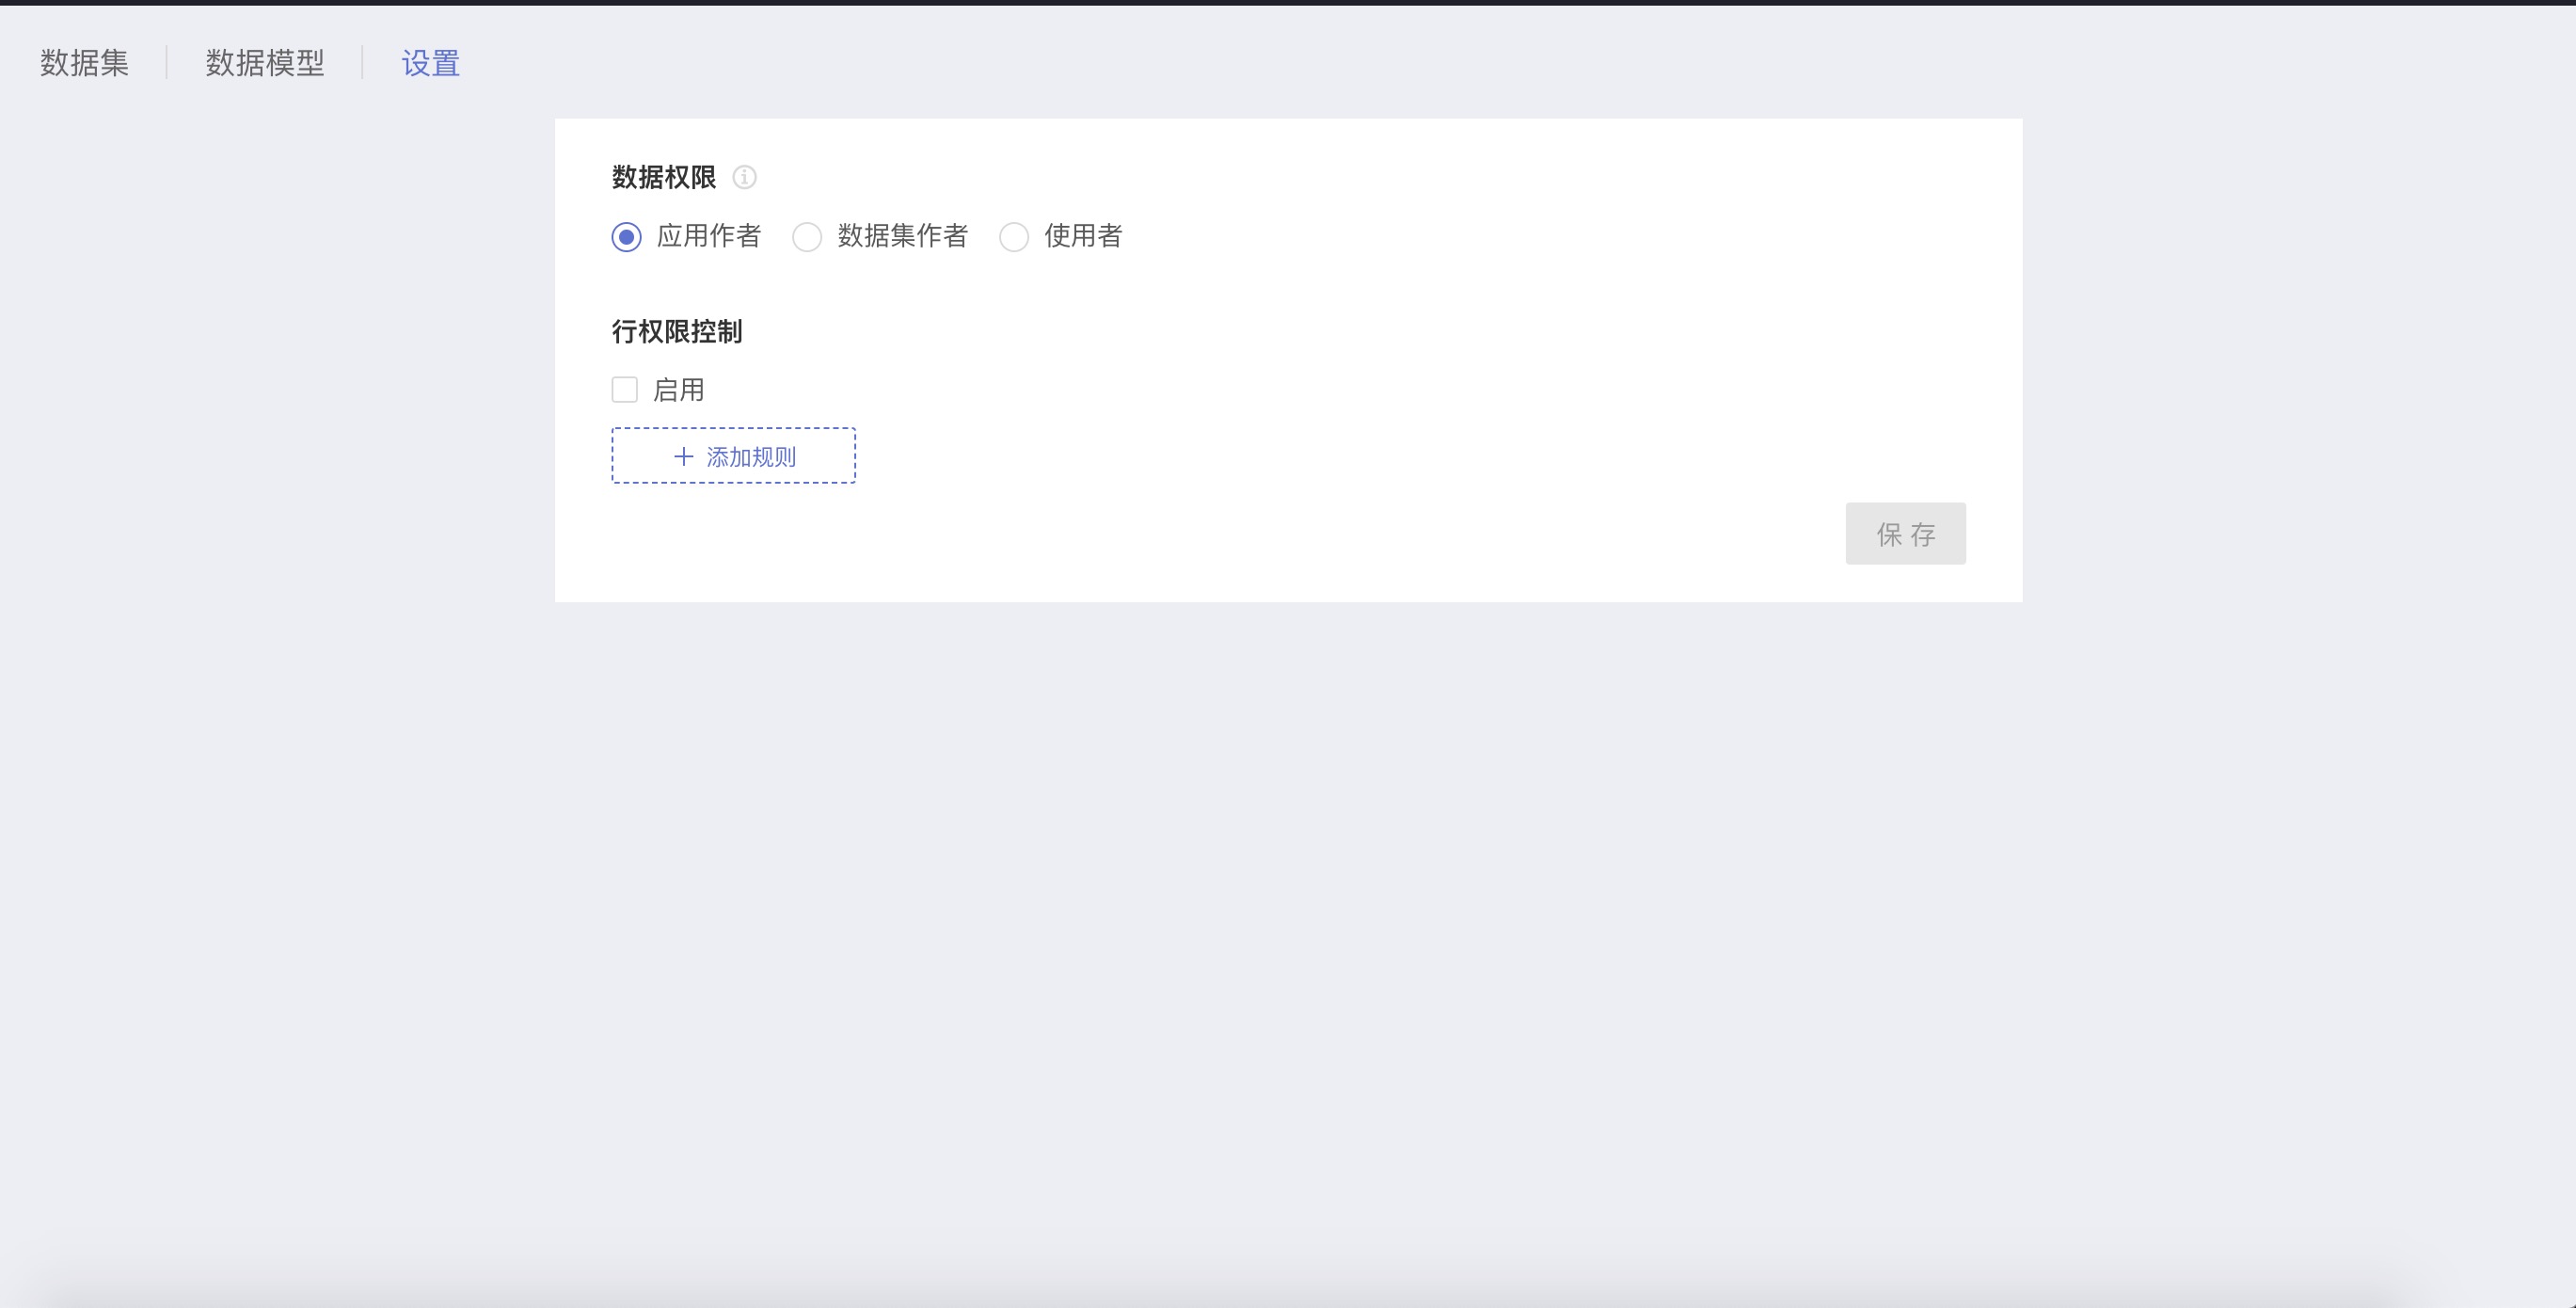
Application Author
The data of the application author that the visitors to the application see; permission control can be set.
Different users create datasets in the data package using the application author's data permissions on the data connection, regardless of their own permissions on the data connection.
Dataset Author
The visitors to the application see the dataset author's data; permission control can be set.
Different users create data in the data package using their data permissions on the data connection; when different users view and use the dataset, they get data according to the dataset author's permissions.
User
The visitors to the application see their own data.
When different users create datasets in the data package, view, and edit datasets, they all use their permissions on the data connection.

We recommend that when setting data permissions for the data package, use the “Application Author's” data permissions. Avoid the situation of no data in the subsequent dataset copying, multi-table joining, etc., due to everyone's different permissions.
When using "Dataset Author" or "User" data permissions, it is easy to encounter doubts in the process:
User A creates Dataset A, and User B creates Dataset B;
User C makes a copy of datasets A and B during data processing:
The copy dataset has no data: User C does not have permission for the data connection used by Datasets A and B;
The copy dataset data are completely inconsistent with Datasets A and B: User C's permissions on the data connection are different from User A and B;
User D processes data; Datasets A and B are used for multi-table joining to generate the Fusion dataset
The Fusion dataset has no data: User D's inconsistent permissions in the data connections of Datasets A and B lead to the dataset having no data after the join;
The Fusion dataset data have no overlap with Datasets A and B: User D's inconsistent permissions in the data connections of Datasets A and B lead to completely non-overlapping data in the dataset after the join;
After completing the above-mentioned work from 1 to 4, the tree structure of folders in the data mart, the permission management of folders/data packages, and the data permissions of datasets in the data package are all set. That is to specify which users can access that folder/data package, can perform what operations on the folder/data package, and can use which data in the data package
Next, data processing within the data package must be completed
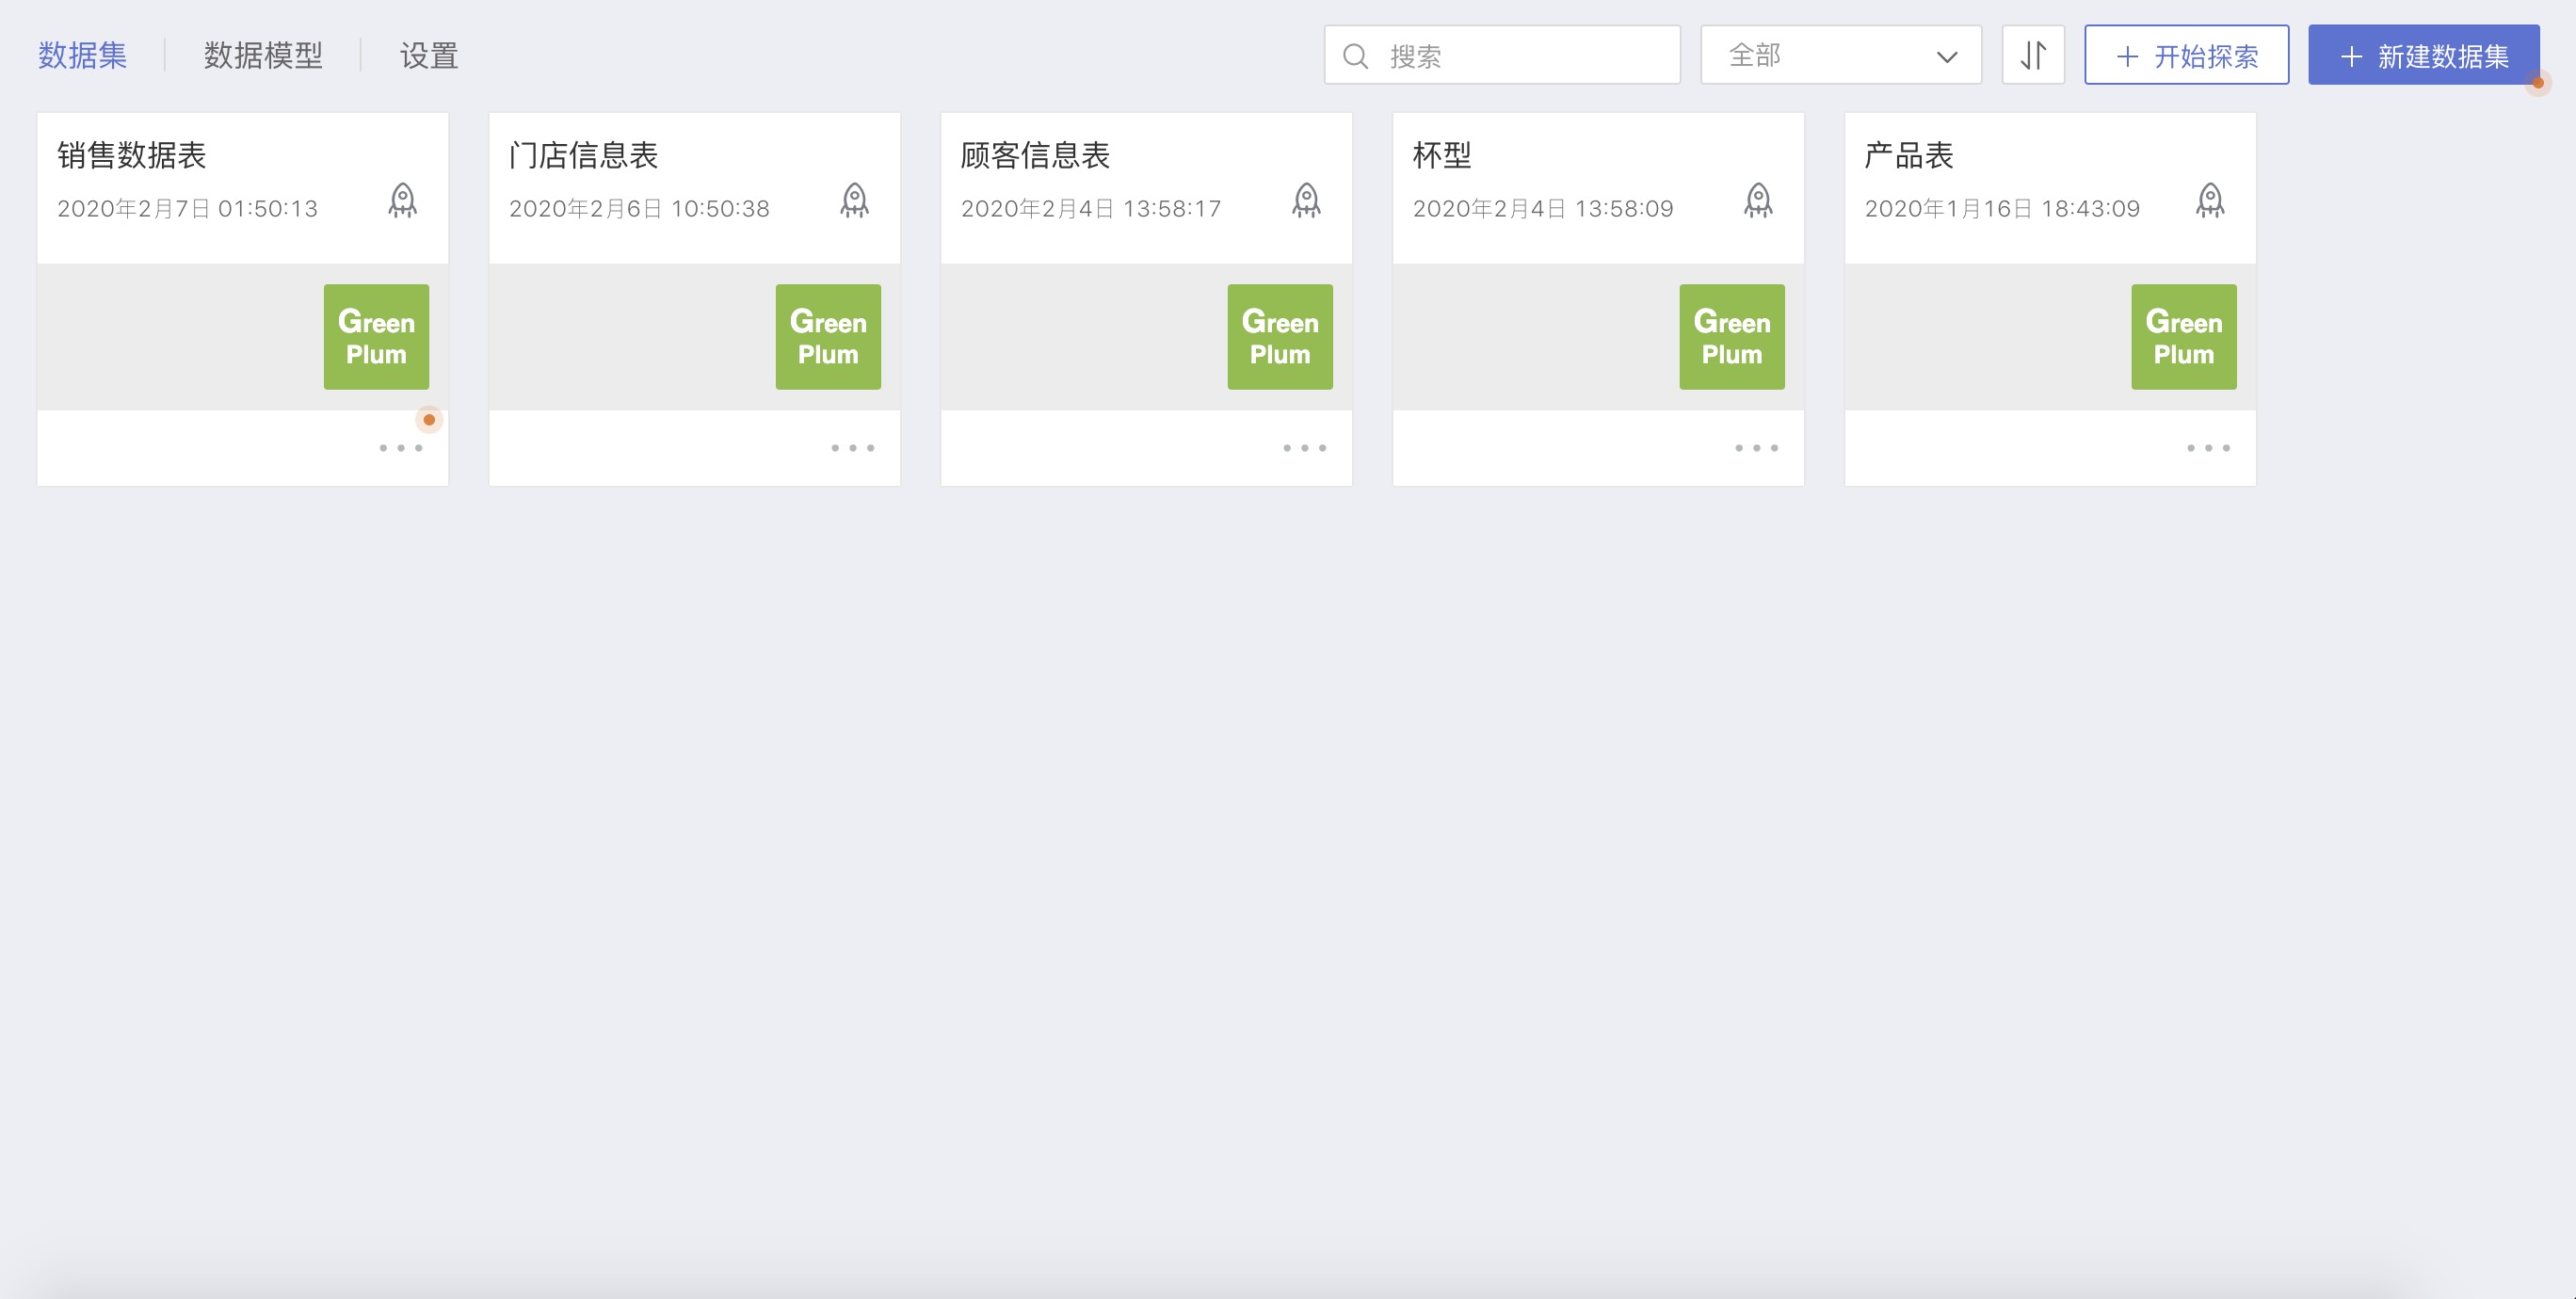
Create New Dataset
First, create a dataset in the data mart:
Data Processing
Data Processing of the Dataset
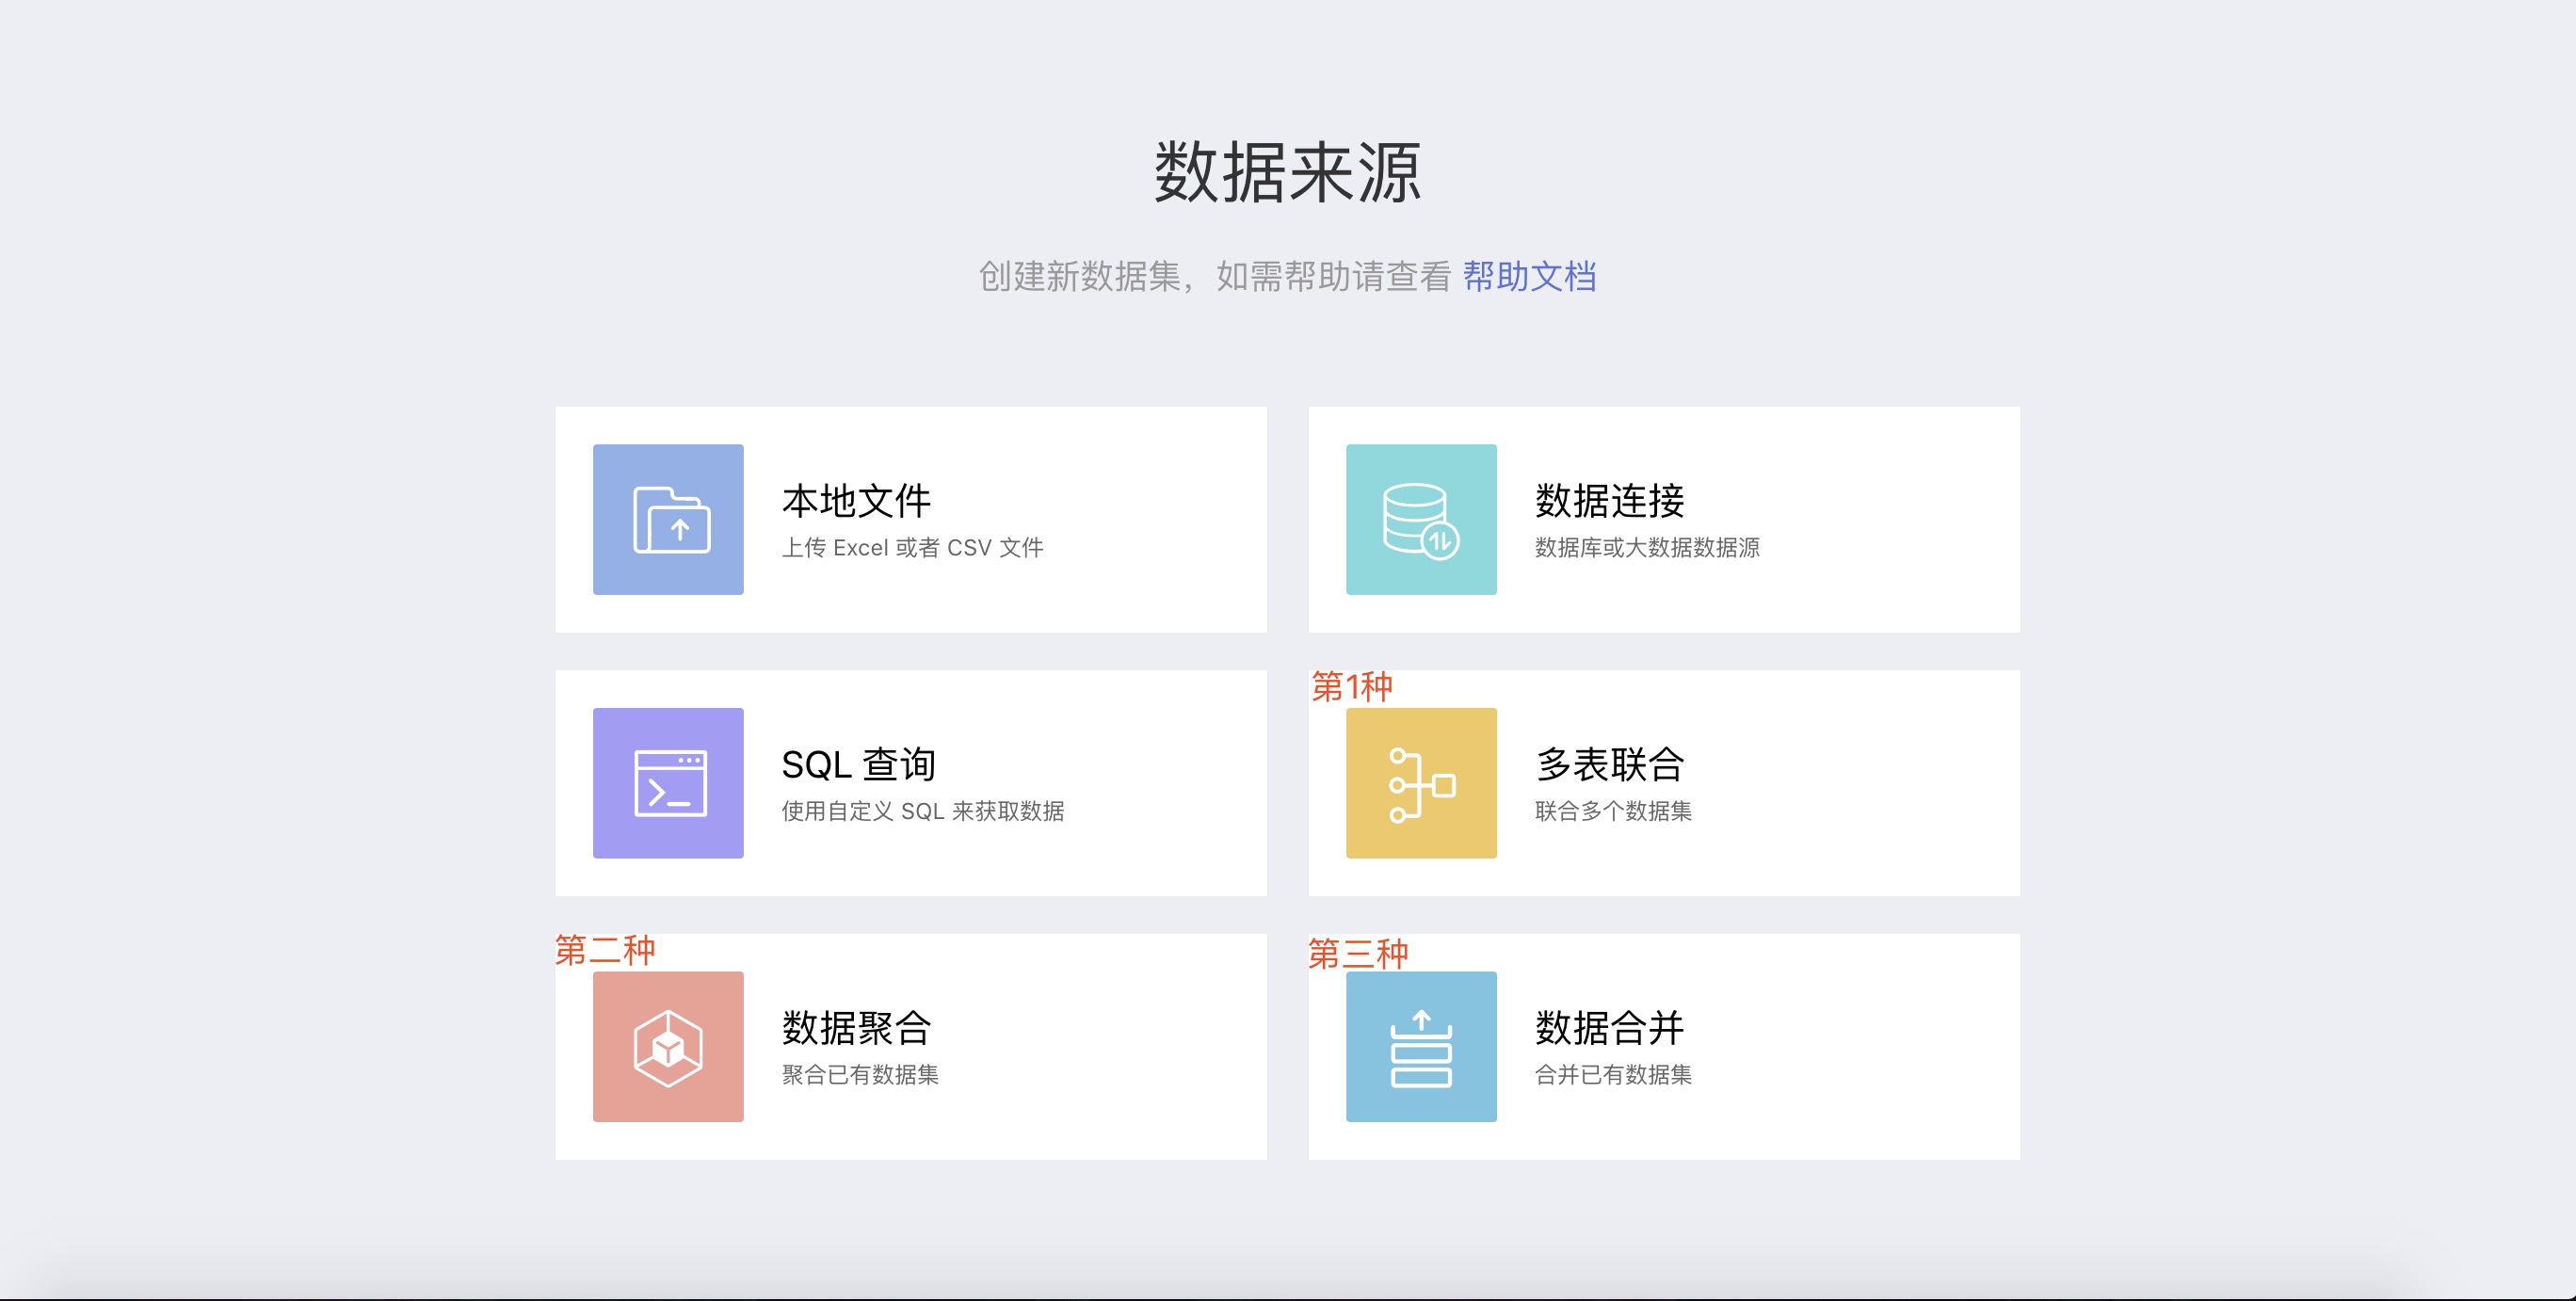
- Multi-Table Joining
The SENSE system provides a powerful FUSION feature, which through the correspondence of specific fields between datasets, can combine multiple datasets through multi-table joining to generate a wide table.
Data Aggregation
On the basis of already created datasets, create datasets through data aggregation, selecting only the fields of interest from the original dataset, suitable for "data analysis" of datasets with many columns.
- Data Merge
When it is necessary to consolidate the data of multiple datasets into one dataset, the data feature can be used. Data merging generates a new dataset.
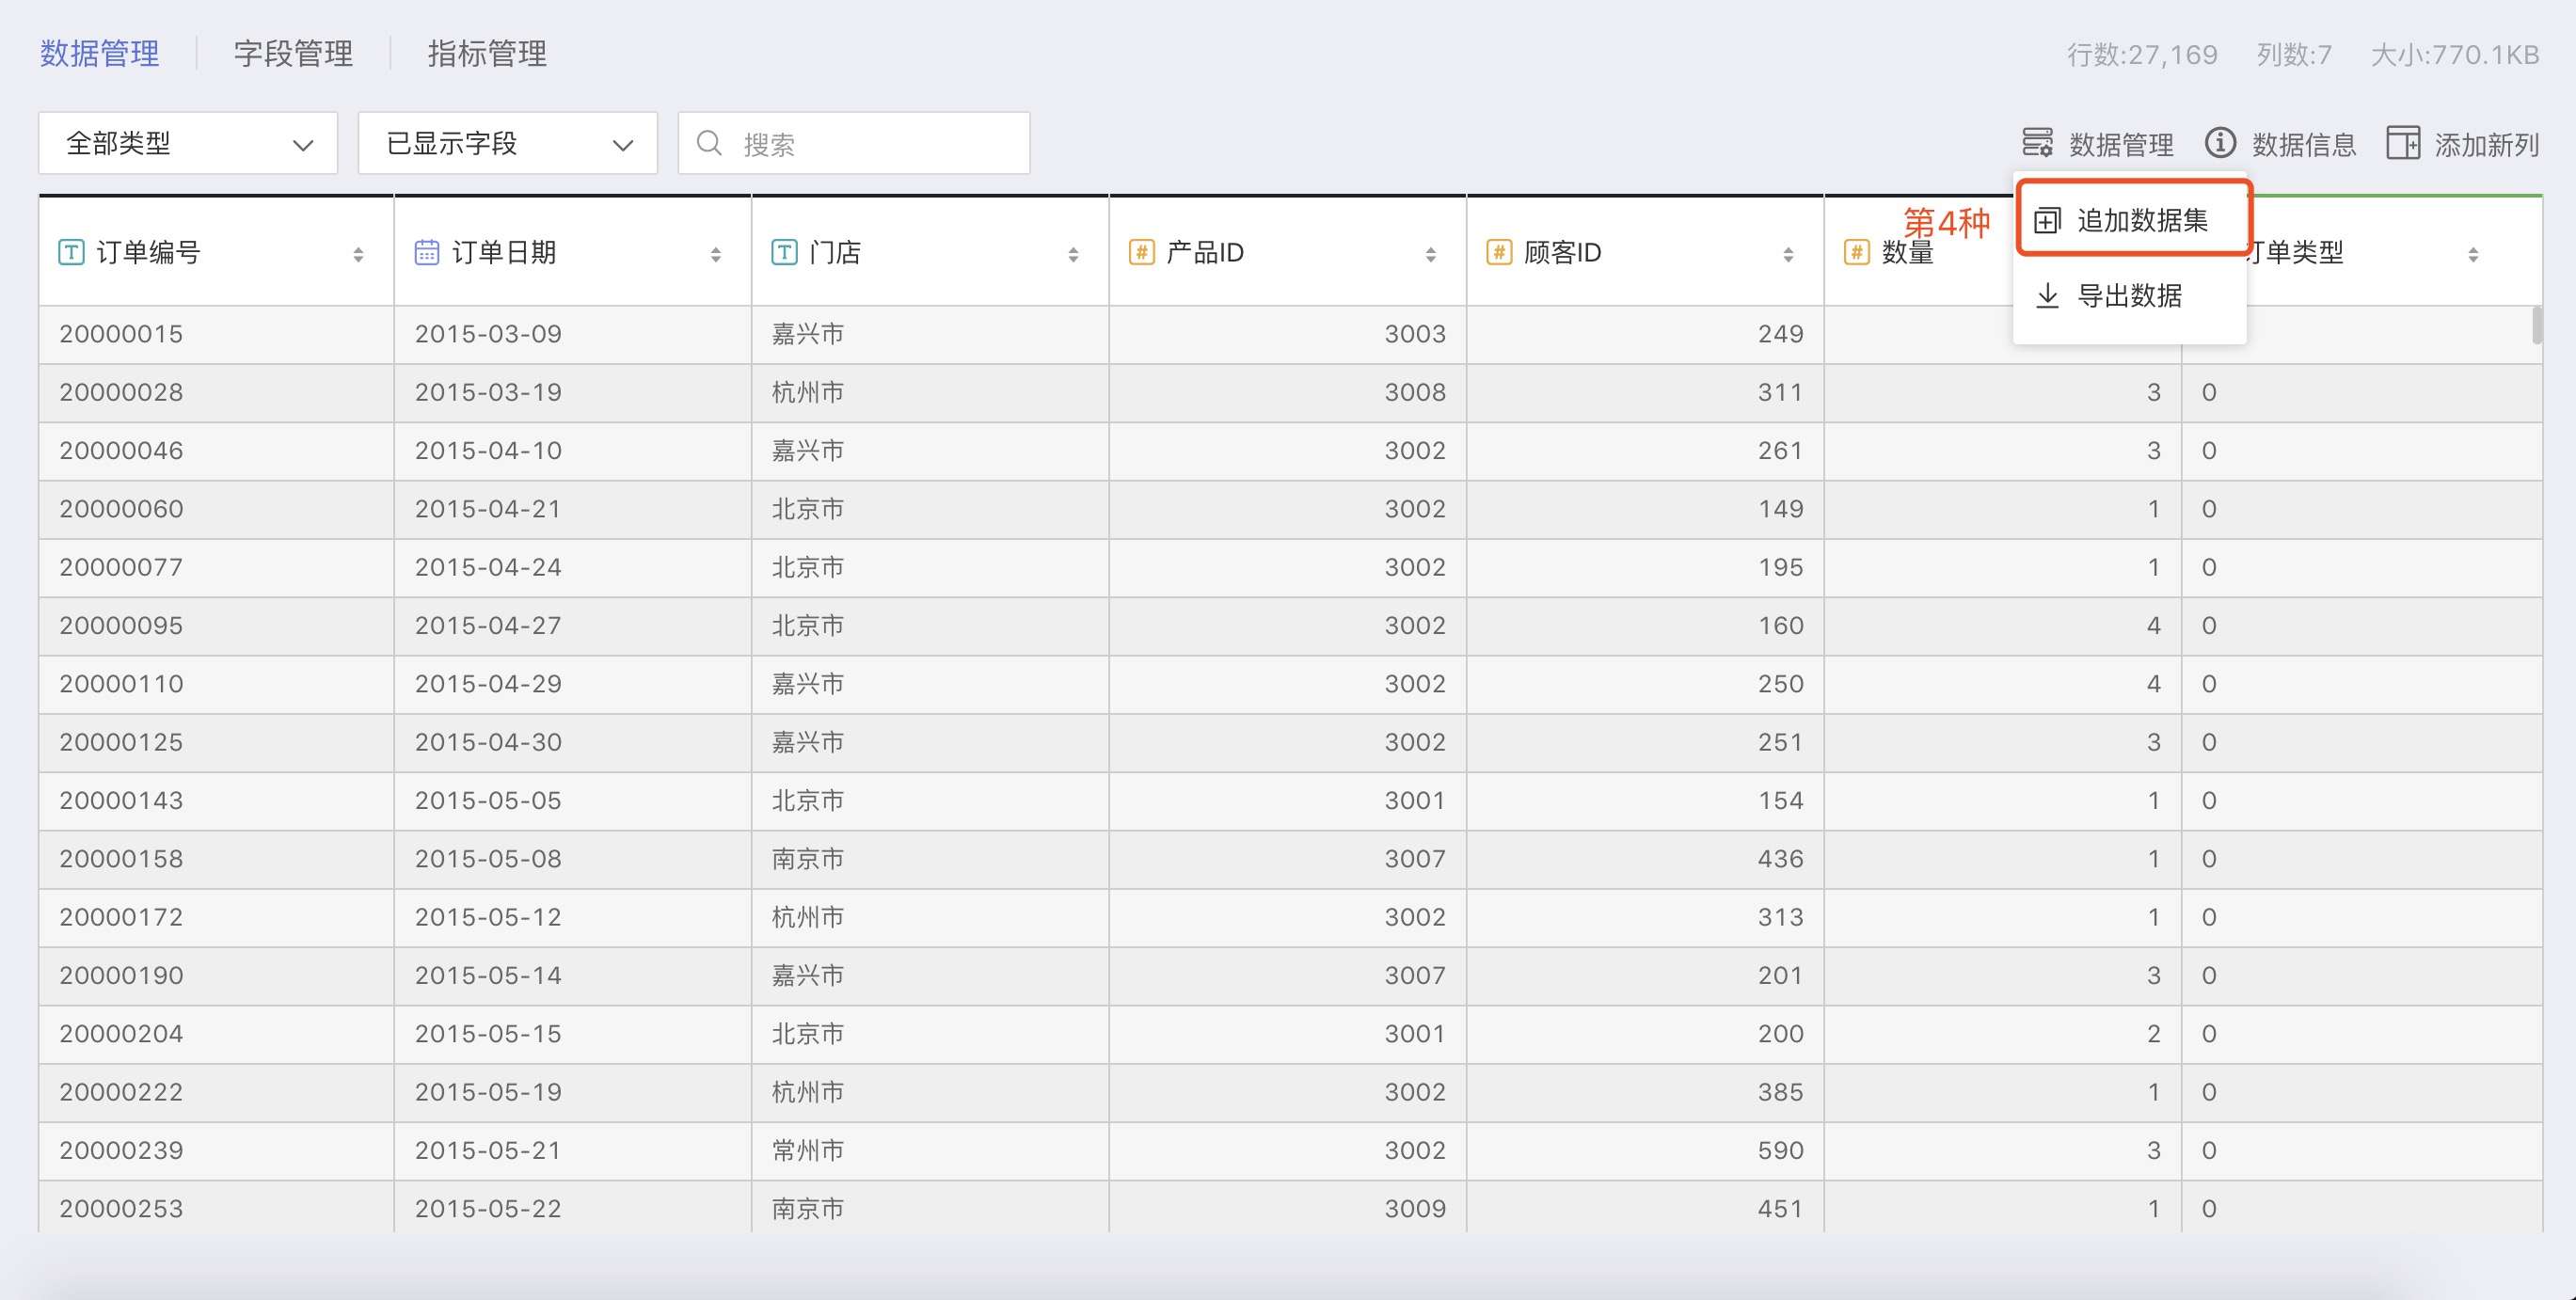
- Data Append
When it is necessary to consolidate the data of multiple datasets into one dataset, the data feature can be used. Data appending changes the base dataset directly, not generating a new dataset.
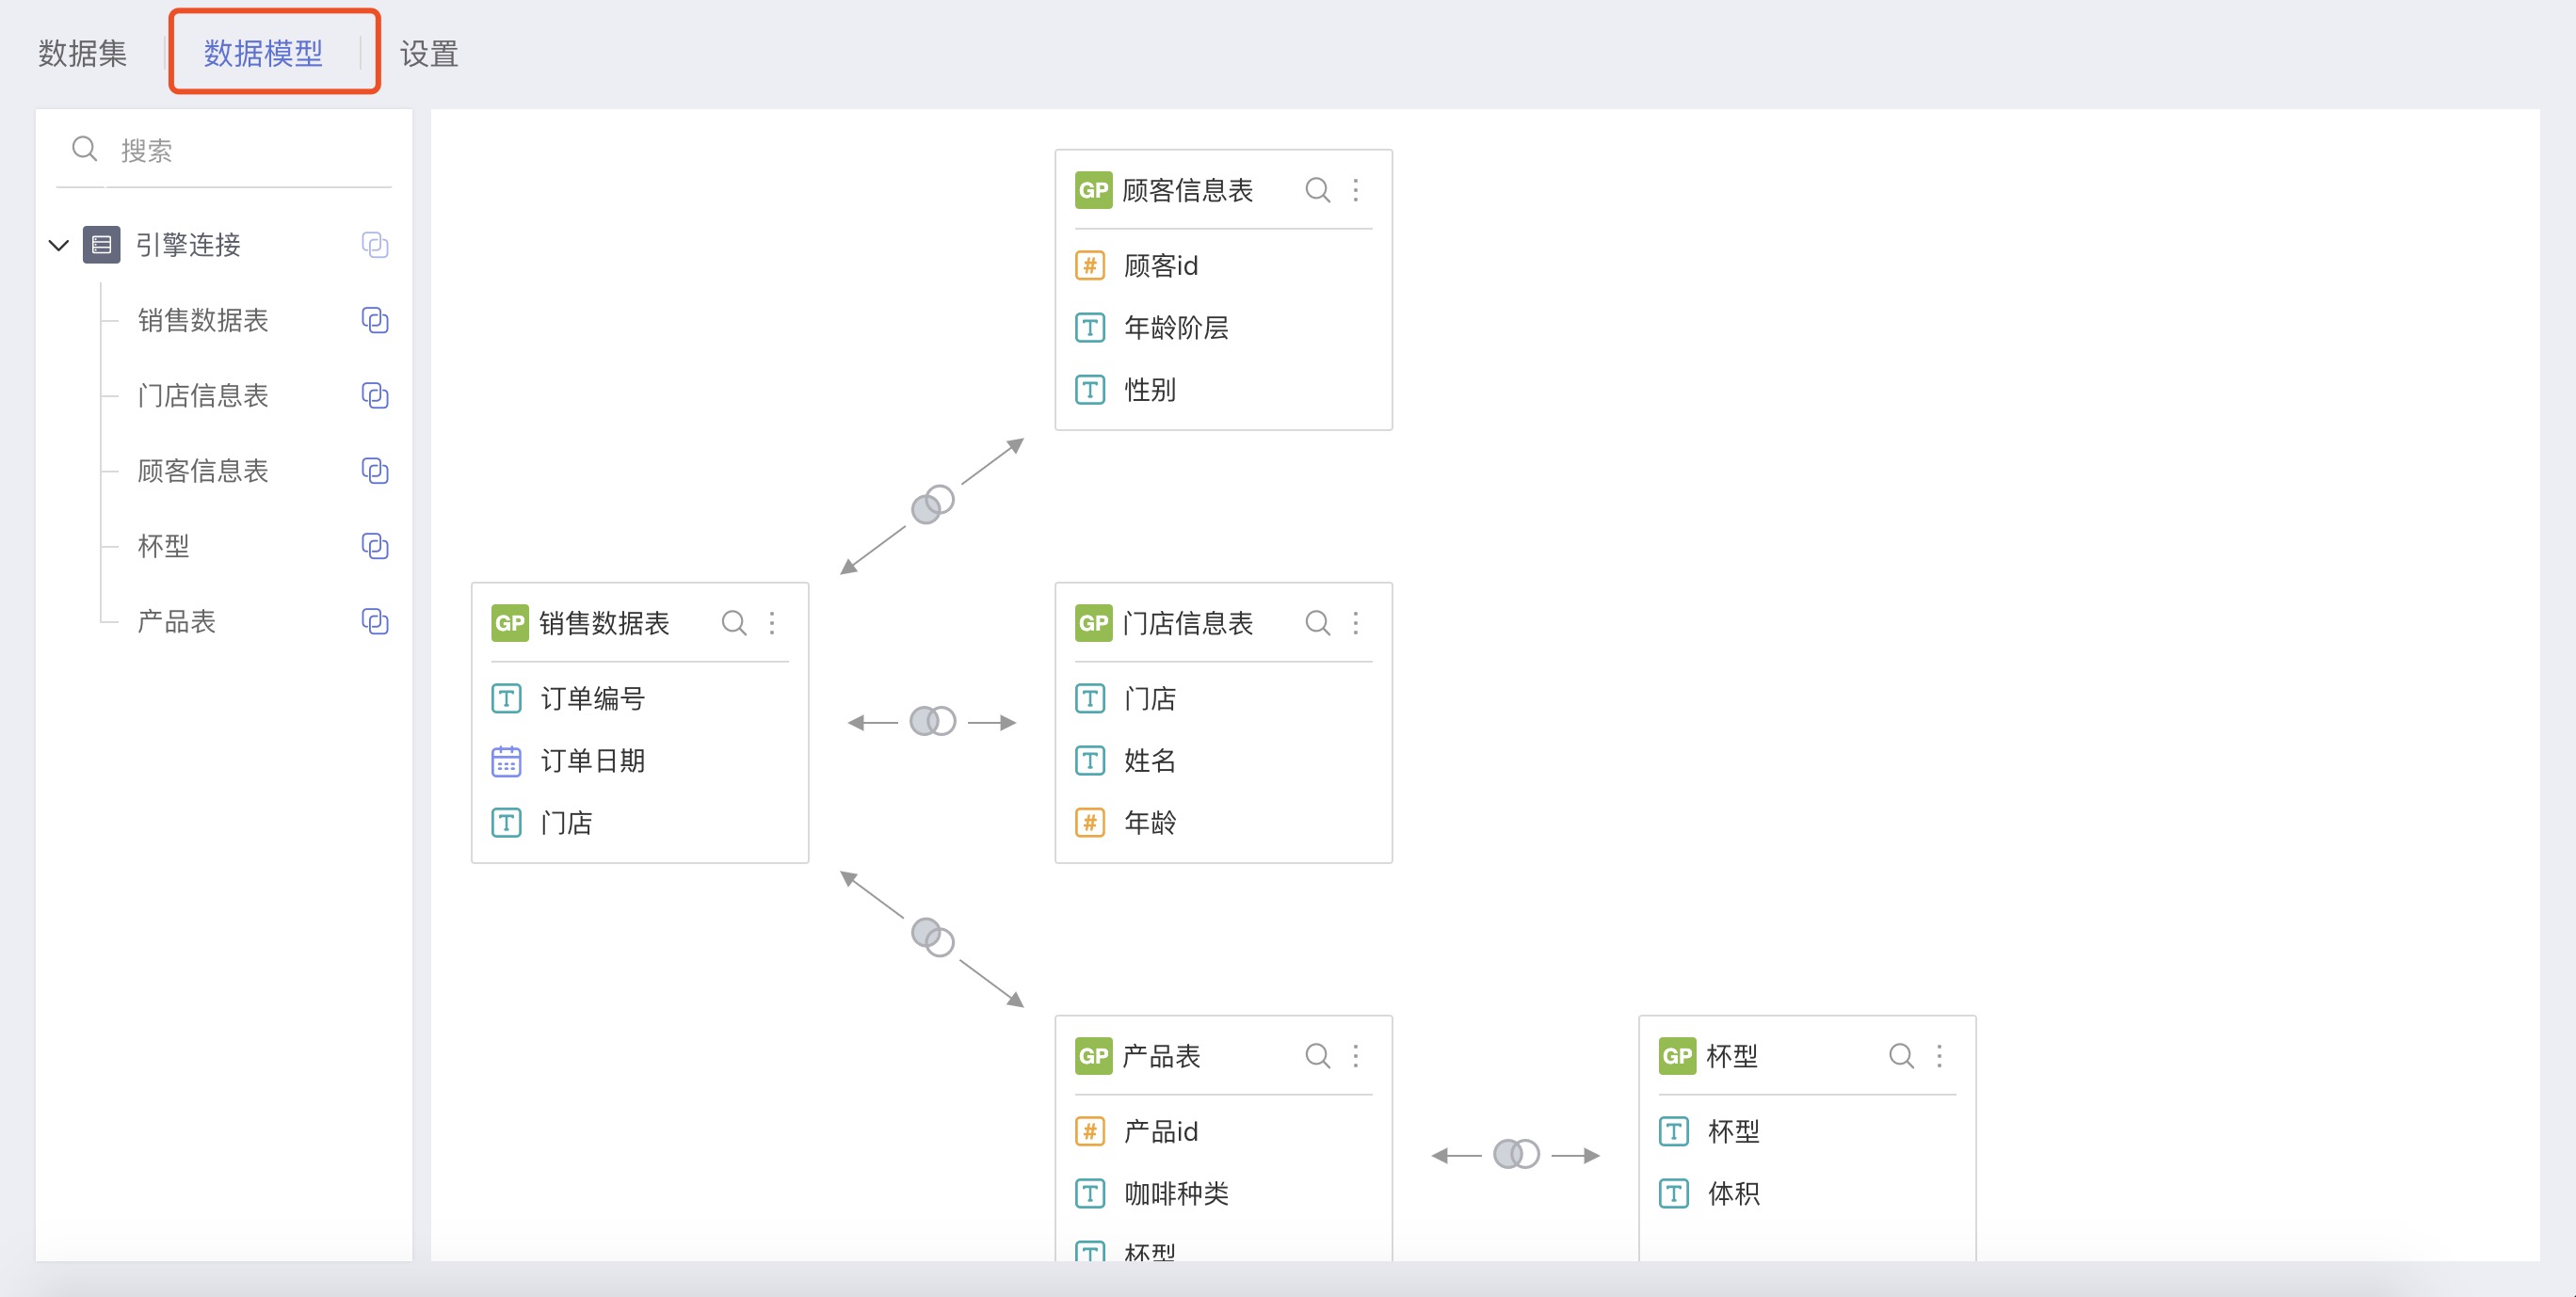
- Data Model
The data model, that is, the association analysis model, compared to the method of establishing a dataset for each association analysis, it provides great freedom and agility to data analytics: at any time, you can edit the associations in the model, and new model relationships can immediately affect the analysis results. For a detailed explanation, see Data Model
Data Processing Within the Dataset
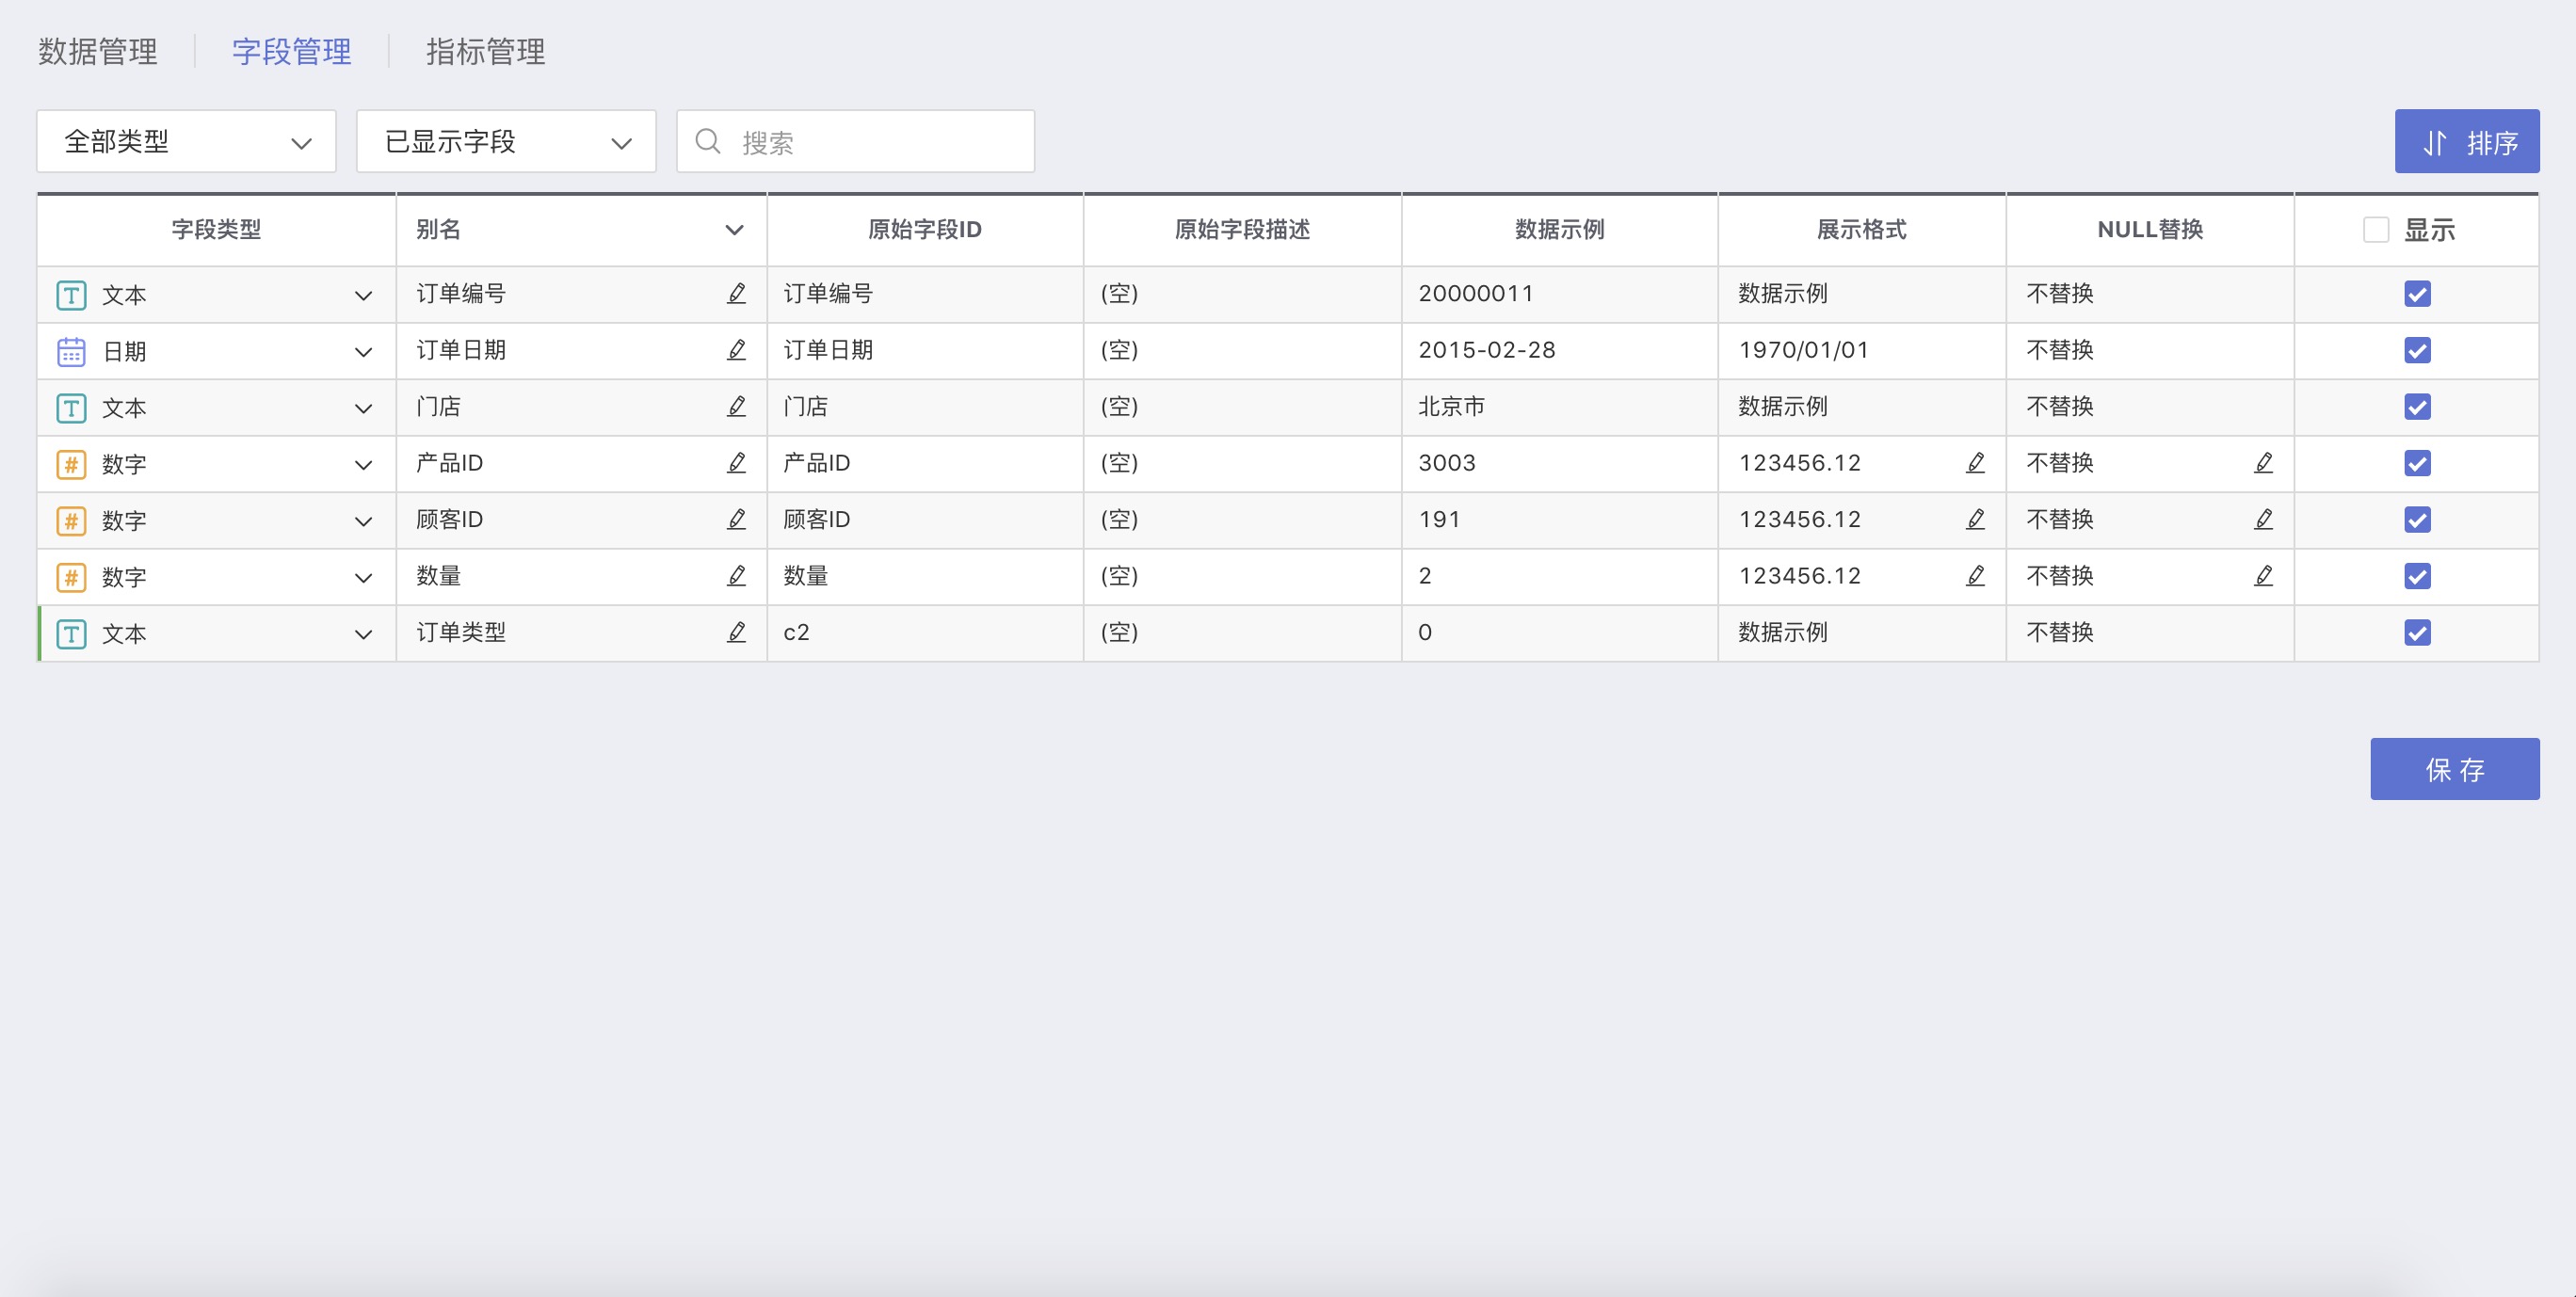
- Field Management
Field management is a major part of data preprocessing, including: modifying field aliases, batch modifying field names, modifying field types and formats, and setting whether to display, etc.
- Add New Column
Add new column is for processing the original fields in the dataset, ultimately yielding new fields.
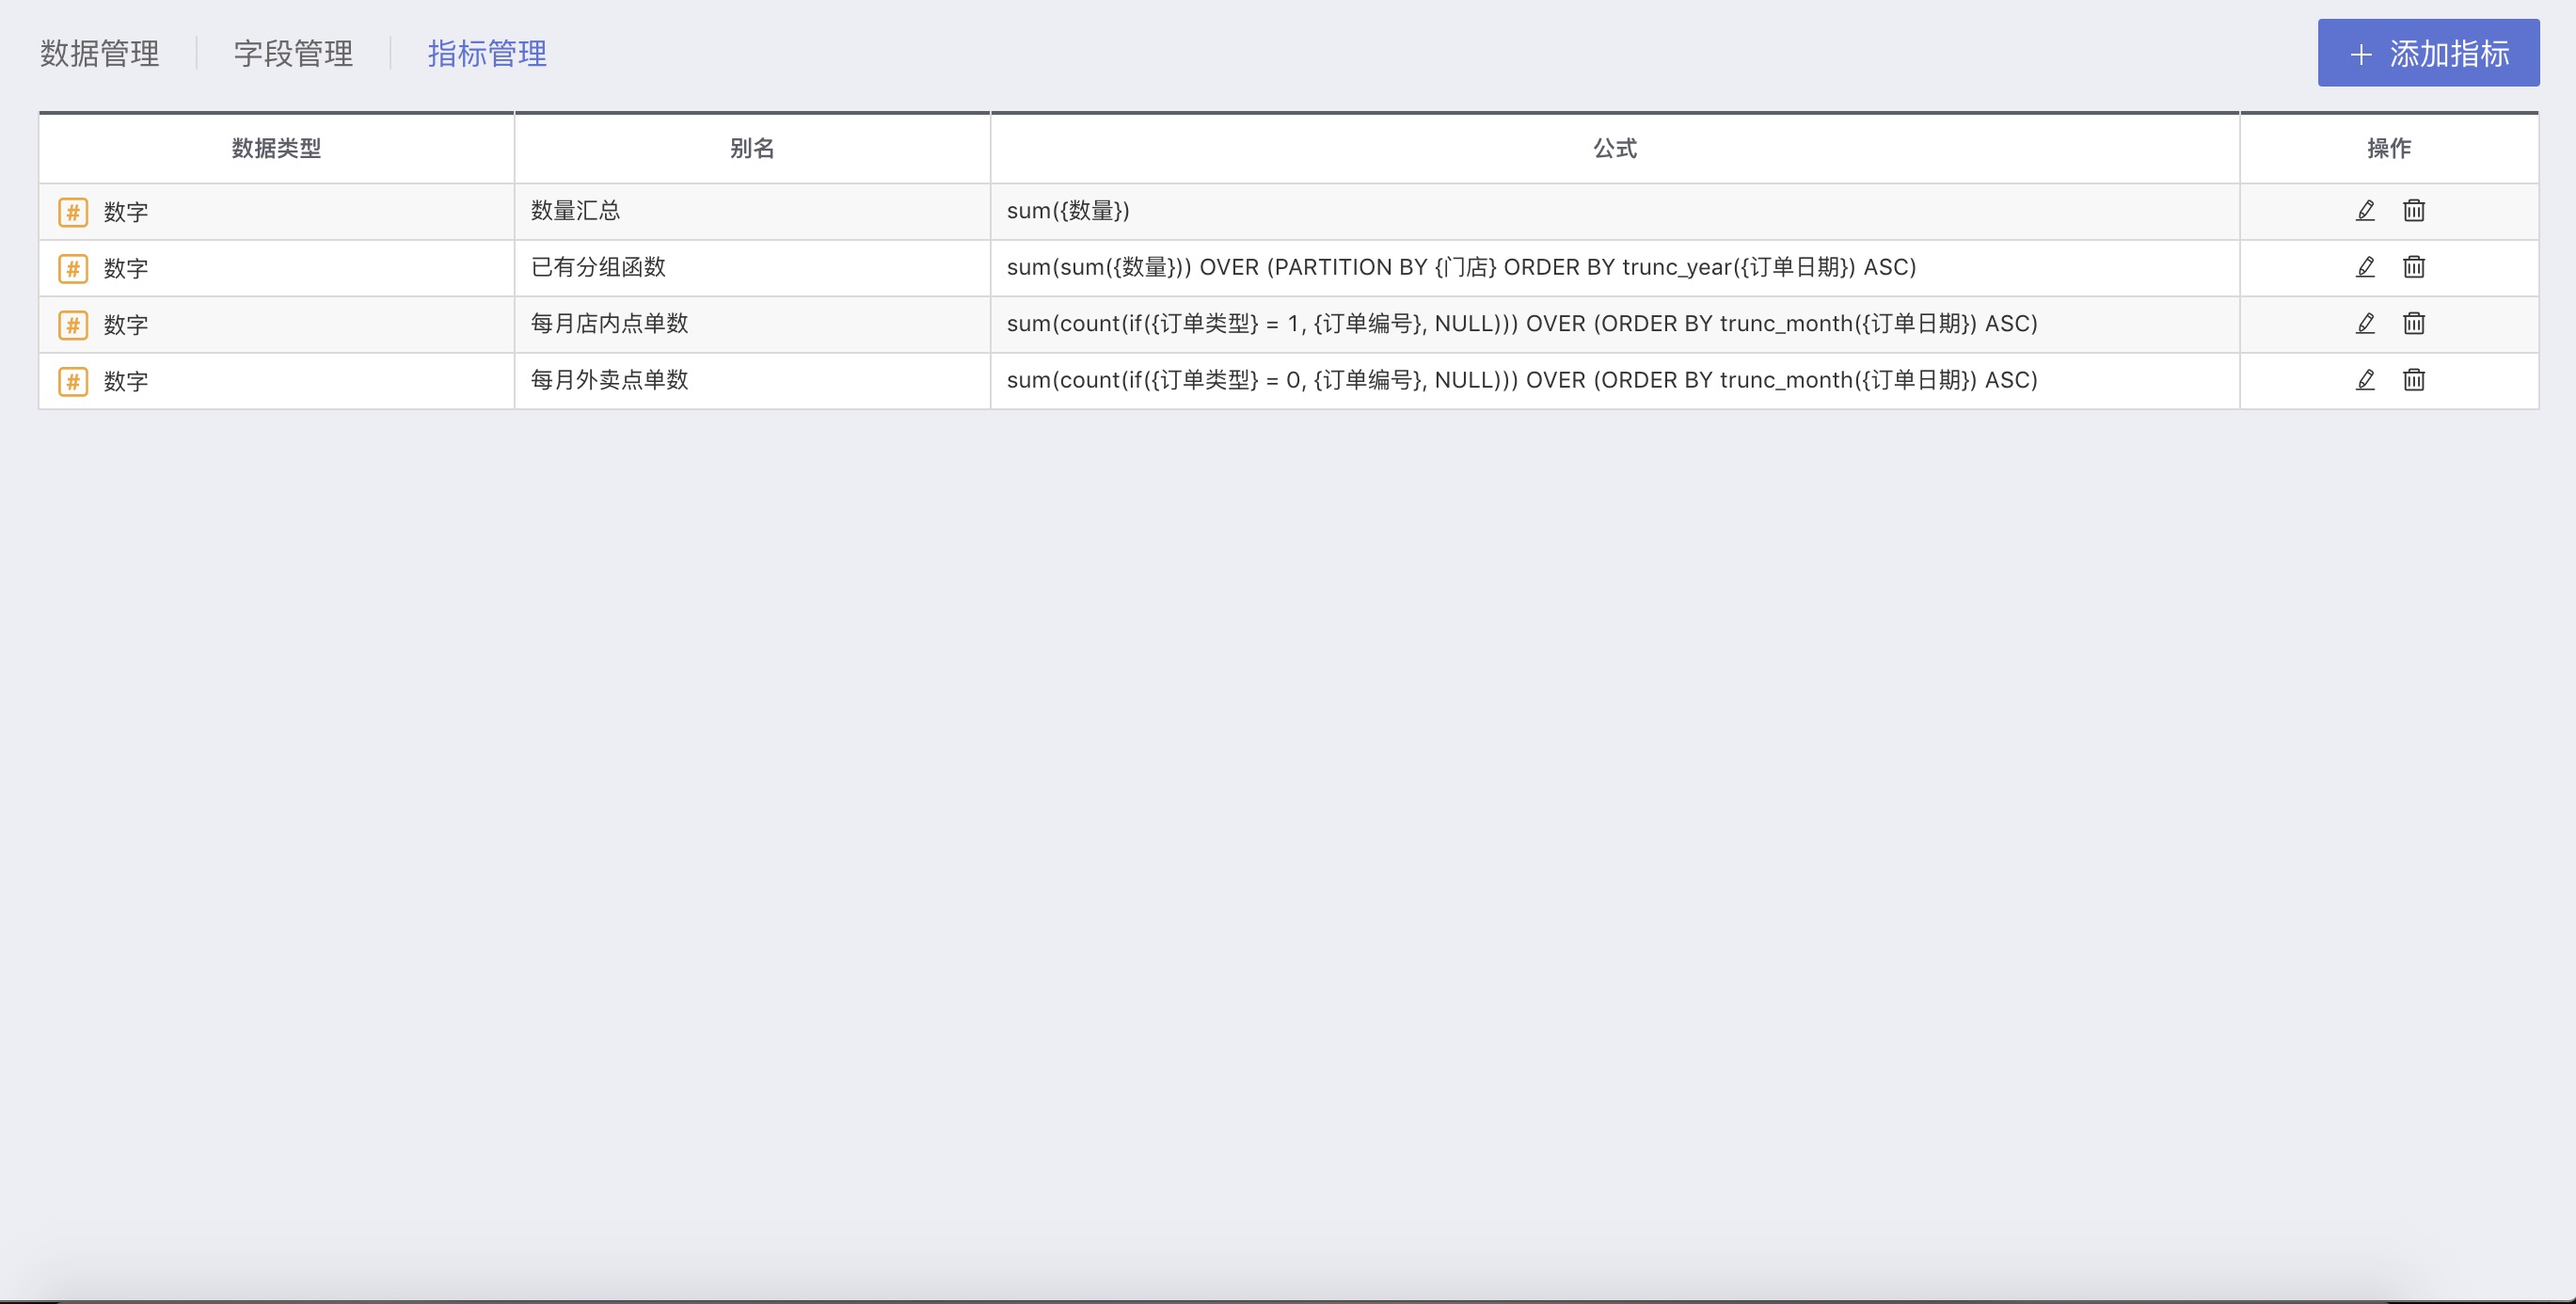
Indicator Management System
After completing data processing, HENGSHI SENSE 3.0 supports a unified management of calculated fields, indicator calculatypes, and indicator management. Indicator management is to define aggregated indicators in the dataset used for data visualization, and when all users use this dataset for visualization, they will all use a unified set of indicators, avoiding inconsistency in concept.
For example: the indicator sales volume, managed in the indicator management through the formula sum({sales performance}*{sales quantity}), then everyone has a consistent concept of "sales volume," avoiding data inconsistencies caused by different calculation methods with the same name.
So, indicator management within the enterprise ensures the statistical logic of key KPIs, with statistical algorithms keeping a consistent caliber between departments, saying goodbye to data inconsistencies.
At this point, all operations in the data mart are completed, and data analysis users can use the dataset from the data mart to create data visualizations in the Application Creation area.
In the above permission management, the users added under any module of administrator, editor, and viewer, when creating charts, after clicking to create a new one, can see the folder by clicking on the drop-down box on the left side of the chart type selection, expanding the data source selection area.
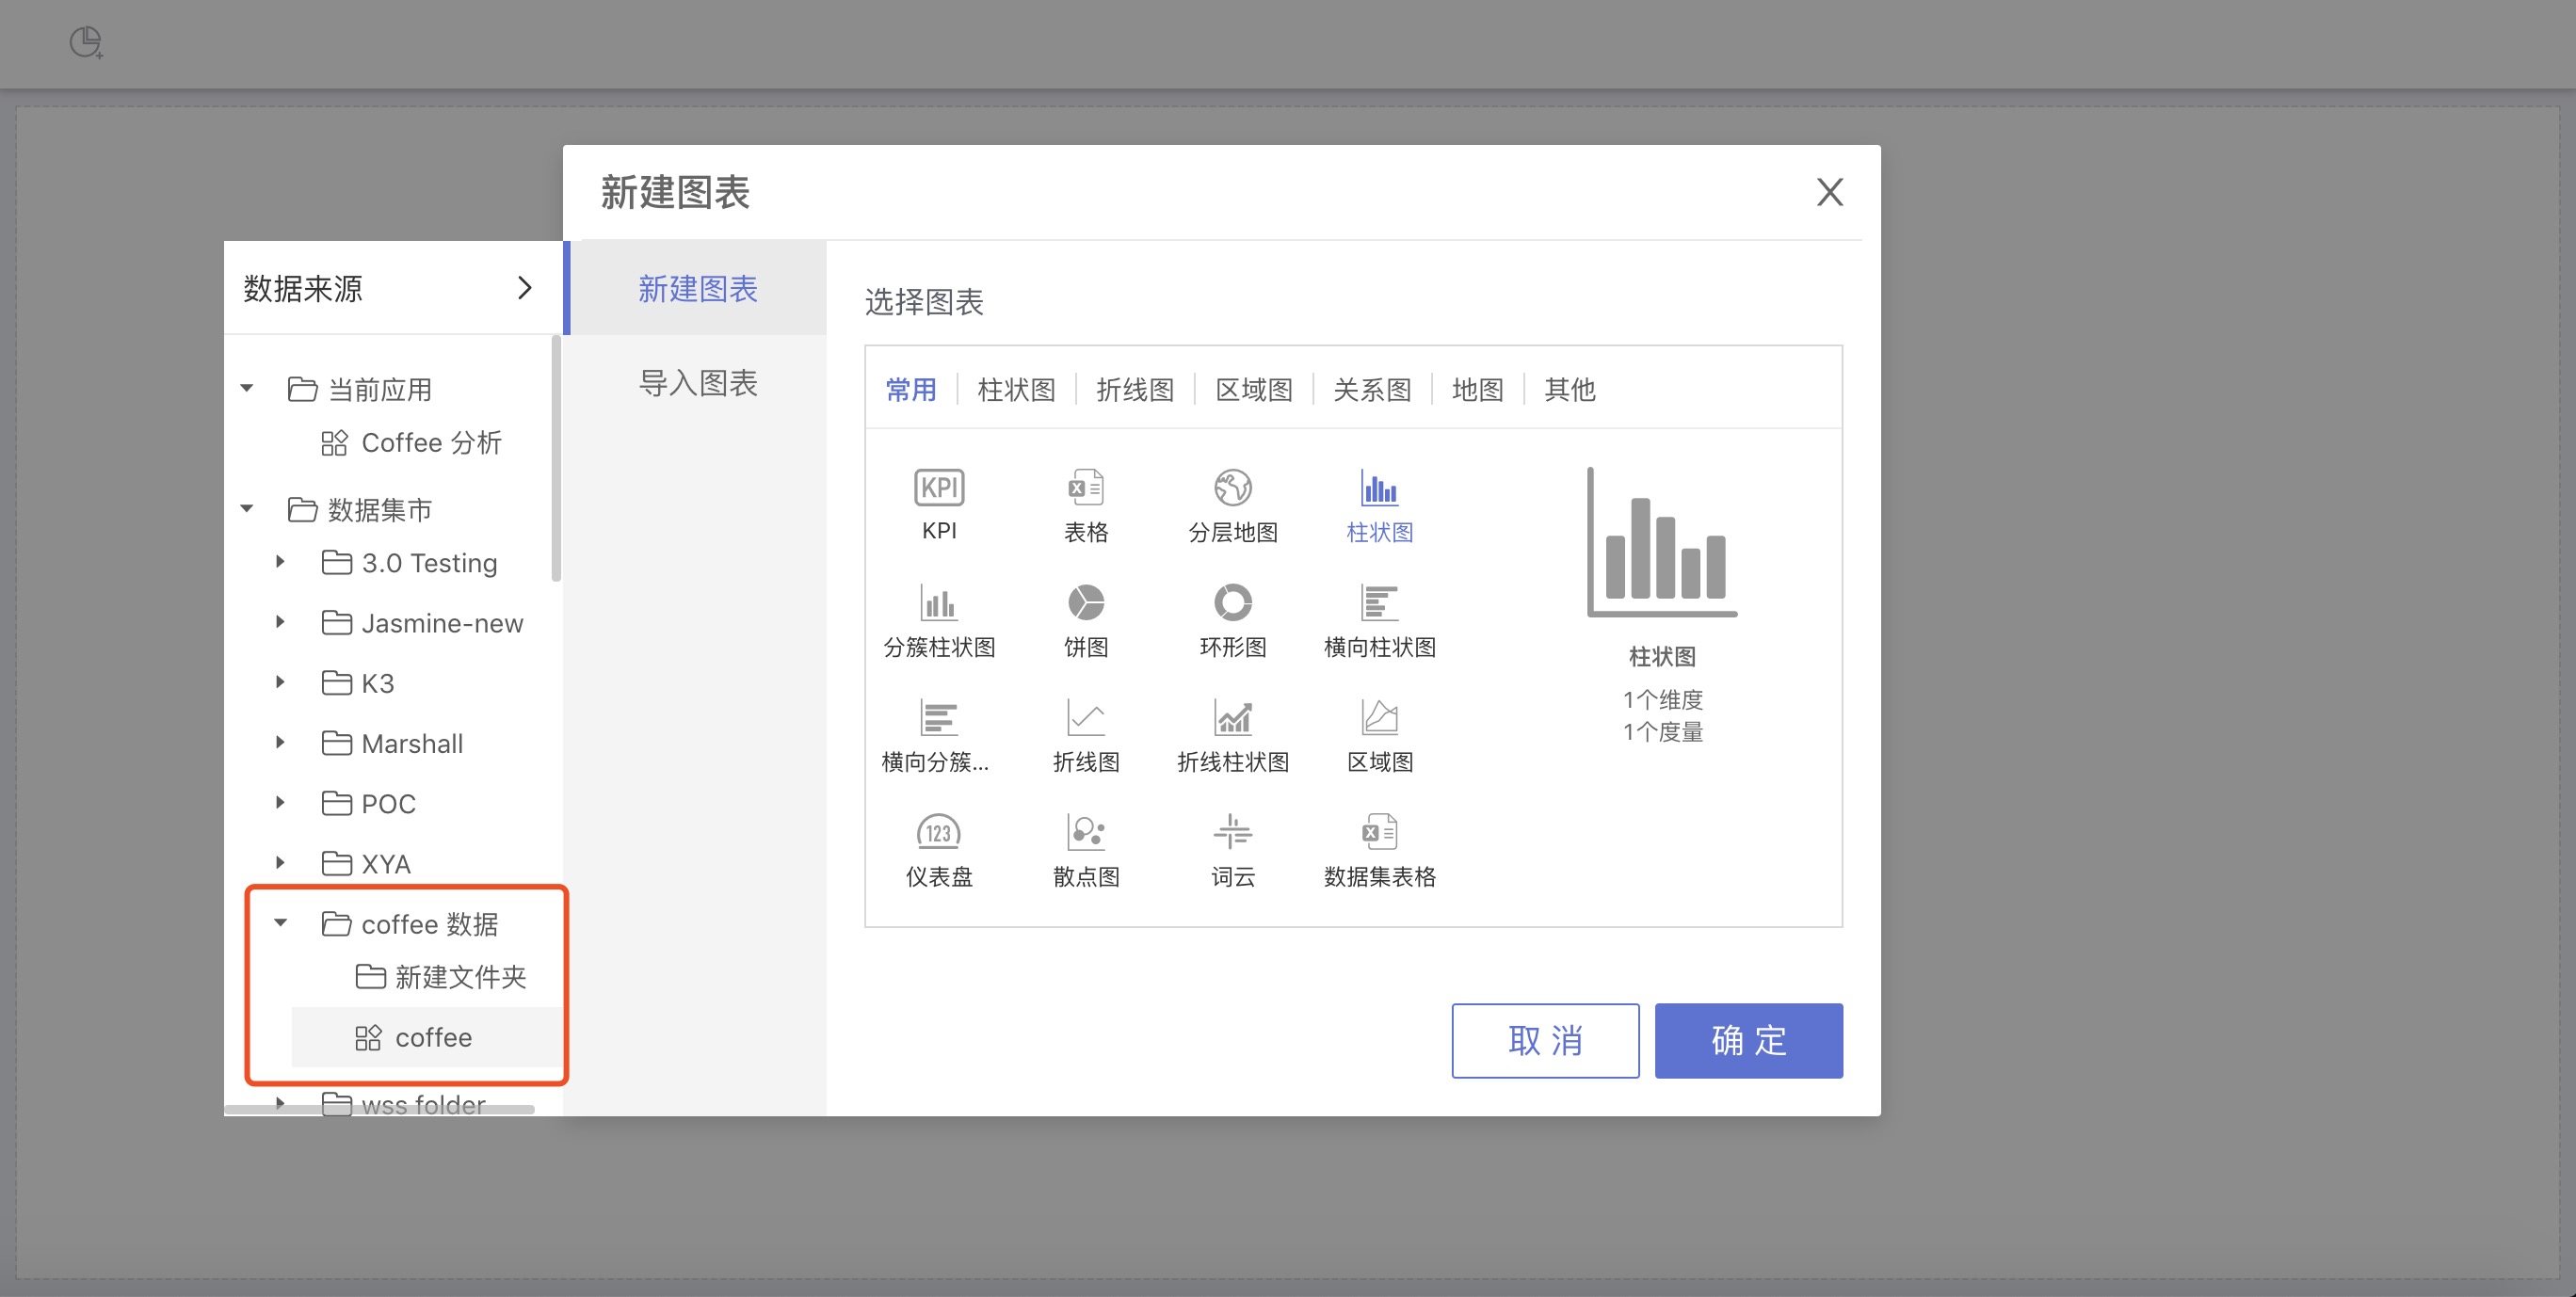
Note:
The data package within the folder must be selected;
When drawing charts, you must first select the data package.