Hengshi Documentation
HENGSHI SENSE Filter, Drill Down, and Linked Filtering Instructions
This document demonstrates how to filter, link, and use drill-downs in combination for analysis in dashboards. This article uses coffee analysis as an example to explain the usage of each feature in detail. Data and analysis scenarios for the coffee analysis can be found in the Advanced Calculation Instructions.
Filtering
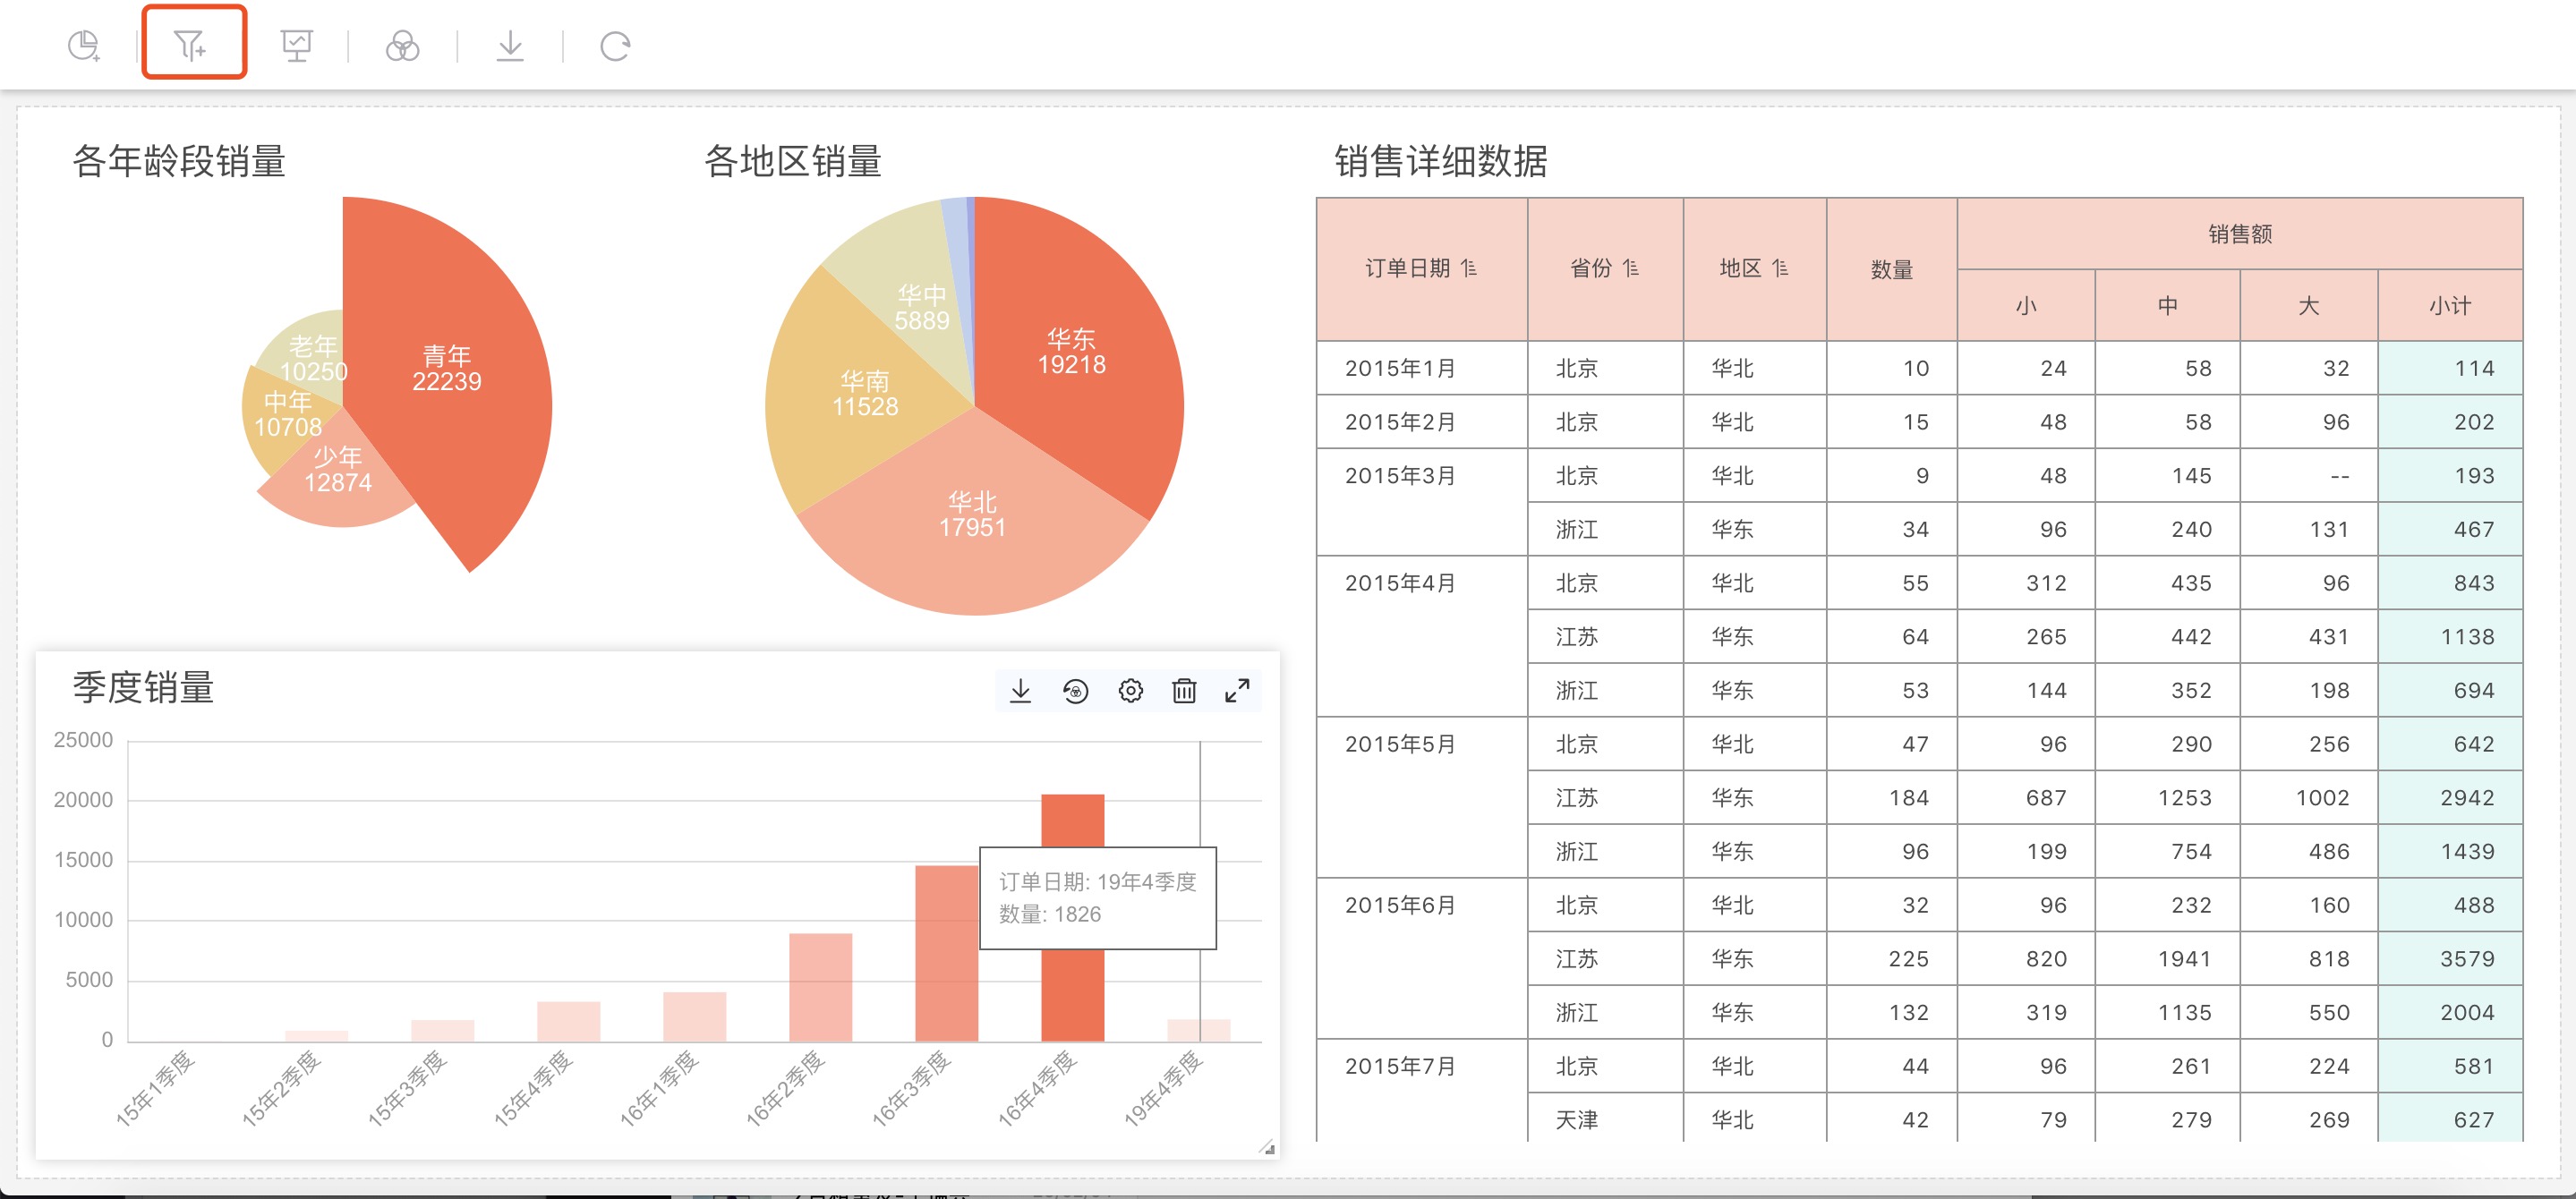
Add filters to the dashboard to easily explore different facets of the data. Click the Filter button and add filters based on the fields included in the current dashboard.
Click the Add Filter button as shown in the figure above to expand the field selection box for filtering:
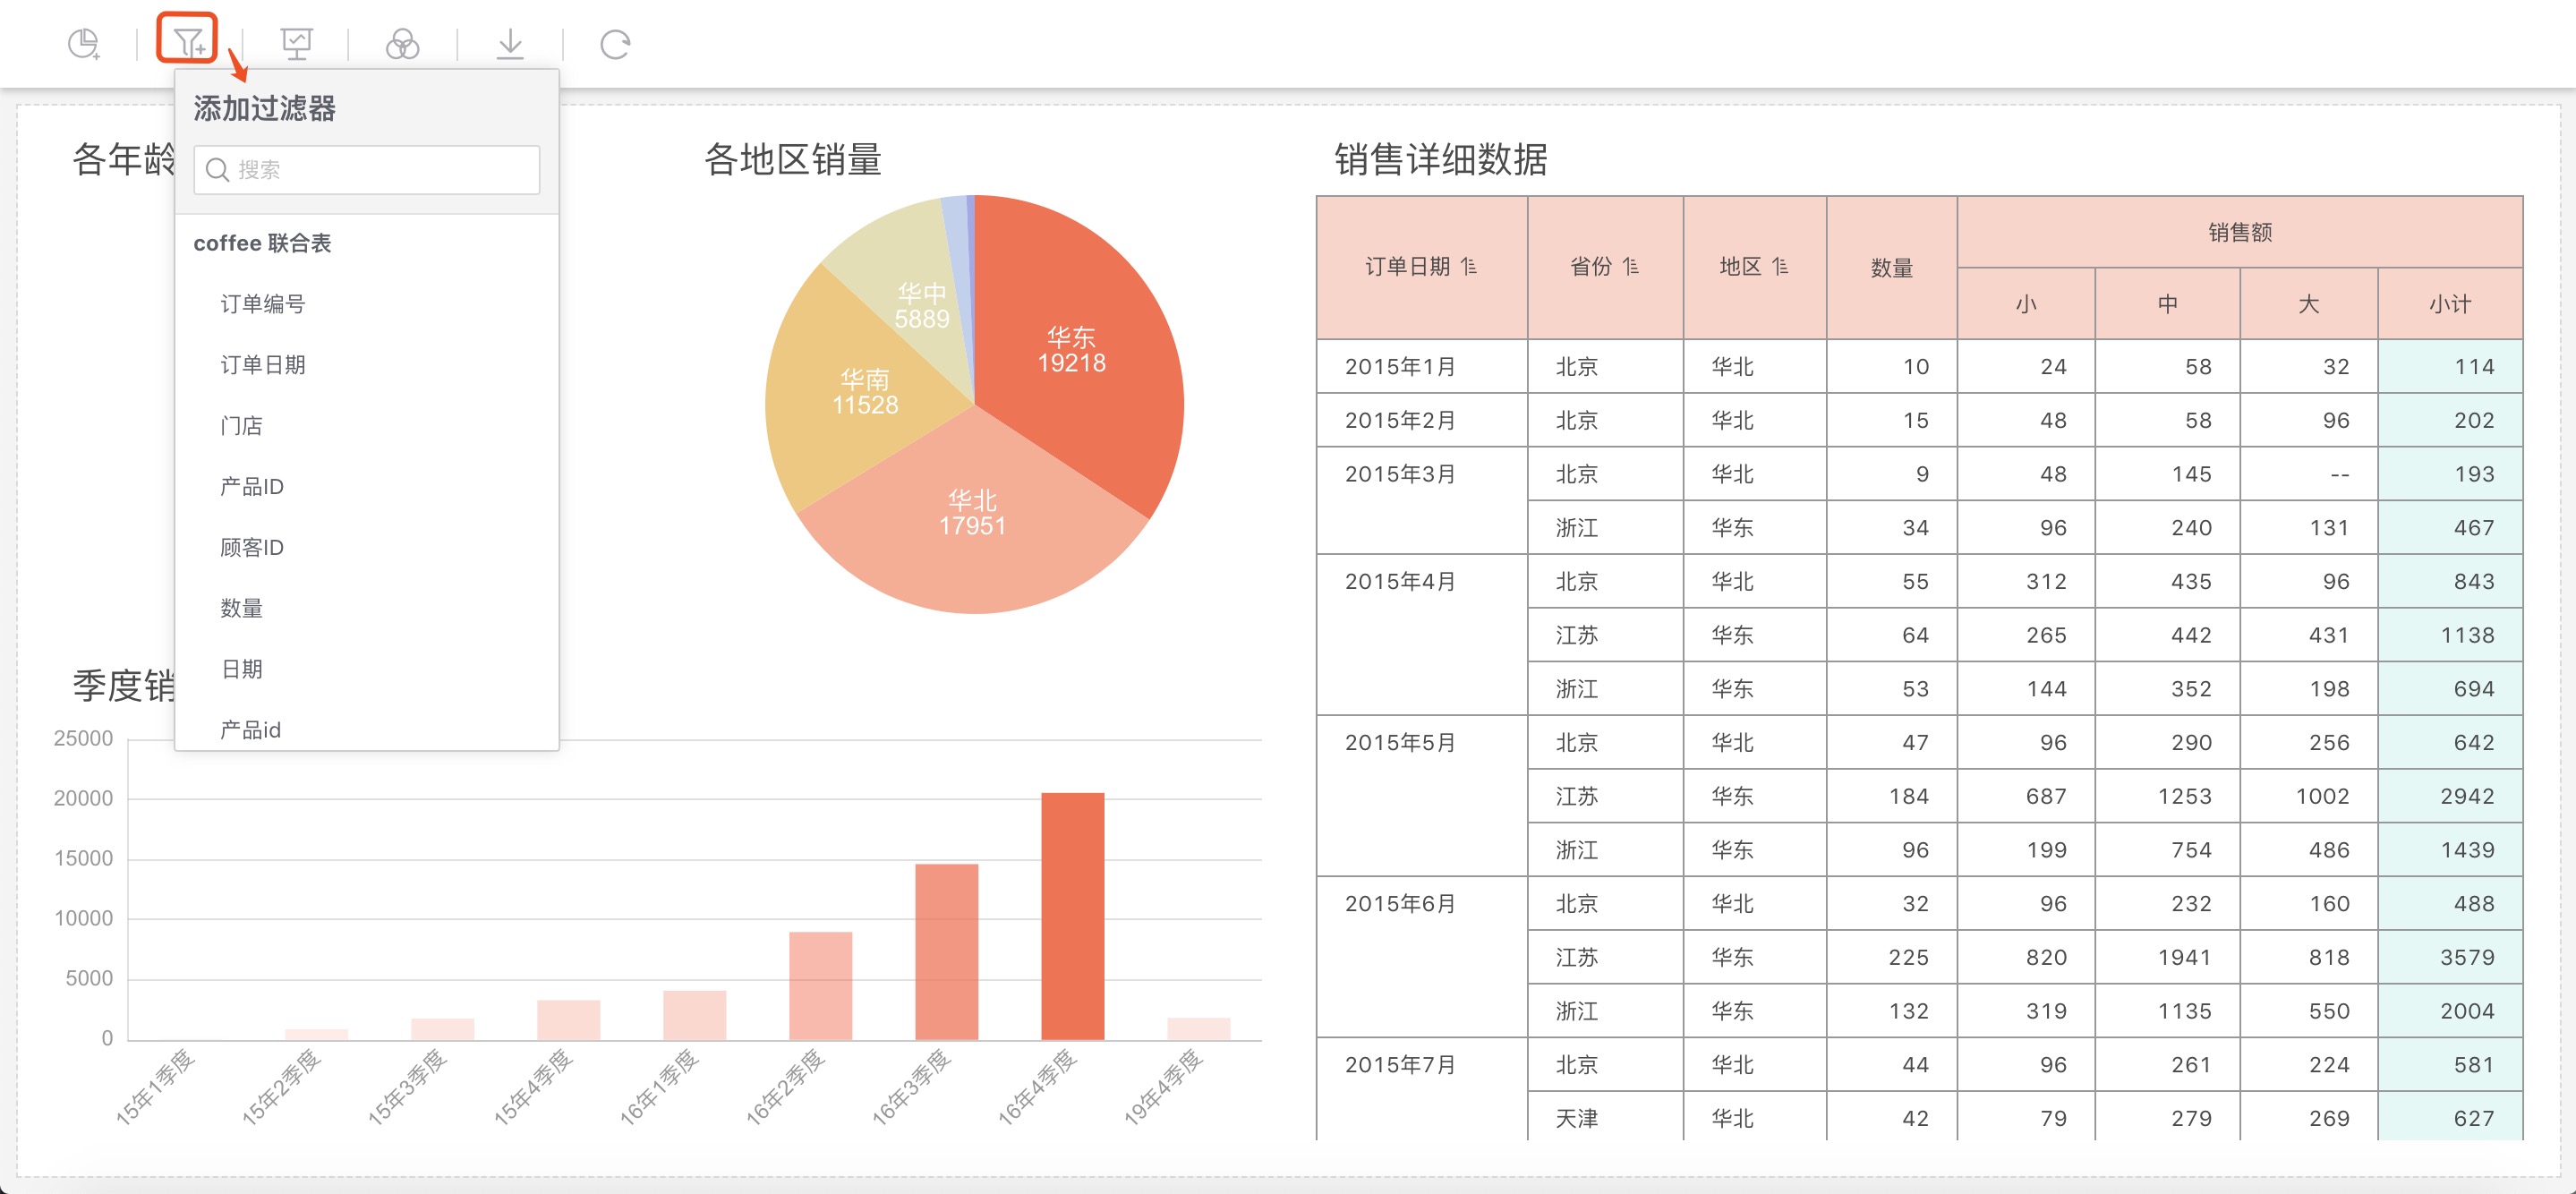
Click to select a field to add a filter. When there are too many datasets in the application, you can choose to search for the field or dataset you want to use.
Filters, like charts, are elements of the dashboard; once added, they will be saved. In the application creation area, everyone with permission to see this dashboard can operate the filters. The selection state of the filters is persistent, and each update of the filter will overwrite the previous content and be saved.
As shown in the figure below, filters for Order Date and Gender have been added. Click on the field Region from the left side "Add Filter" pop-up box, and this field is added to the list of filters on the left:
As shown in the figure below
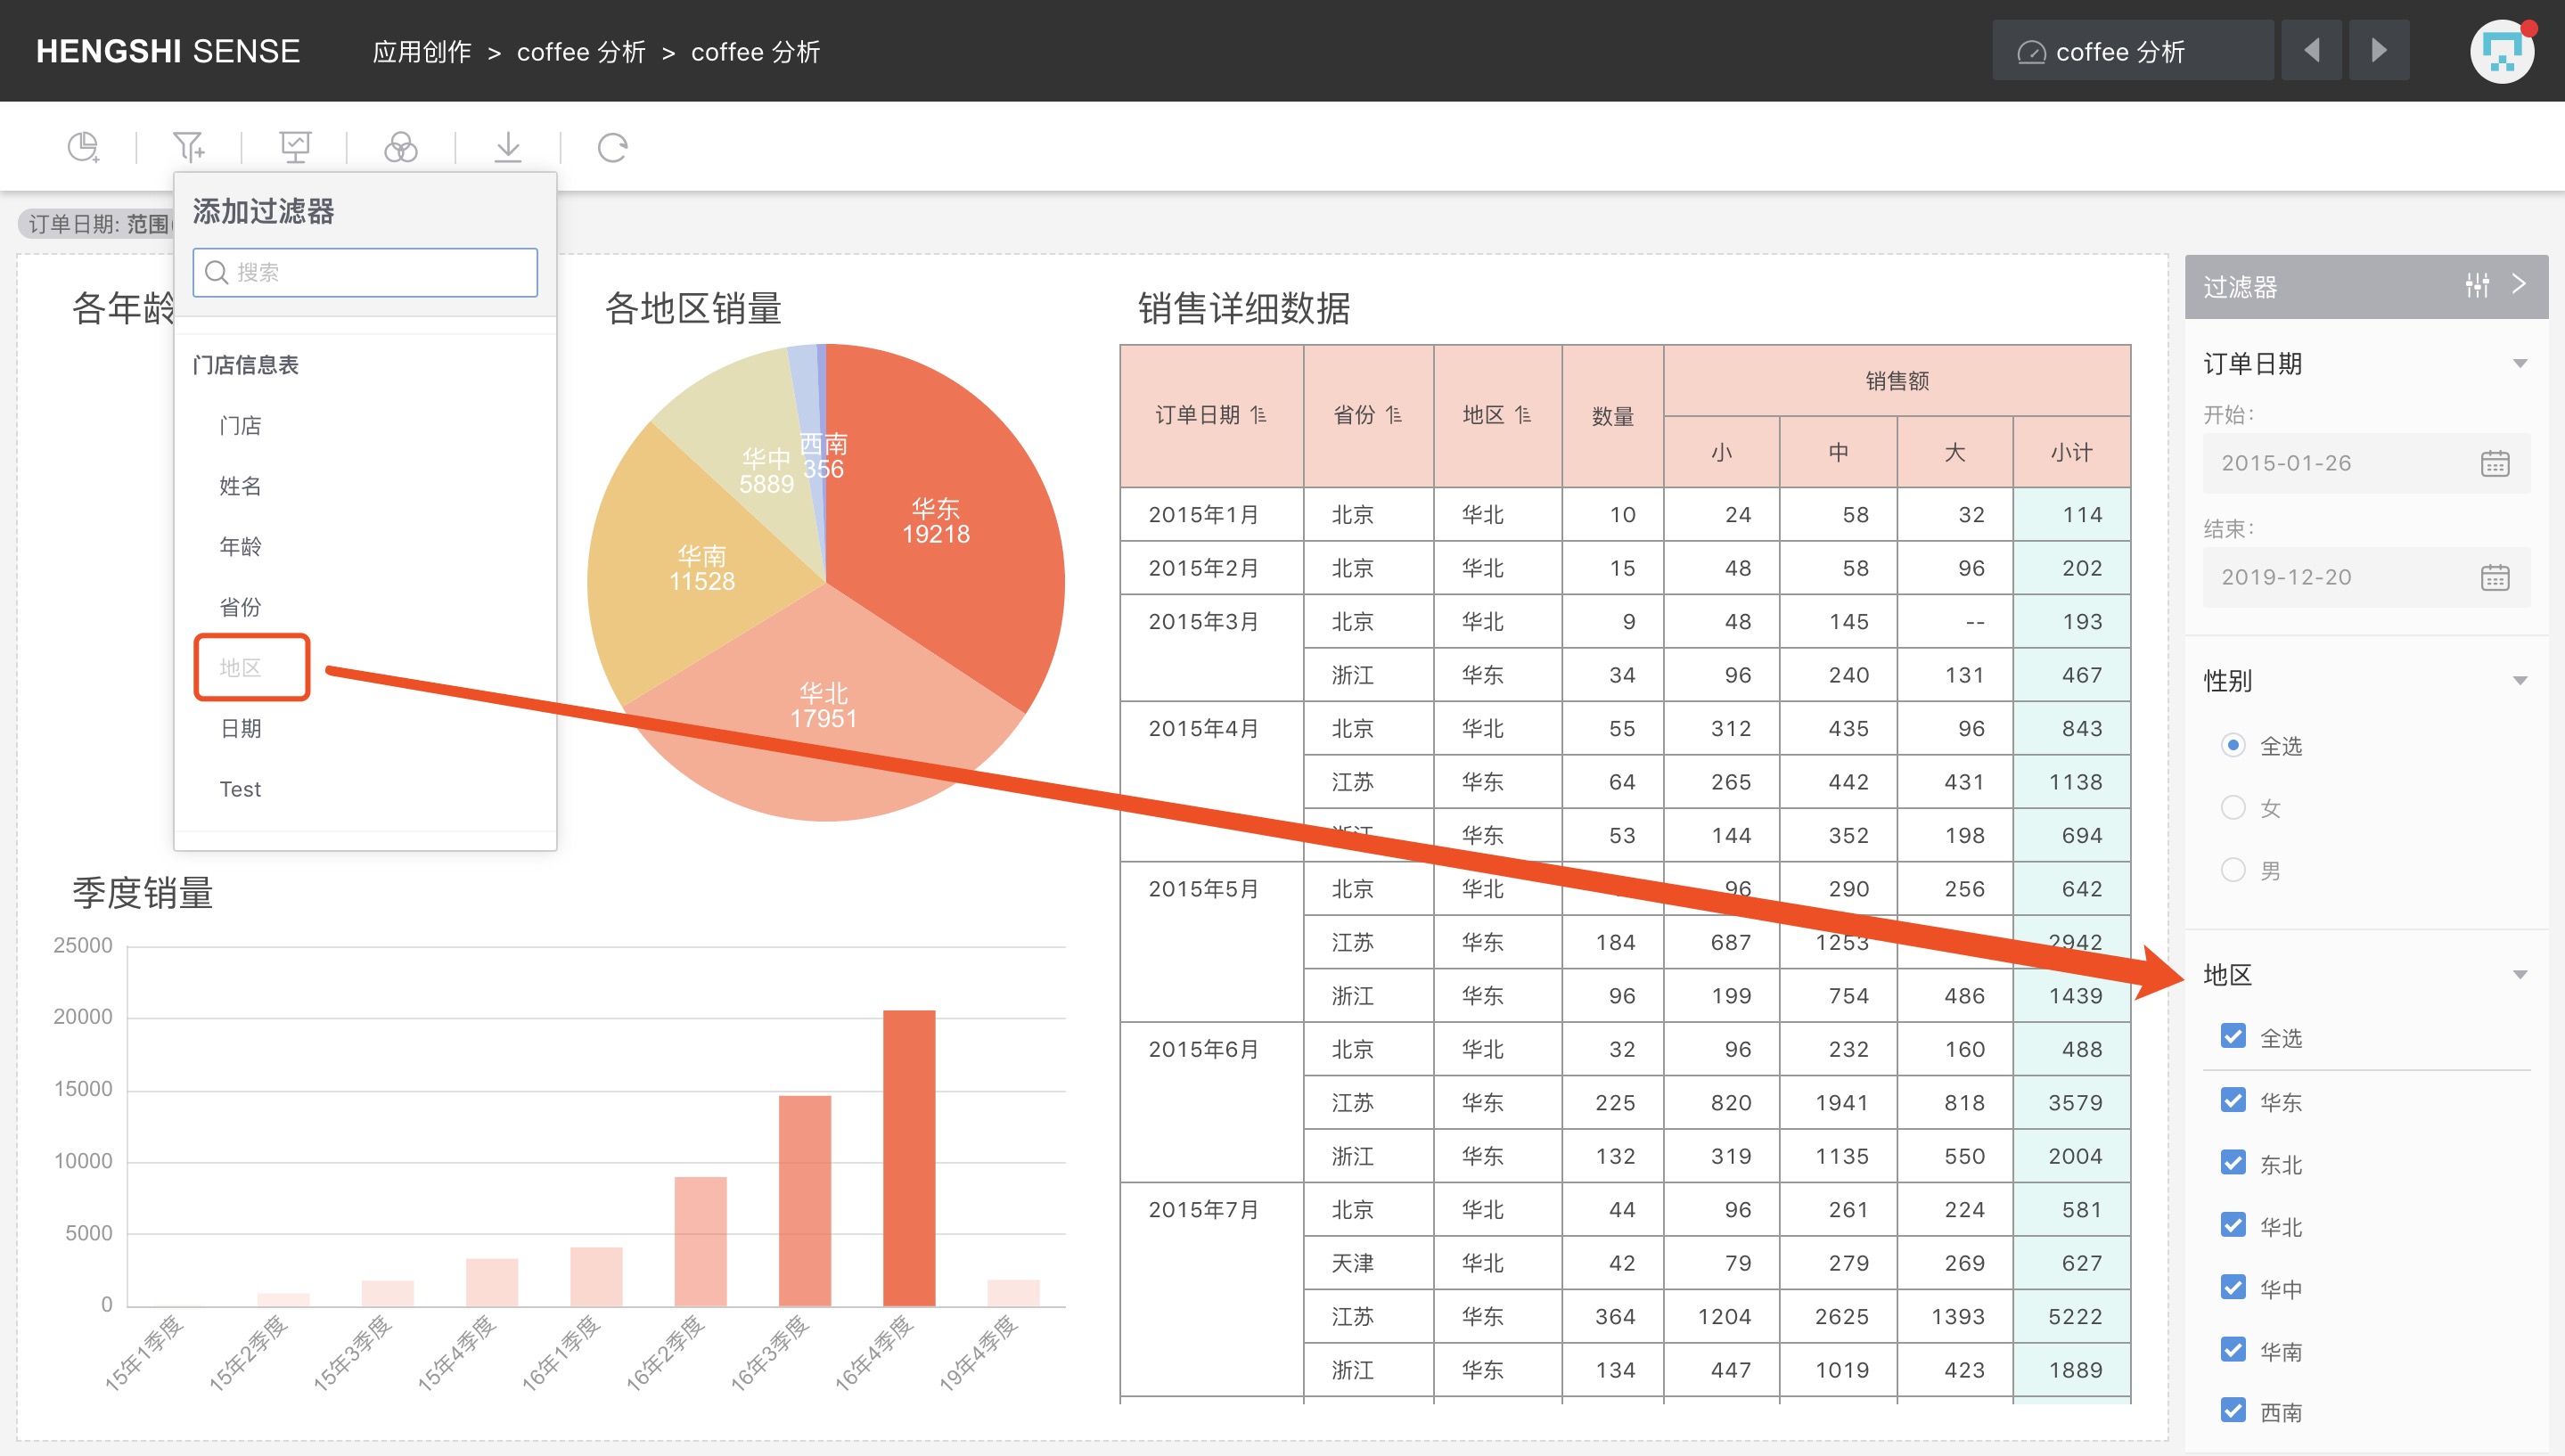
You can control the data of charts in the dashboard by modifying the filter settings. You can control the data of charts in the dashboard by modifying the filter settings.
Note:
- Filters in the dashboard can filter charts from the same dataset as the field.
- Filters in the dashboard can filter charts from datasets within the same data model as the field's dataset.
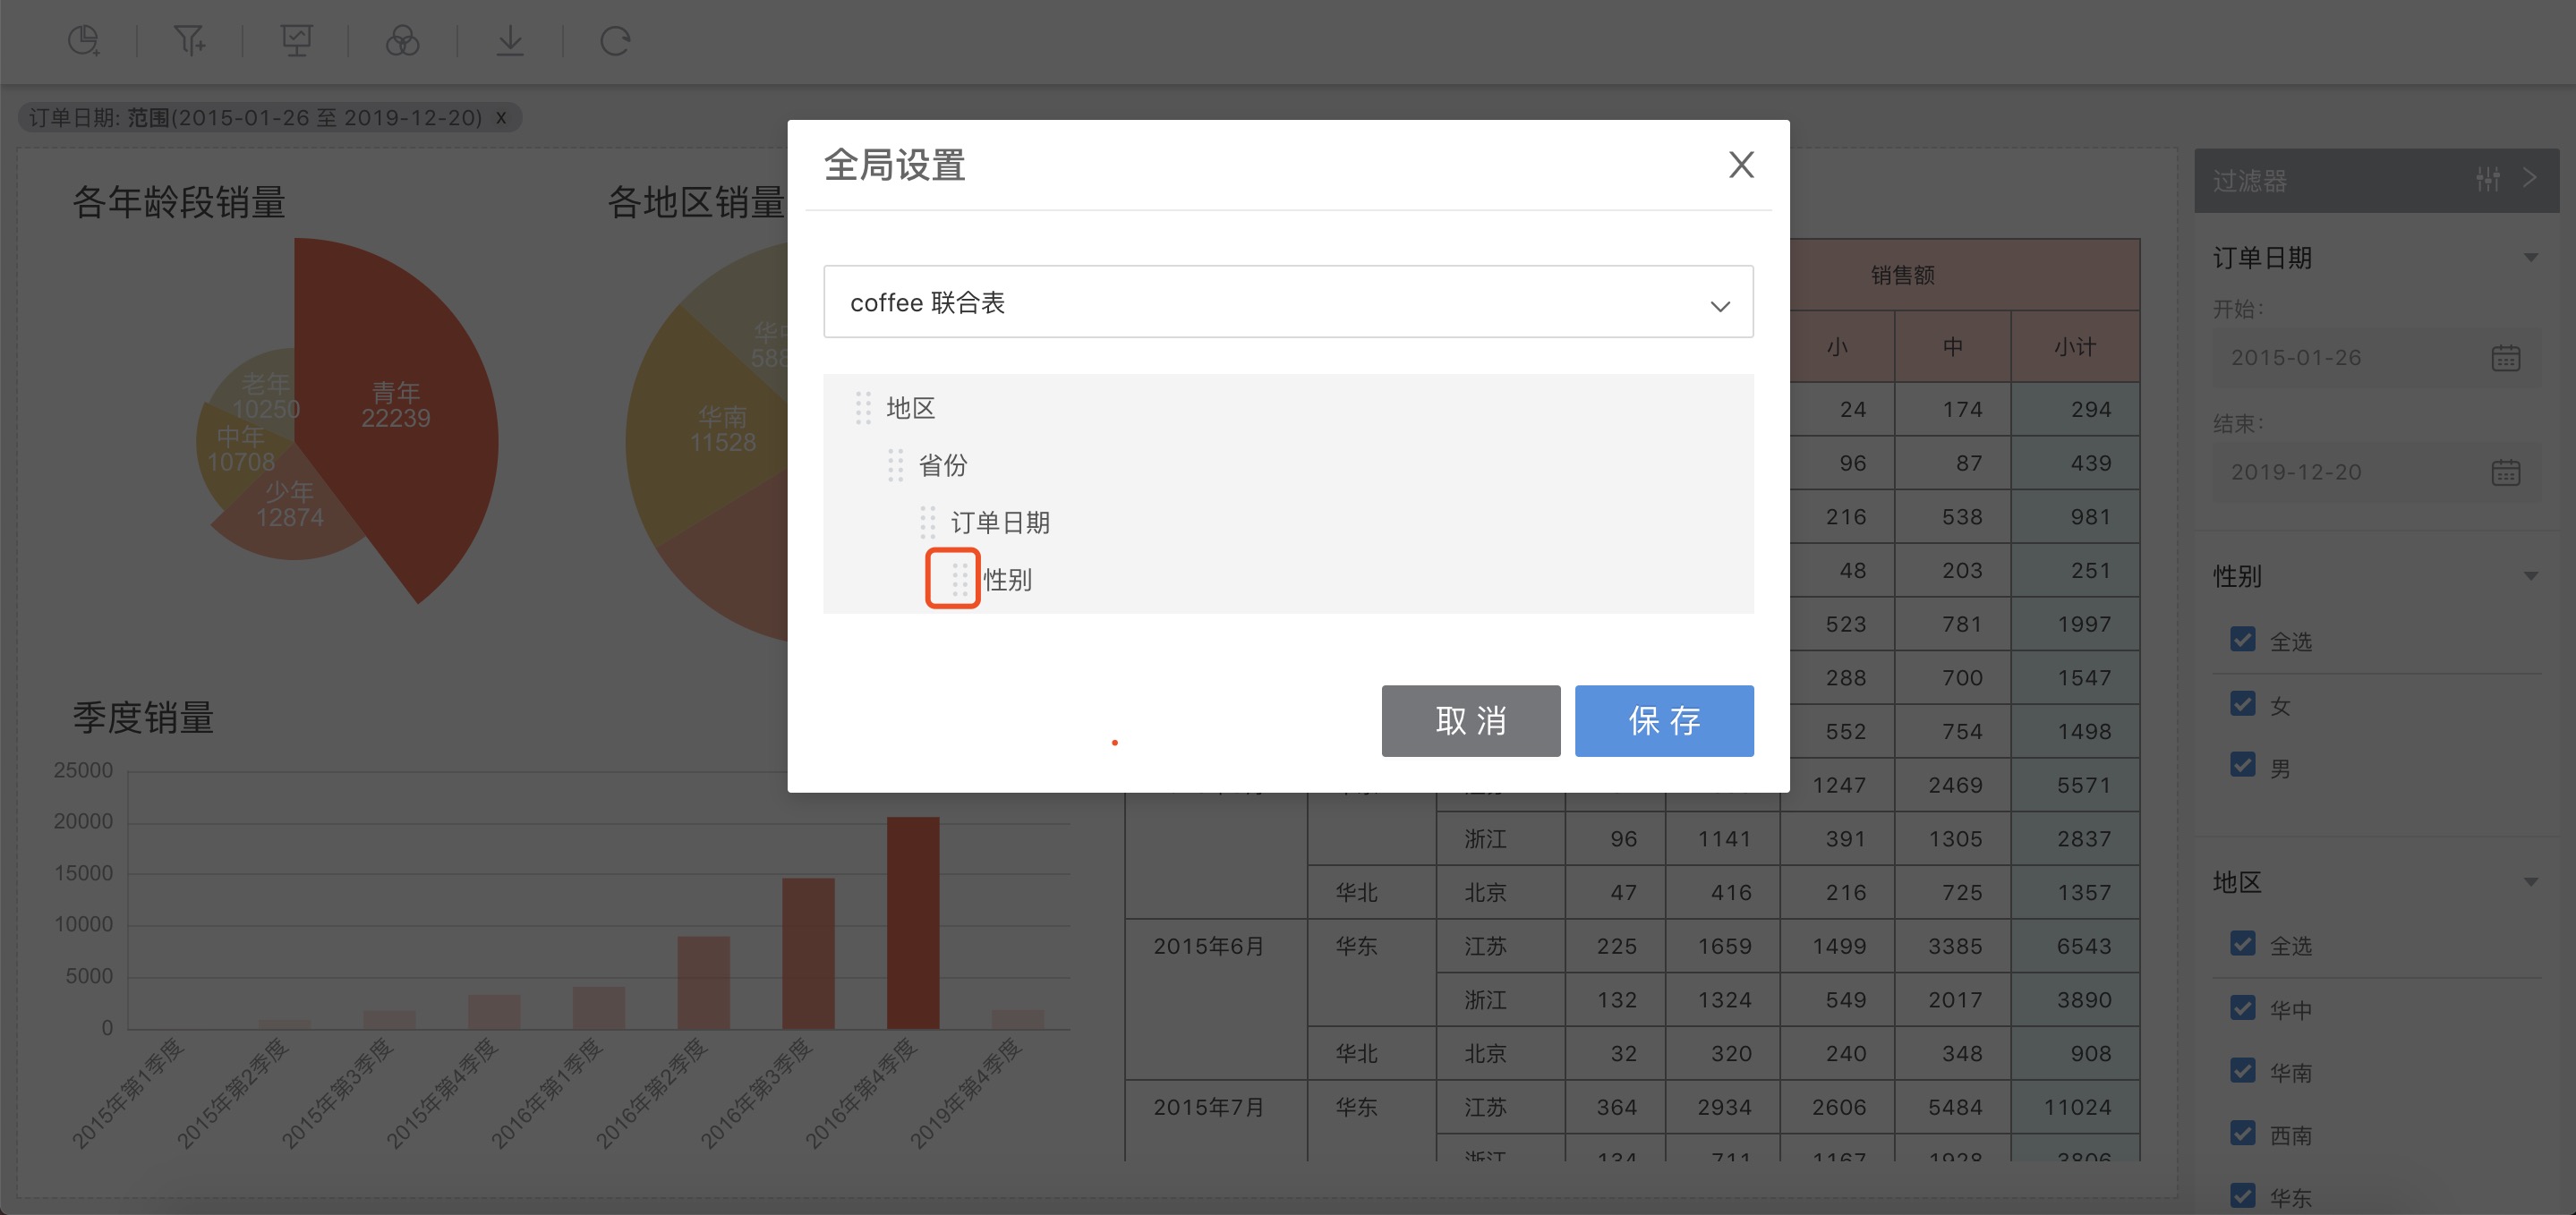
Global Settings
Click the Global Settings icon to pop up a window. You can sort filter fields, rename them, and set linked filtering.
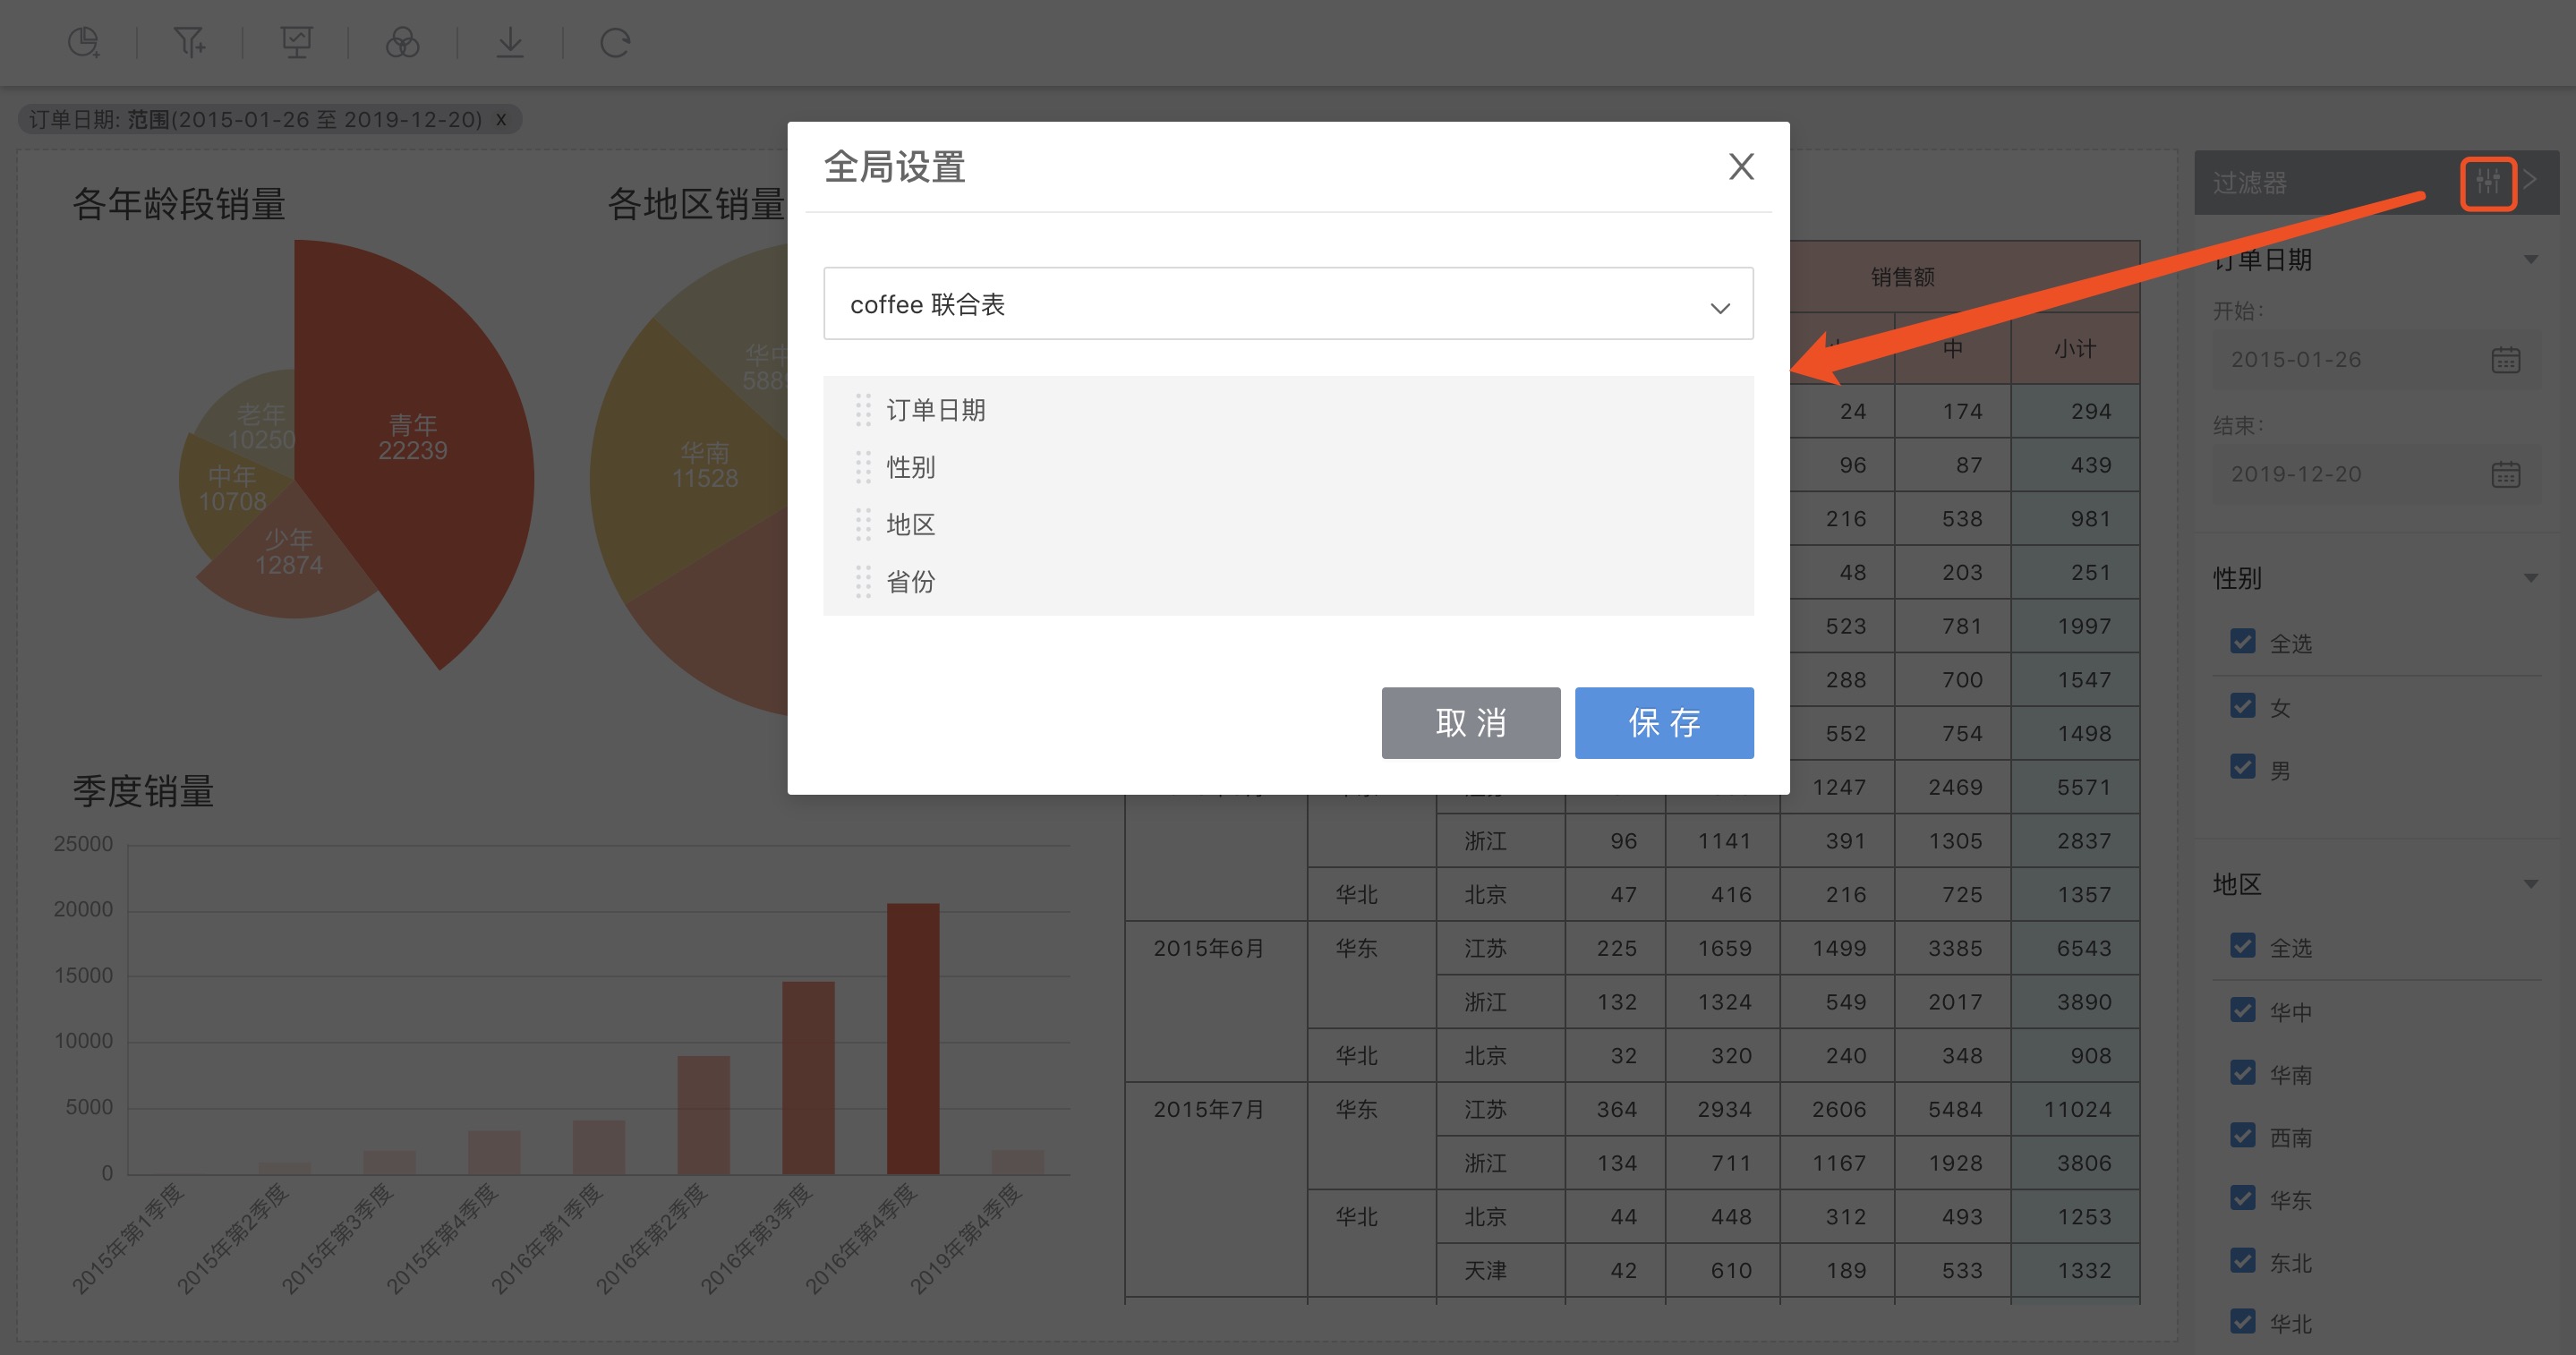
Sorting
You can sort the filters by dragging the fields.
Renaming
Click on the edit icon, modify after being selected, and then save or cancel.
Linked Filtering
You can adjust the structure of filter fields that belong to the same dataset. Click the chain icon behind the filter field to make the filter indent and link with the upper field; to unlink, click again, and the indentation is also canceled. Drag and drop can also be used to set the linked filter structure.
As shown in the figure below, the linked filter structure tree set is: Region -> Province -> Order Date -> Gender:
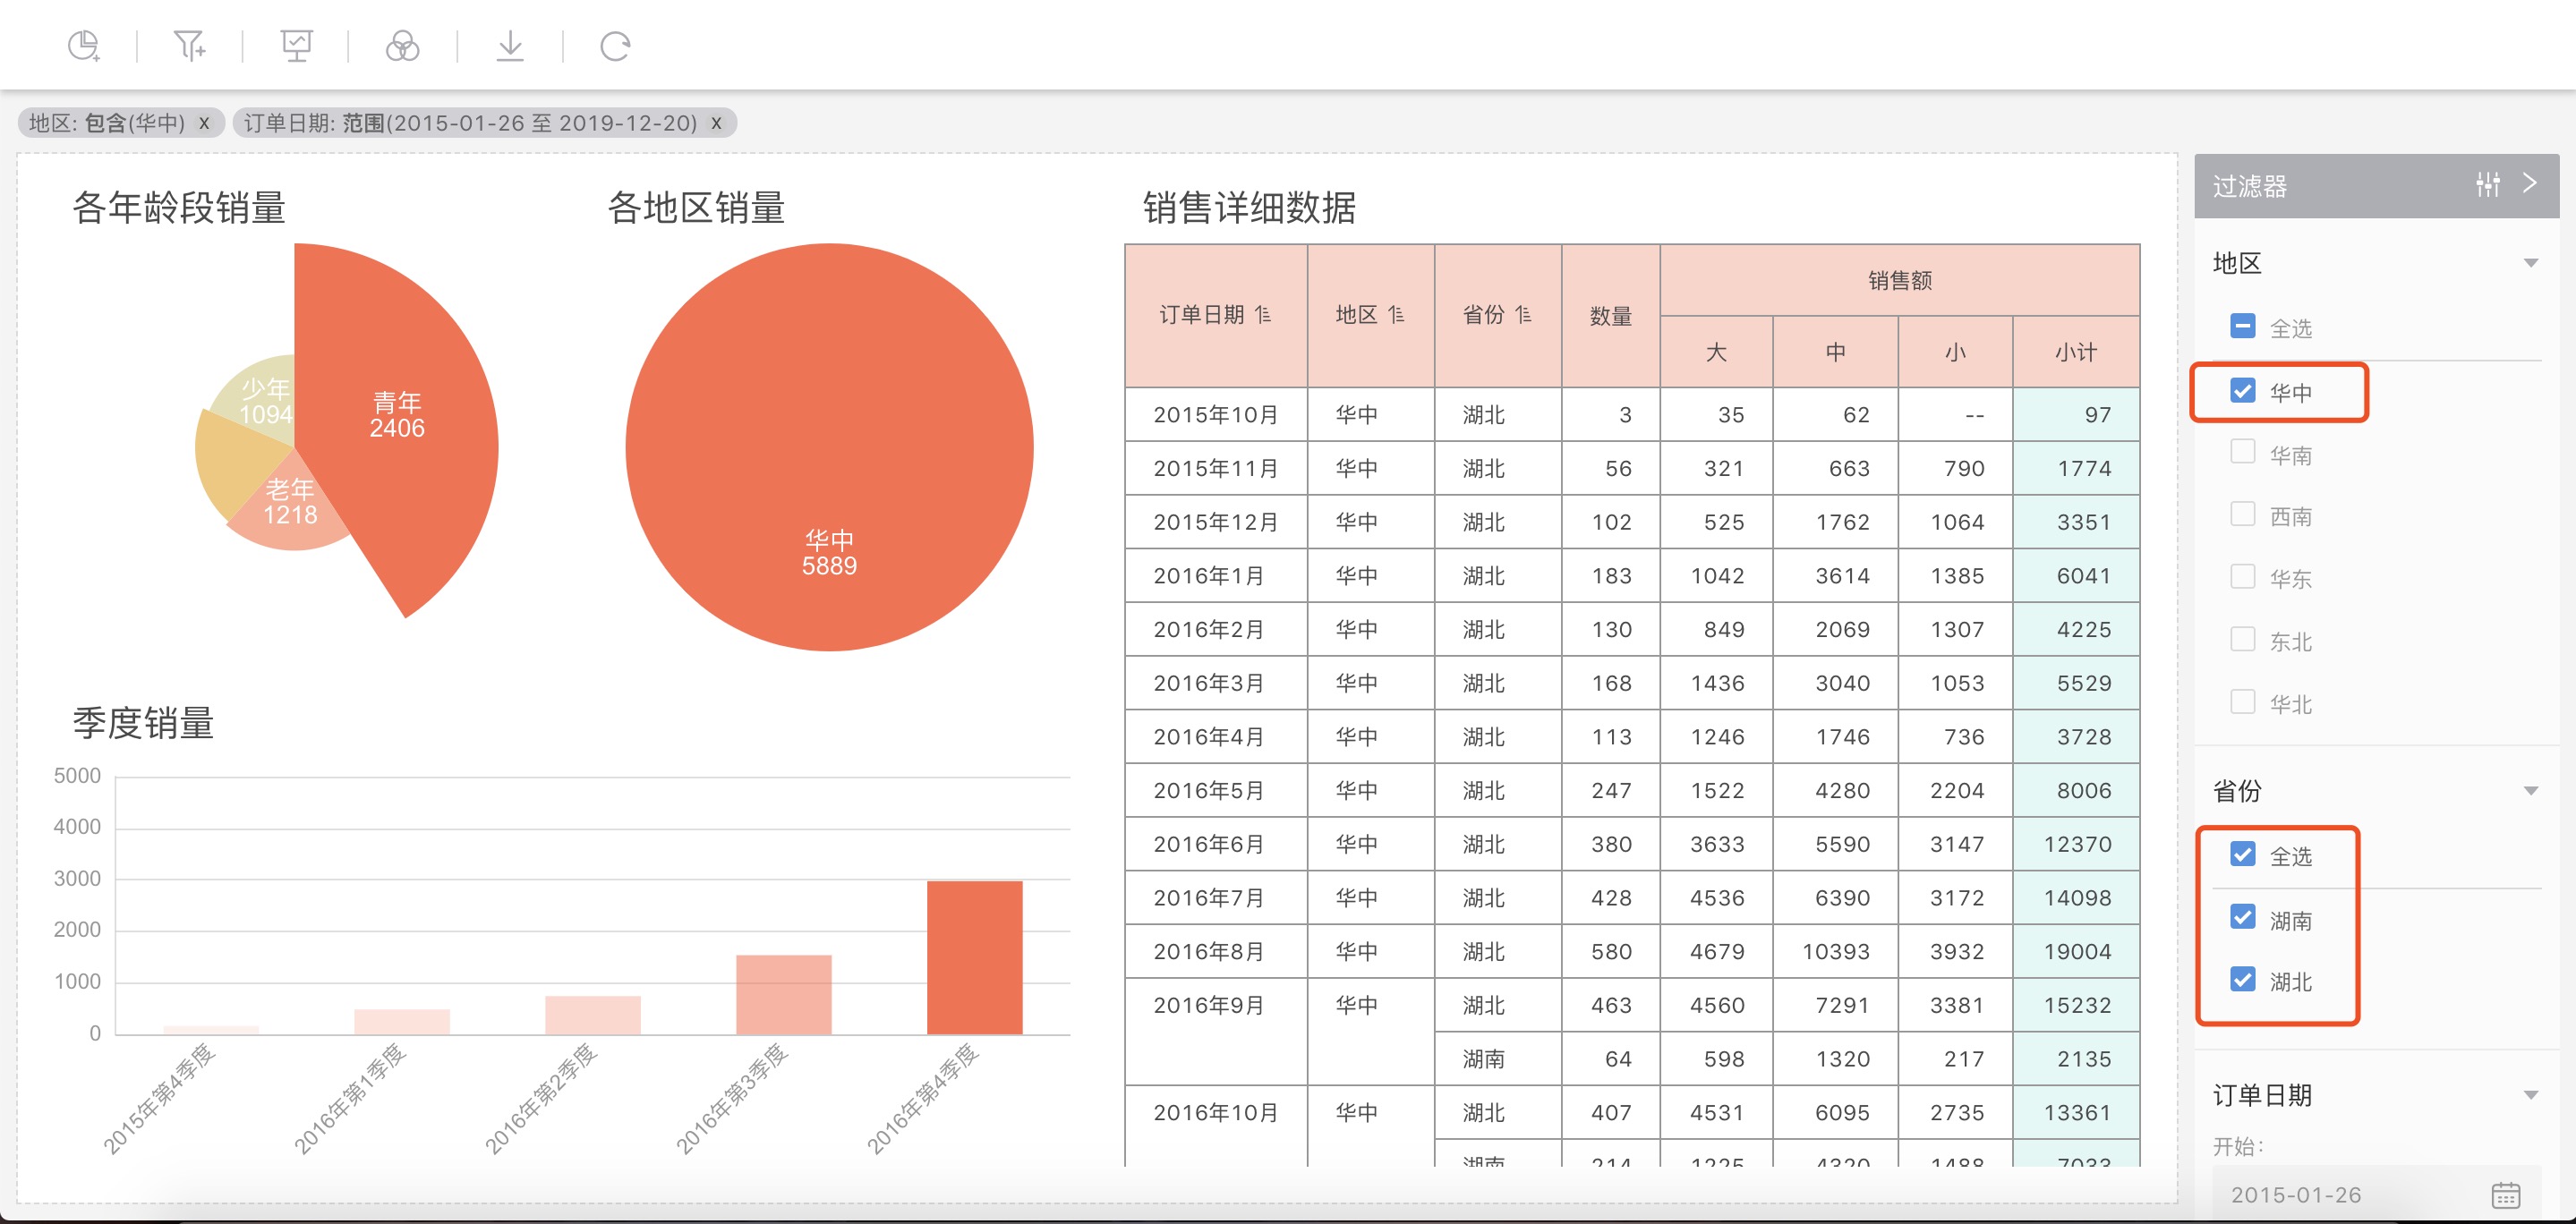
A change in filtering conditions for a filter on a linked filtering tree will cause the filter's child nodes on the linked filter tree's value set or value range to be filtered in real time.
As shown in the figure below: Filter for Region is currently selected as "Central China," and Province in the global settings is the child node of Region. After clicking confirm, the selectable values for the Province filter are only "Hunan" and "Hubei" from Central China;
Please note:
- The value set or value range of a child field will be filtered level by level with the ancestor field.
- Parallel fields do not affect each other.
- Changes in selected values or ranges of a child field will not affect the ancestor field.
- Expand the filter by clicking the downward triangle on the right side of the filter field name to open the menu for that filter.
Filter Function Settings
In the pop-up menu, select Settings to open the Filter Function Settings window for the filter:
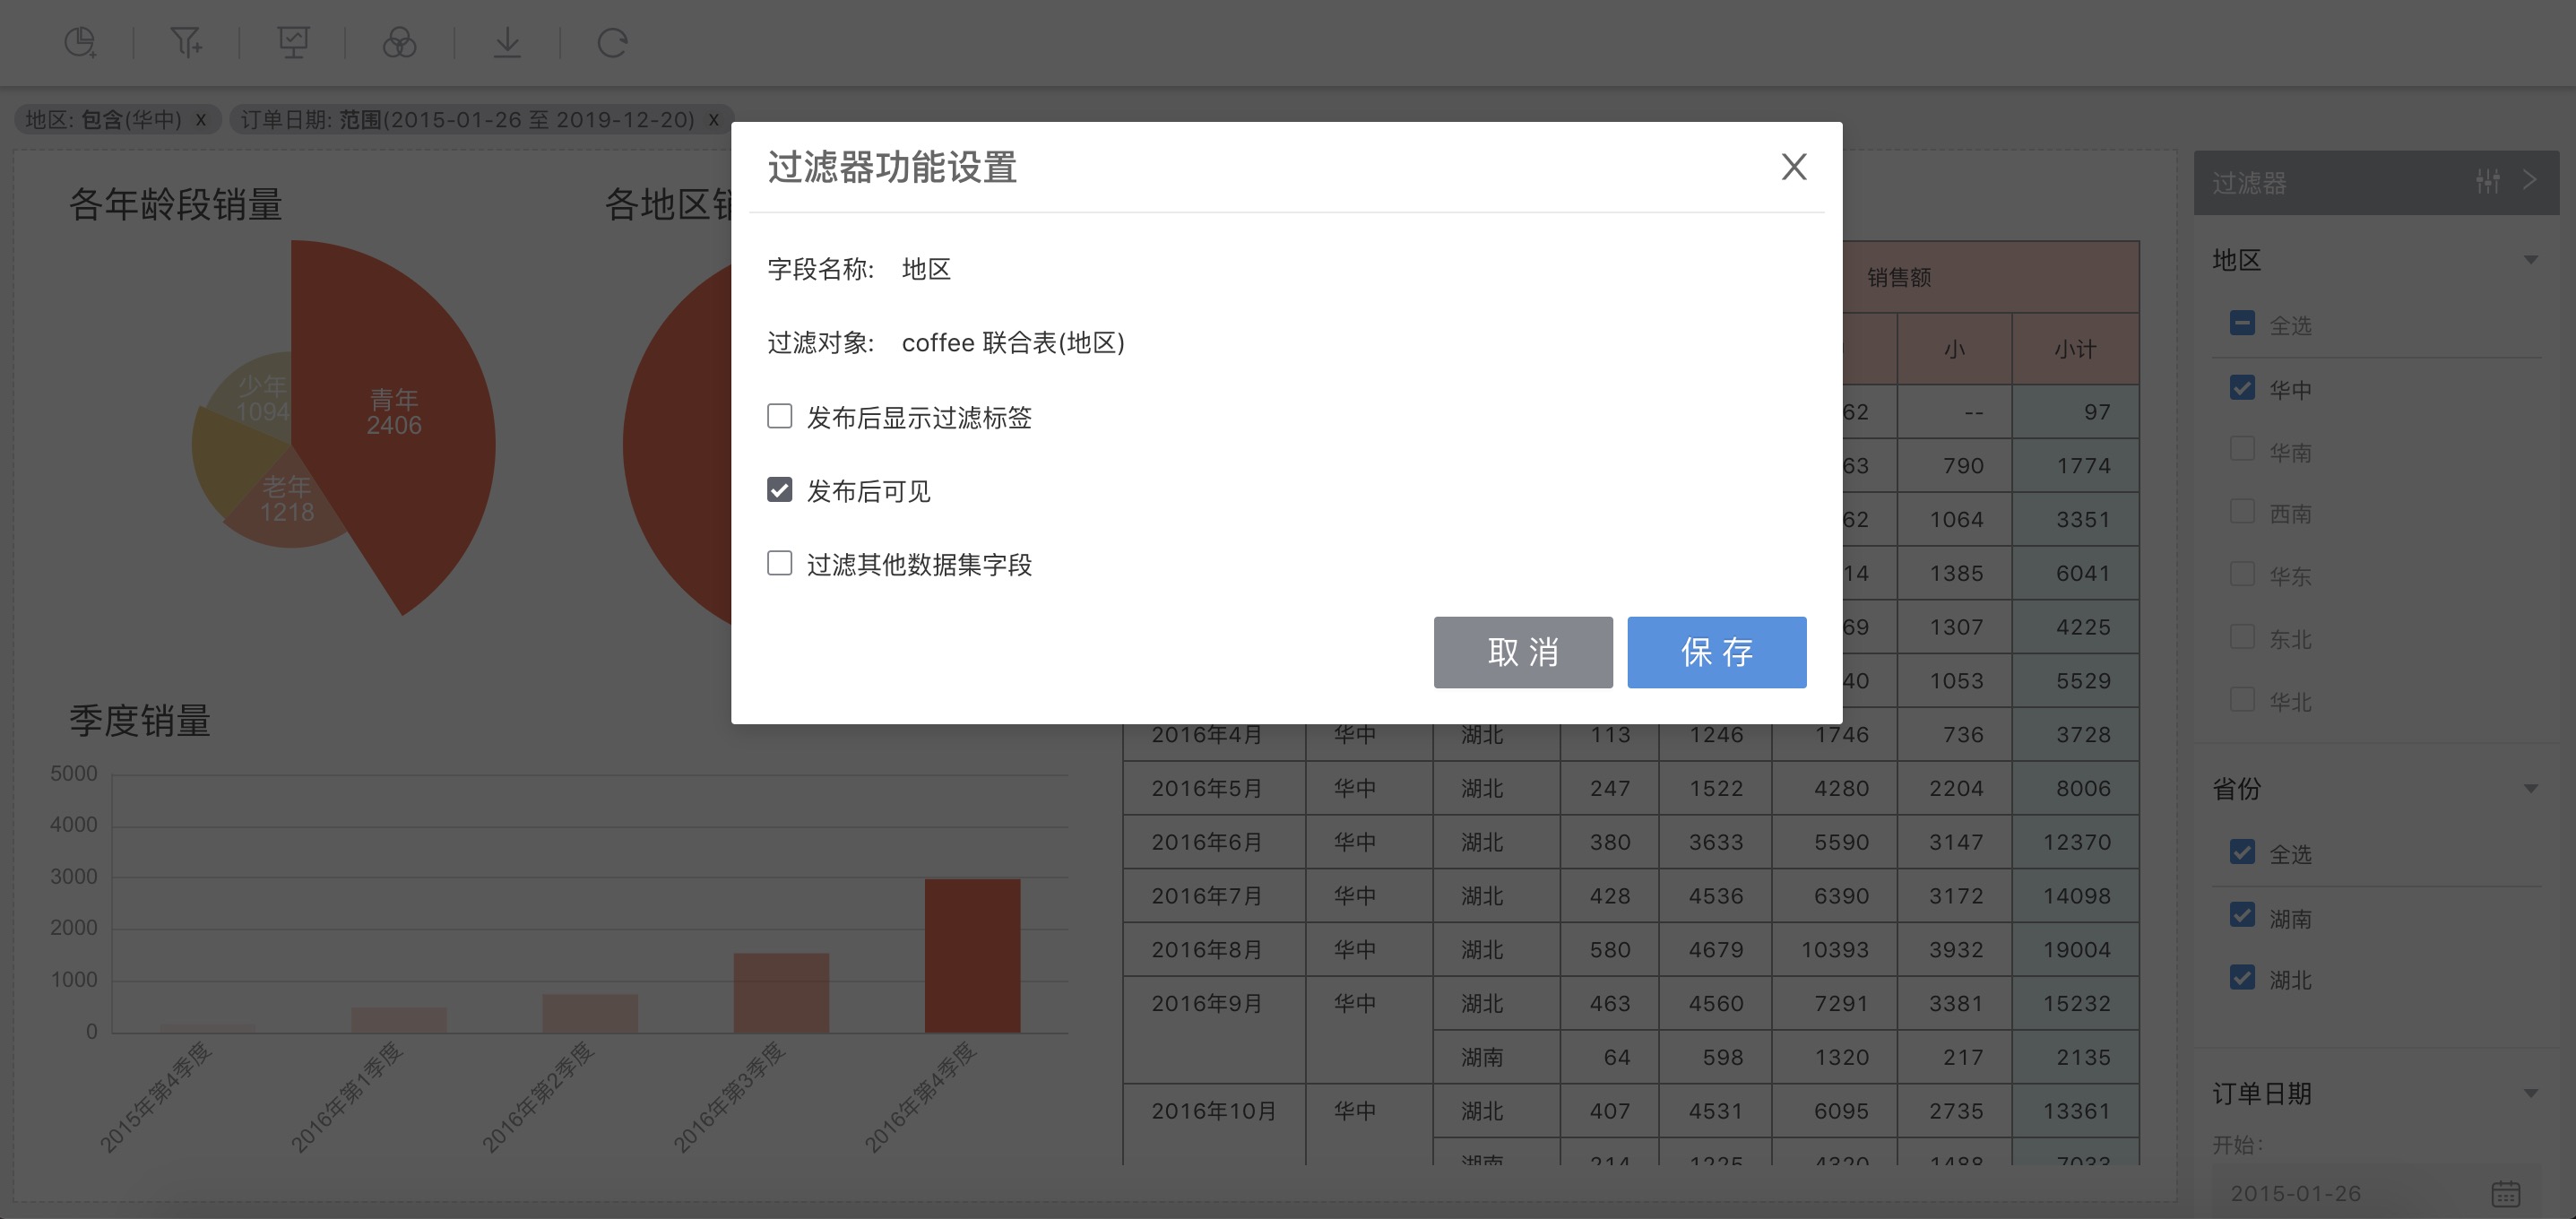
In this window, you can view the current name of the filter, the dataset of the filtered object, and the filtering field. You can set the following in this window:
Display filter tags after publication
Check
Display filter tags after publishingso that, after the current application is published, the filter criteria for this filter will be displayed in the upper left corner of the dashboard in the application marketplace.Uncheck
Display filter tags after publishing, and, after the current application is published, the filter criteria for this filter will not be displayed in the application marketplace.Visible after publication
Check
Visible after publishing, and after the current application is published, this filter will be displayed in the dashboard in the application marketplace.Uncheck
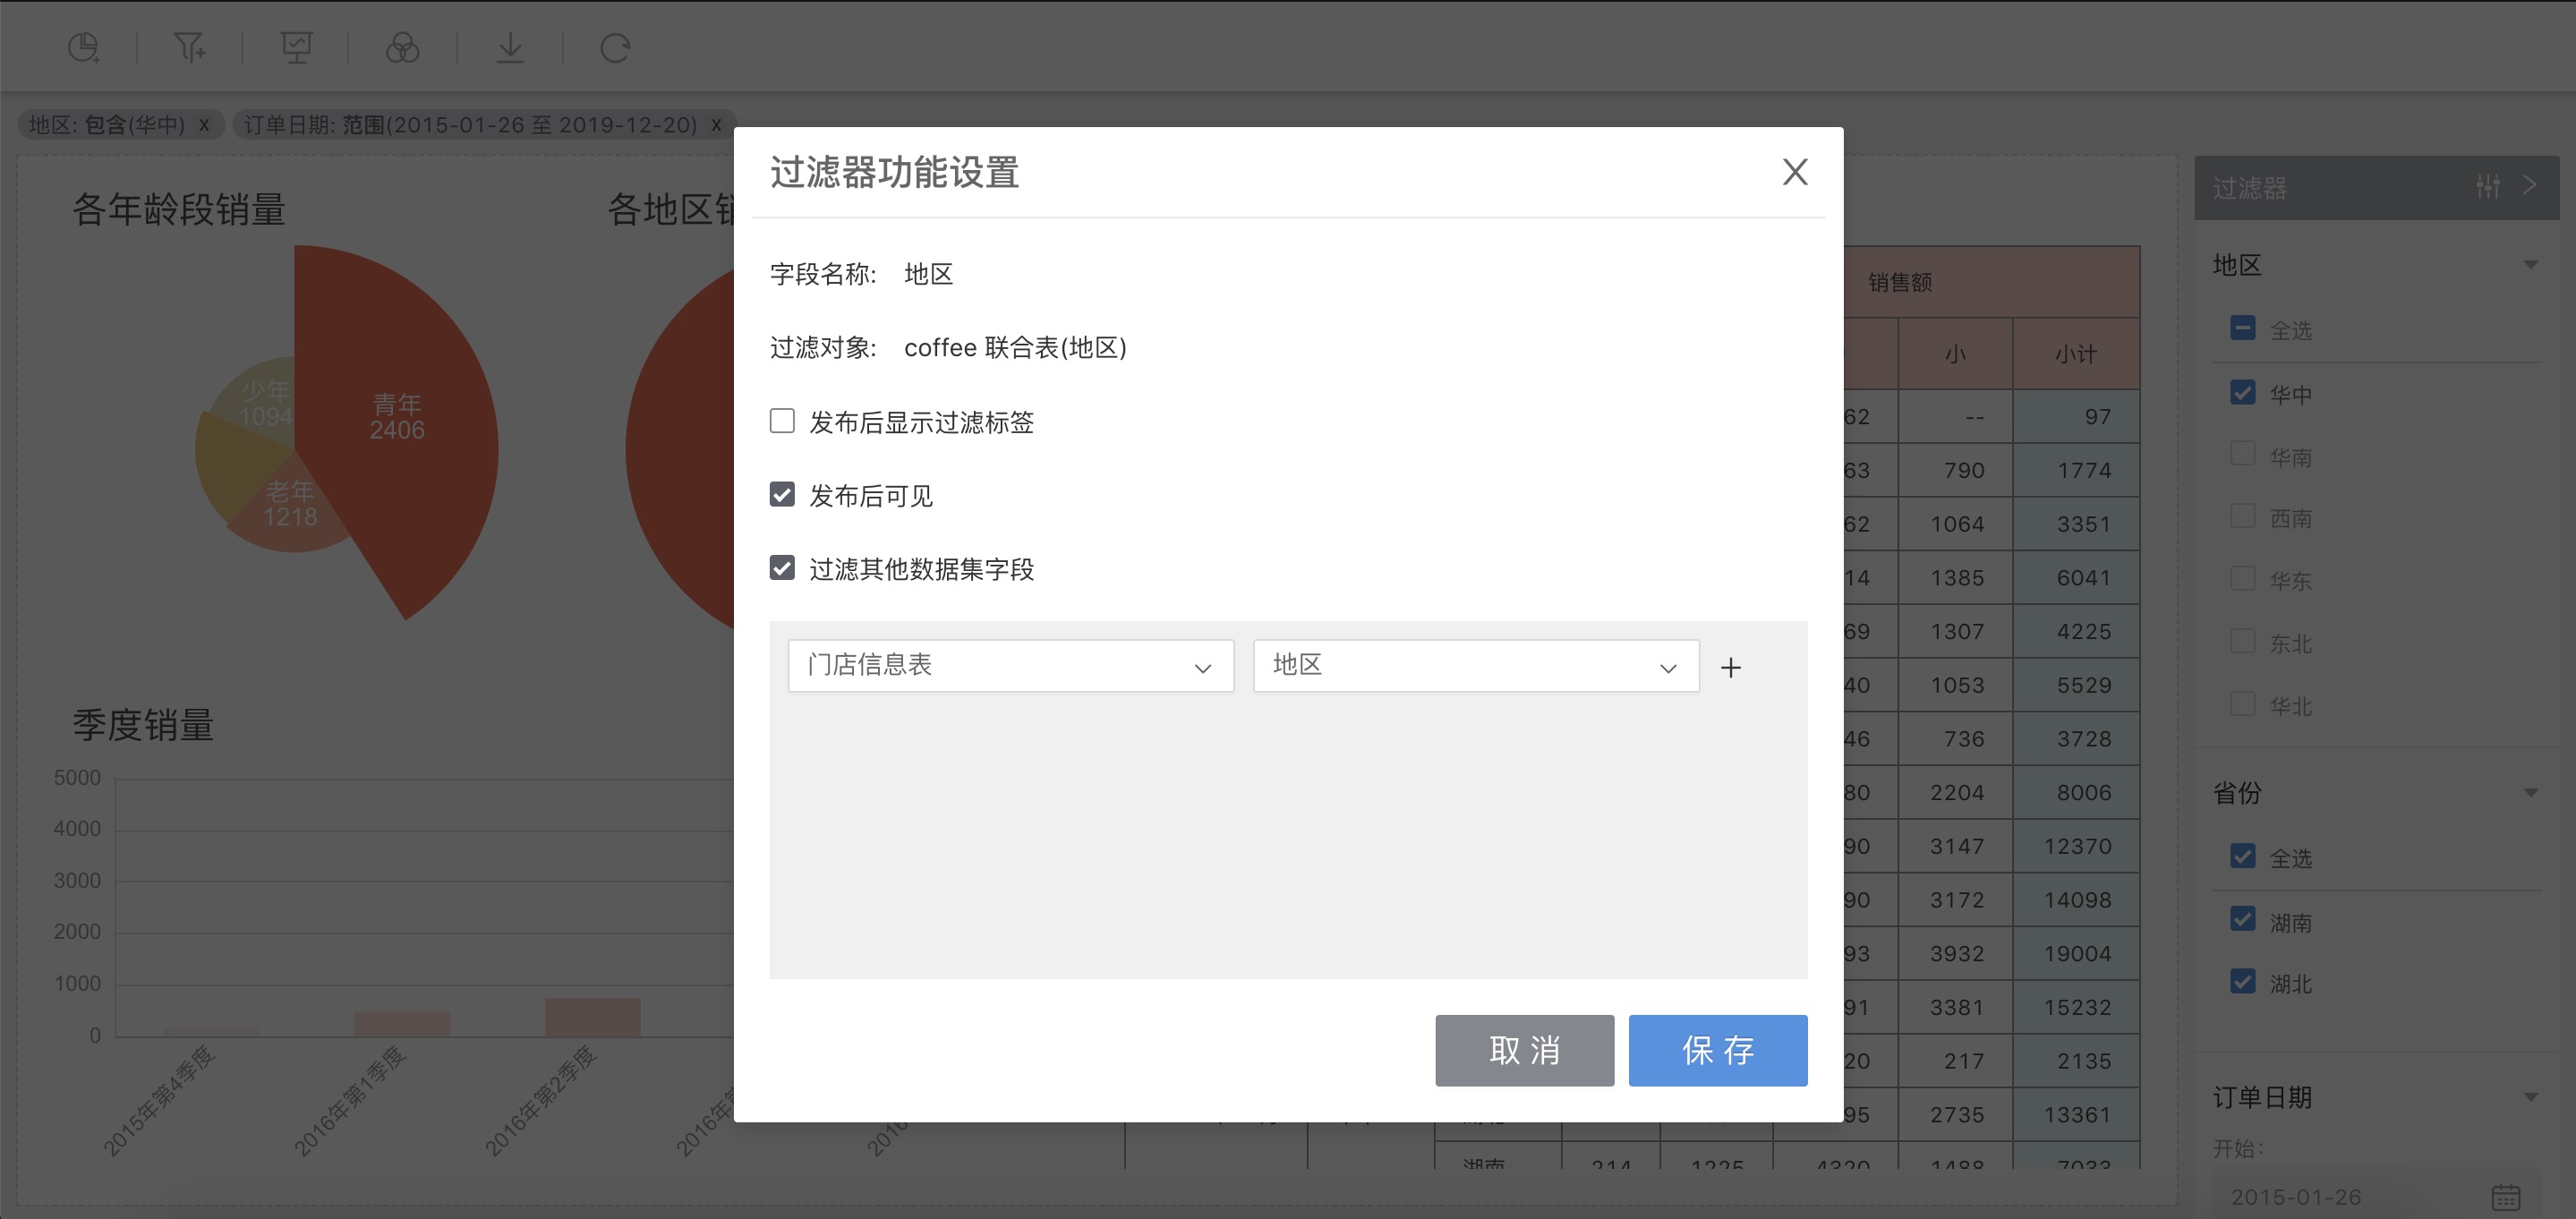
Visible after publishing, and after the current application is published, this filter will take effect but not be displayed.Filter other dataset fields
Check
Filter other dataset fields, and at the bottom of the window, the datasets list and the drop-down box with the selectable fields from each dataset will appear. Select the dataset and its field below, and the current filter's range will apply to the selected field.For example: The current filtering field is the region field from the dataset coffee Union Table. In the dataset drop-down box, select the region field from the Store Information Table dataset, and then the region field filter from the coffee Union Table dataset will be applied to the region field in the Store Information Table dataset. That is:
When the current filter selects East China, the charts created using the Store Information Table also only display data from the East China region.
Click the Global Settings icon to pop up a window where you can sort filter fields, rename them, and set linked filtering.
Chart Interaction Items
Each chart on the dashboard has interaction items:
- Download data: Export the data from the chart into an Excel file.
- Reset chart style: The theme of the chart updates to the default and no longer follows the current dashboard's theme.
- Settings: The chart's interaction settings and whether the current chart participates in linked filtering with other charts.
- Delete: Remove the chart.
- Open: Open the chart.
This section discusses the detailed usage methods for each option in the Settings of the chart interaction settings.
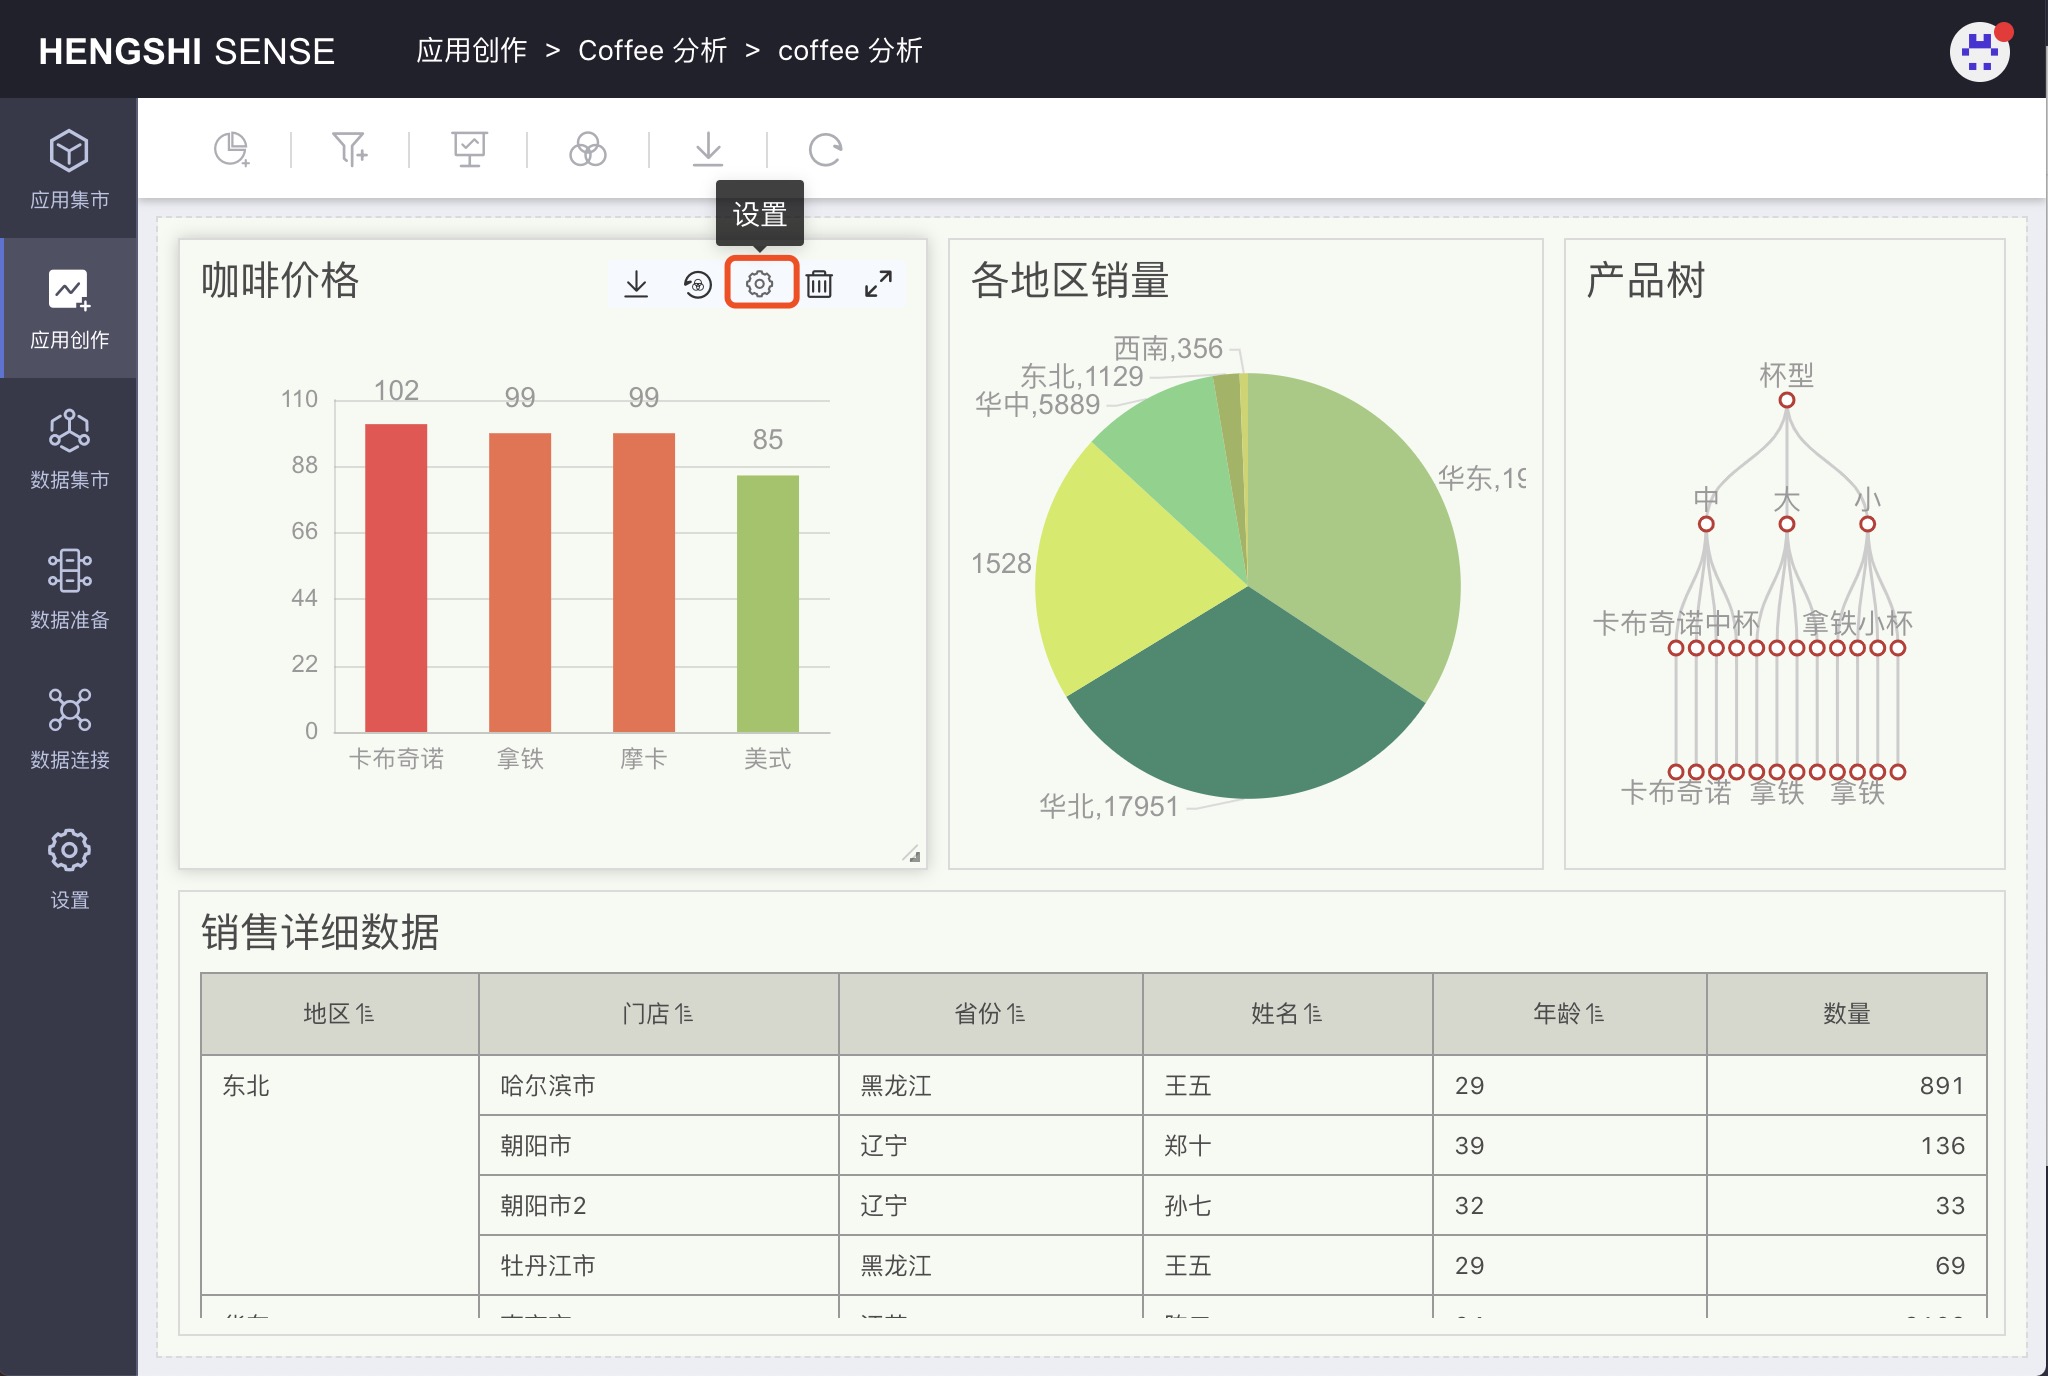
Click the settings button to open the chart interaction settings.
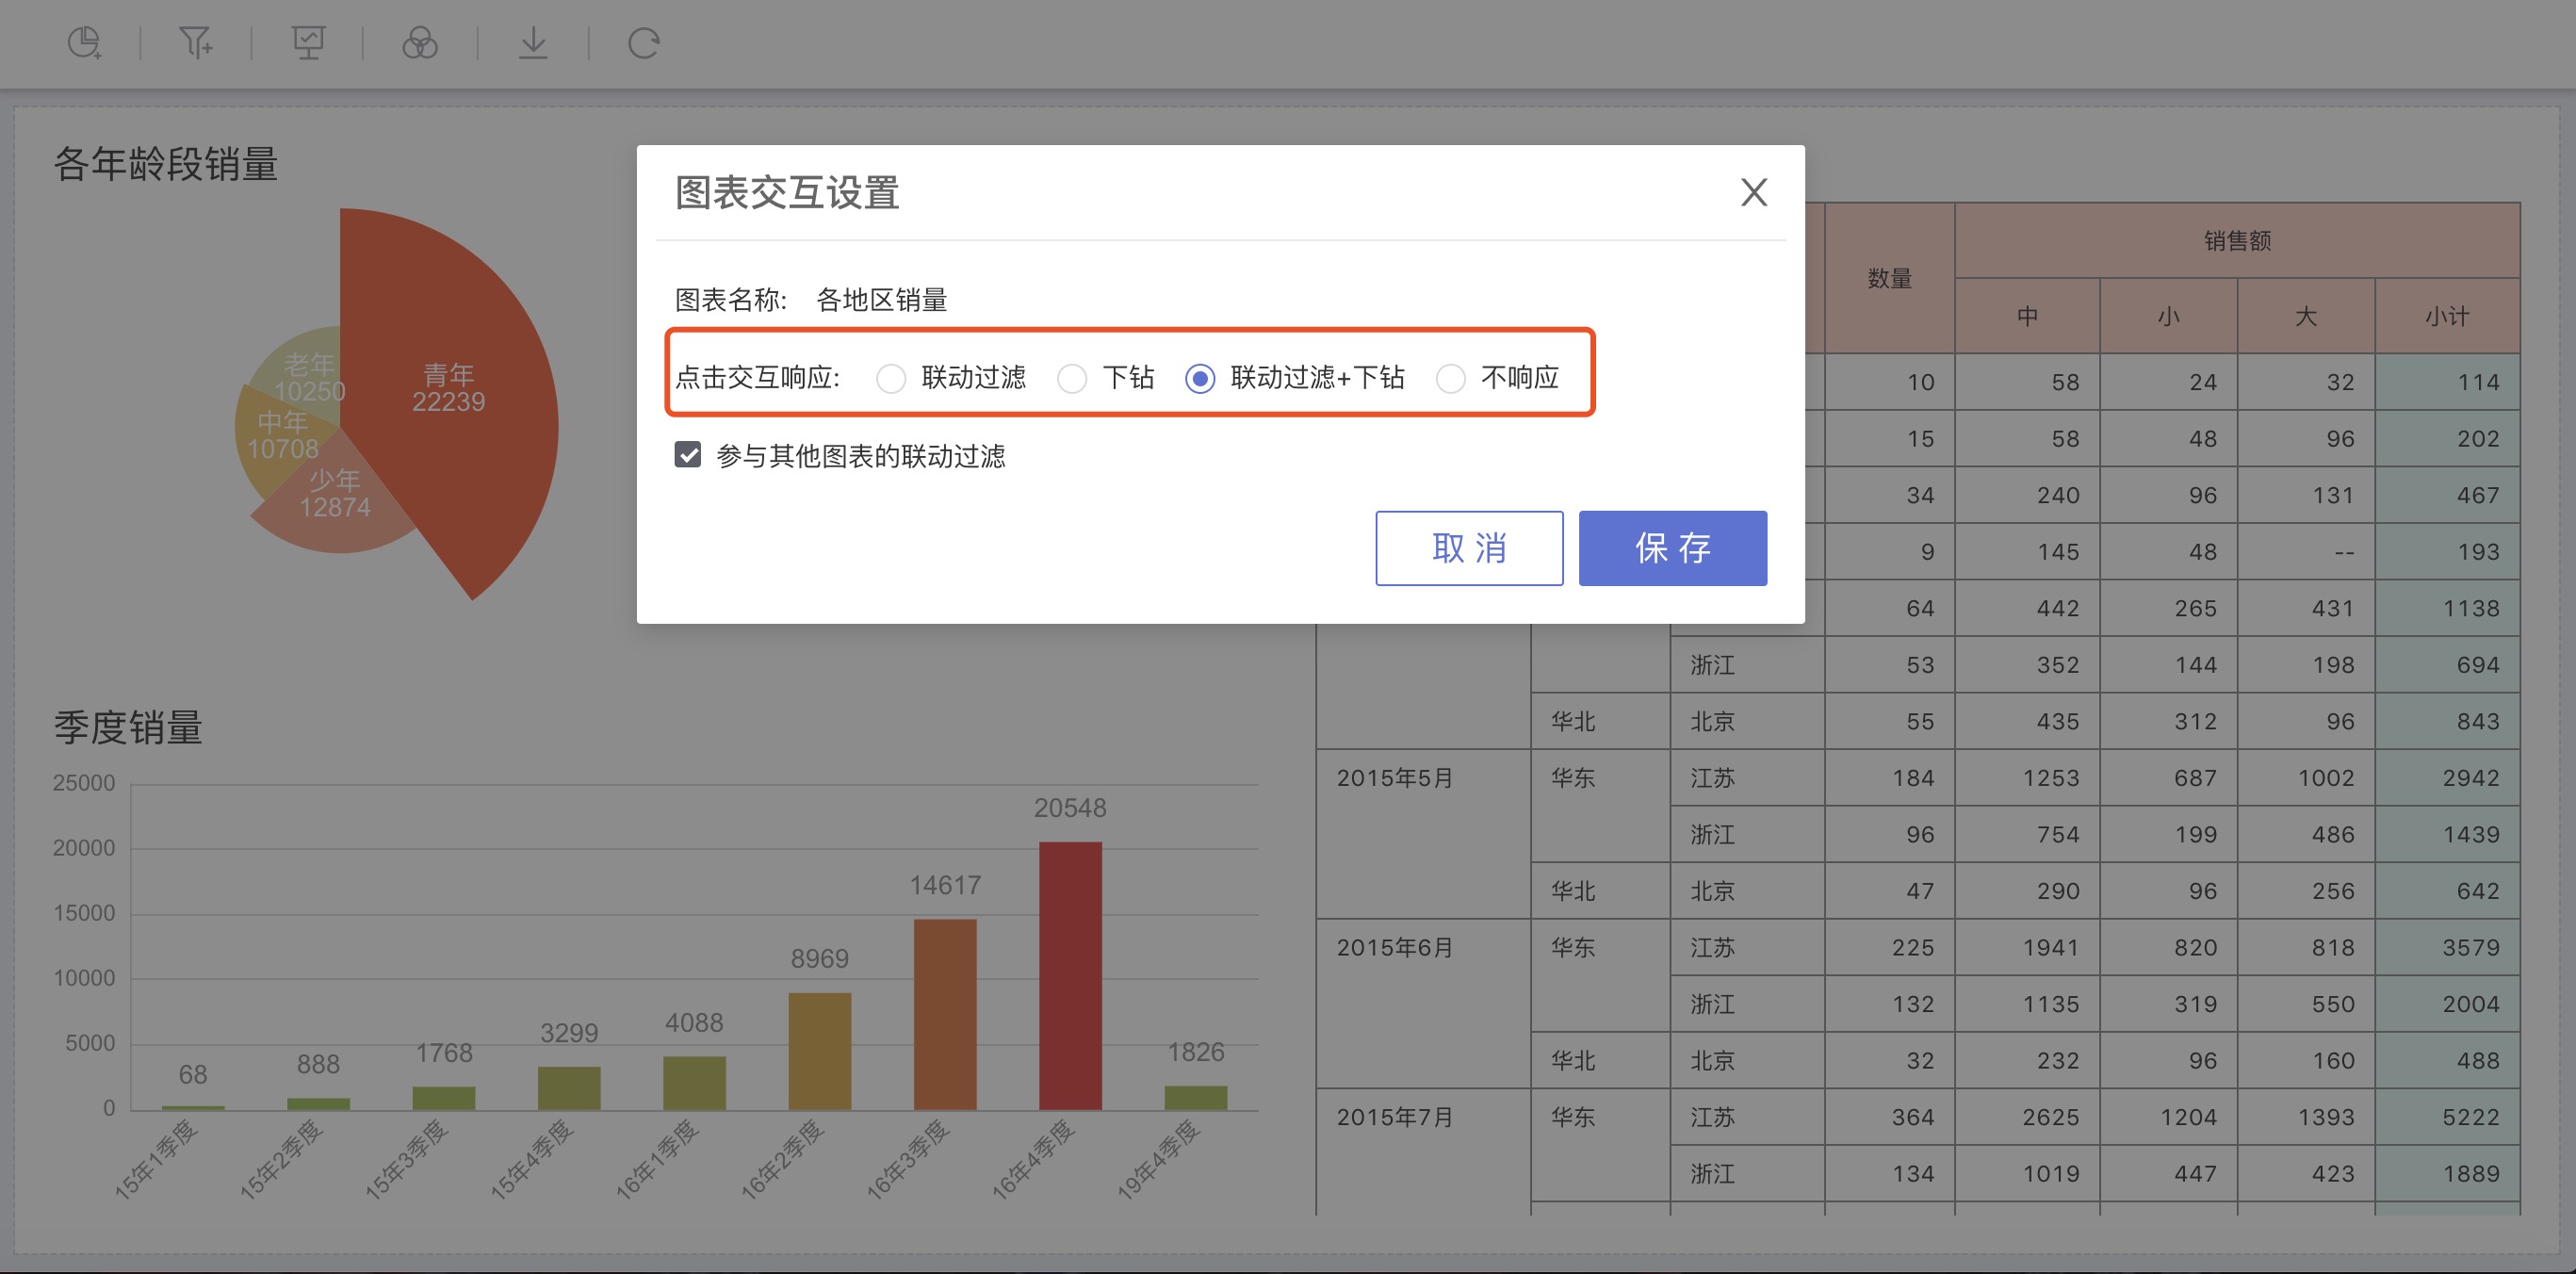
Chart Interaction Settings
In the chart interaction settings, you can set each chart's click interaction response.
Linked Filtering
Click Settings to open the Chart Interaction Settings. In the pop-up window, select Linked Filtering under the Click Interaction Response settings. When the chart is clicked, the clicked group will act as a filter condition filtering the data for other charts in the current dashboard.
The figure below uses the Sales by Region chart as an example, as shown in the animated image below, the chart's default Click Interaction Response setting is Linked Filtering:
First, click on East China to set the filter for the field Region to East China;
Click North China again to modify the filter to the field Region equals North China;
Click North China again, click on the group being linked filtered, cancel the linked filtering, and display complete data.
Check that the chart's
Click Interaction Responseis set toLinked Filtering;Click the Sales by Region section of the current pie chart:
Use {Region} = 'East China' as a filter condition to filter other charts in the current dashboard that come from the same dataset or the same data model;
View Sales by Age Group, Quarterly Sales, Sales Detail Data for the
East Chinaregion;Because all charts in the current dashboard come from other charts in the same data model, all charts filter and display data that meets the condition {Region} = 'East China'
Click the Sales by Region section of the current pie chart again North China:
Switch the filter condition to {Region} = 'North China', filtering other charts in the current dashboard that come from the same dataset or the same data model;
View Sales by Age Group, Quarterly Sales, Sales Detail Data for the
North Chinaregion;Click the Sales by Region section of the current pie chart again East China:
Cancel the current chart's linked filtering, and display complete data for each chart.
Note:
- The chart that initiates linked filtering and the chart that participates in linked filtering come from the same dataset or a dataset within a data model.
- Click on other groups in the chart that initiates linked filtering —> Switch the linked filtering condition
- Click on the linked group in the chart that initiates linked filtering —> Cancel linked filtering, display complete chart data.
Drill Down
Click Settings to open the Chart Interaction Settings. In the pop-up window, select Drill Down under the Click Interaction Response settings. When the chart is clicked, the clicked group will be explored according to the chart's set drill-down path.
The figure below uses Sales by Region as an example:
First, open the chart, click on the
Interactionarea in the middle setting area, where there is aDrill Down Settingarea. Drag fields or metrics into the drill-down settings to serve as the drill-down path:
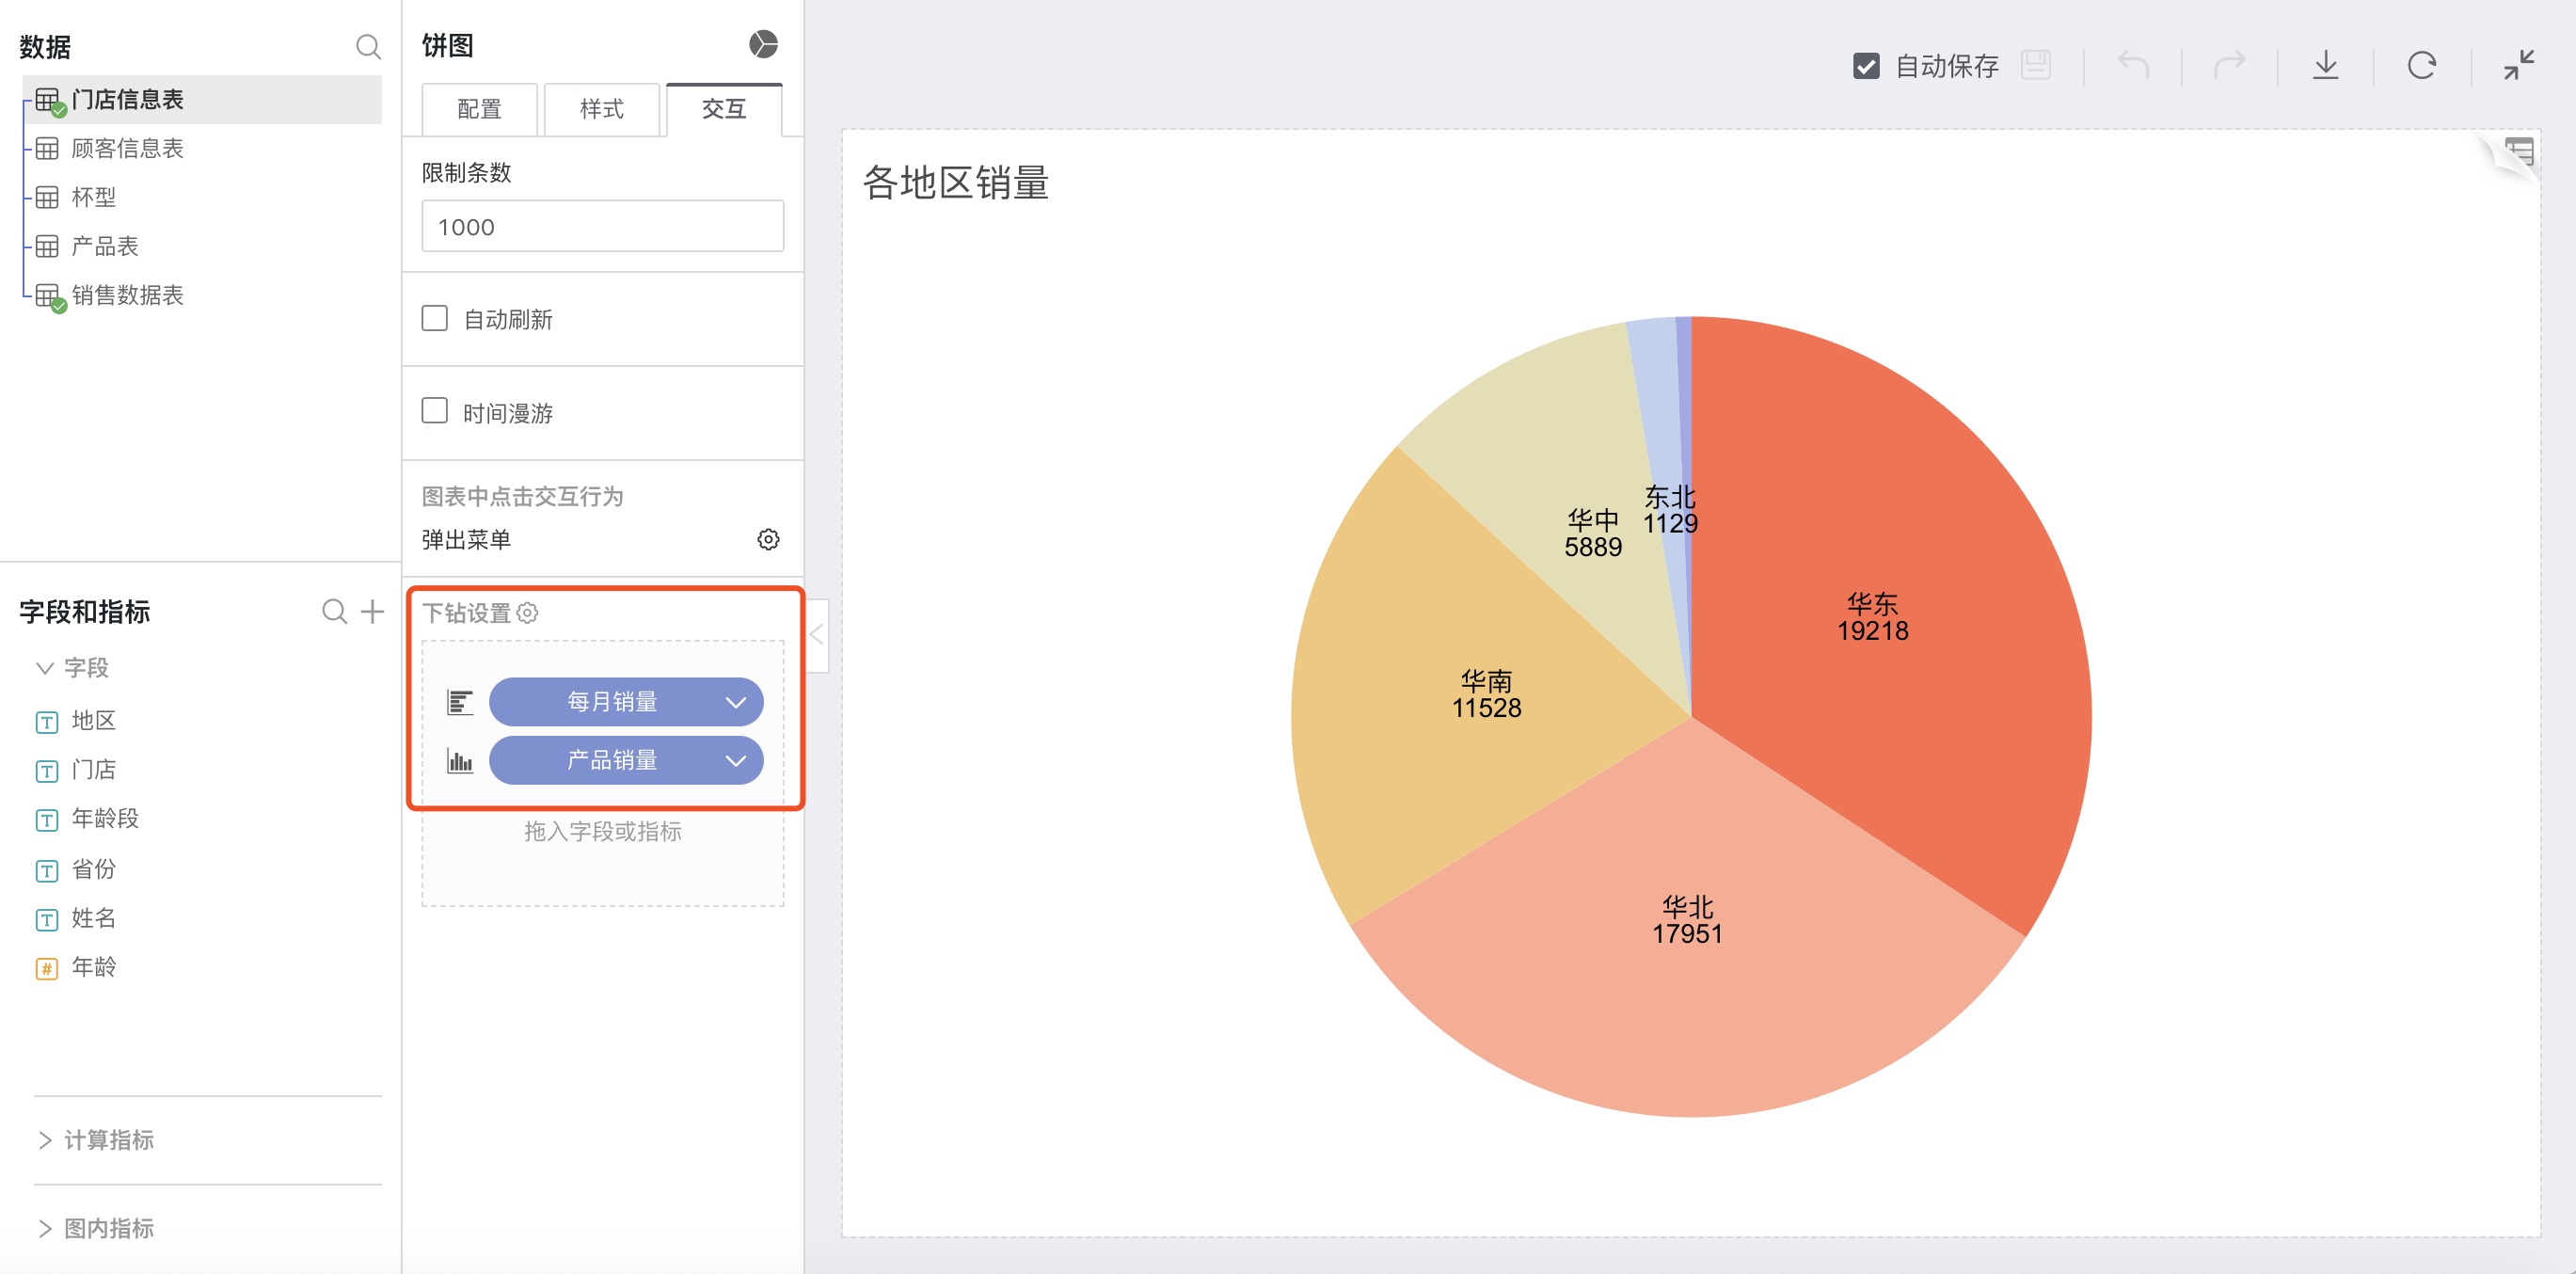
As shown in the animation below, set the chart's
Click Interaction Responsein the dashboard toDrill Down:Select the chart Sales by Region, click the settings button, and in the pop-up window, set
Click Interaction ResponsetoDrill Down;Click the East China section of the pie chart to reset the dimension analysis for the {Region} = 'East China' group's data:
Following the set drill-down path and using Sales Date -> Aggregate by Month as the dimension, analyze the sales data in {Region} = 'East China' by year in the form of horizontal bar charts;
Click on the 2016 bar of the horizontal bar chart, resetting the dimension analysis for the data of the {Region} = 'East China' group for Sales Date (Month) = December 2016:
Following the set drill-down path, using Product Name as the dimension, and analyzing {Region} = 'East China' group sales data in Sales Date (Month) = December 2016.
Click the drop-down button under the chart name, and the popup lists the chart names for each level of the drill-down, click on a name to return to the respective level chart.
Note: Prerequisites for being able to drill down in a chart on the dashboard are:
- In the chart's
Interaction—>Click Interaction Behaviour in the Chart—>Pop-up Menuresponse is set toPop-up MenuorDrill Down;- The chart's
Interaction—>Drill Down Settingshas drill-down path fields added.
Linked Filtering + Drill Down
Click Settings to open the Chart Interaction Settings. In the pop-up window, select Linked Filtering + Drill Down under the Click Interaction Response settings. When the chart is clicked:
The clicked group will explore according to the chart's set drill-down path;
The clicked group will act as a filtering condition, filtering the data for other charts in the current dashboard.
Below is an example with Sales by Region:
First, open the chart, click on the
Interactionarea in the middle setting area, where there is aDrill Down Settingarea. Drag fields or metrics into the drill-down settings as a drill-down path:
Return to the dashboard and select the chart that has had a drill-down path added. Click on the
Settingsbutton at the top right of the chart and set the chart'sClick Interaction ResponsetoLinked Filtering + Drill Down;Click on a dimension group in the chart:
The current chart:
According to the set drill-down path, rediscover data for the selected group's dimension analysis;
For example:
In the current chart, when clicking on the group East China, filter all data for the East China region in the chart's dependent dataset, and analyze the sales data for the East China region by Order Date month by month;
In the horizontal bar chart Monthly Sales after the first level drill-down, when clicking on the December 2016 bar, filter all data for the East China region in the chart's dependent dataset for Order Date as December 2016, and use Product Name as the dimension to analyze the sales data for the East China region in December 2016;
Other charts from the same dataset or the same data model:
Take the clicked dimension group as a filtering condition, filter the data of the corresponding dataset or the data within the data model, and re-render other charts;
For example:
In the current chart, when clicking on the group East China, take {Region} = 'East China' as the filtering condition to filter data from other chart's datasets. Since all charts in the current dashboard come from the same data model, all charts re-render data for the East China region.
In the horizontal bar chart Monthly Sales after the first level drill-down, when clicking on the December 2016 bar, take {Region} = 'East China' and {Order Date (Month)} = December as filtering conditions to filter data from other chart's datasets. The re-rendered charts will show data for the East China region in December 2016.
Charts from non-related datasets:
Clicking on the chart does not affect other charts from non-related datasets
Continue clicking on the groups in the chart on the last level of the drill-down path
The current chart
On the last level of the drill-down Product Sales, clicking on the bars Latte Medium and Mocha Large again, the chart does not drill down any further and only performs a linked filtering operation;
Other charts from the same dataset or the same data model are then filtered according to the groups Latte Medium and Mocha Large one by one, selecting the corresponding data and re-rendering;
No Response
Click Settings to open the Chart Interaction Settings. In the pop-up window, select No Response under the Click Interaction Response settings. When the chart is clicked, the clicked group is highlighted.
Participate in Linked Filtering of Other Charts
Other charts' Settings—>Chart Interaction Settings—>Chart Interaction Response set to Linked Filtering and Linked Filtering + Drill Down. Clicking on a dimension group in the chart can act as the initiator of linked filtering, and the clicked group will be used as a filtering condition to filter the data of other charts.
Check
Participate in Linked Filtering of Other ChartsWhen a chart checks
Participate in Linked Filtering of Other Charts, the chart will re-render according to the filtering condition of the initiating chart;Uncheck
Participate in Linked Filtering of Other ChartsWhen a chart does not check
Participate in Linked Filtering of Other Charts, it does not participate in linked filtering with other charts. When other charts initiate linked filtering, the chart does not respond.