Hengshi Documentation
Table of Contents generated with DocToc
Aggregate Dataset
Create New Aggregate Dataset
Step One, navigate to the dataset page, click on create a new dataset, and select Data Aggregation

Step Two, go to the dependent dataset selection page
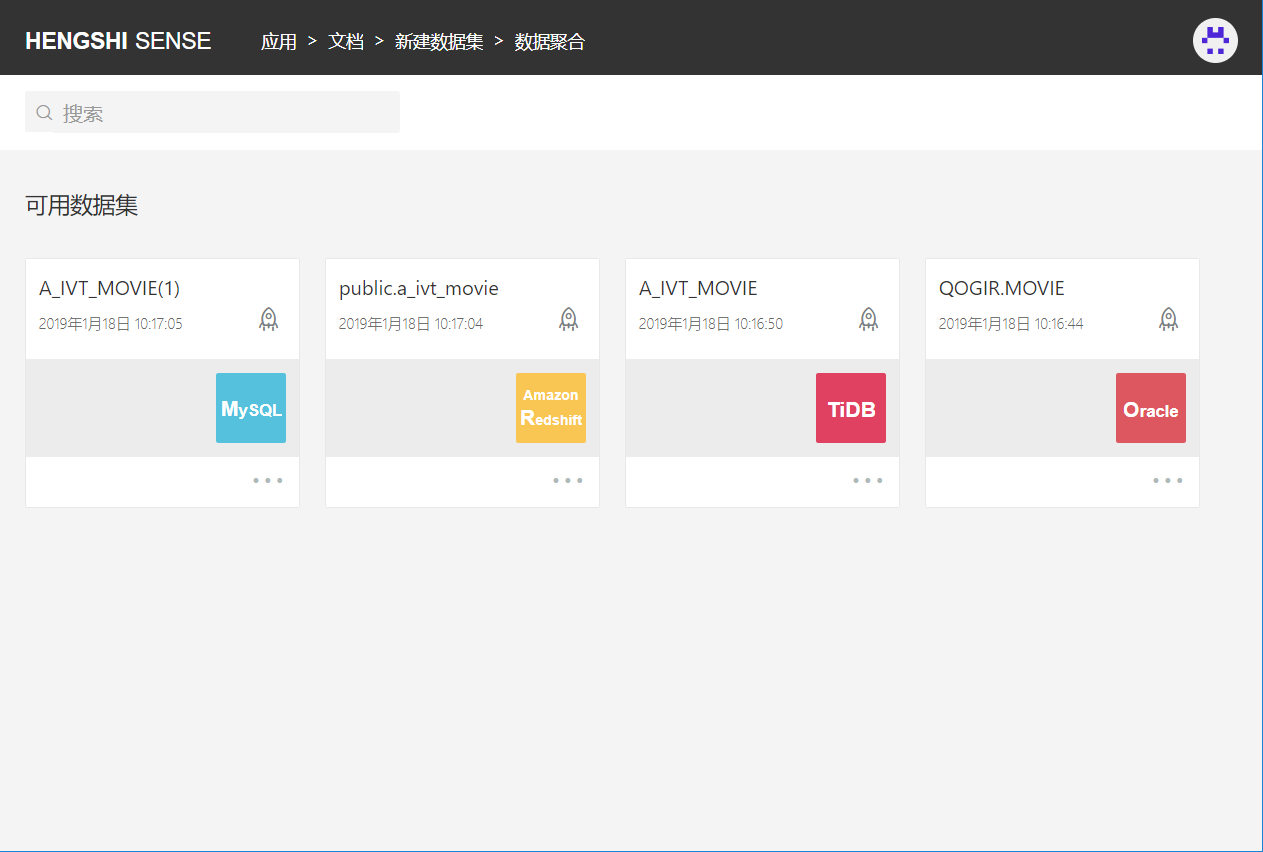
Click to select a dataset and proceed to the next step
Step Three, data aggregation preview data interface
Select dimensions and measure fields
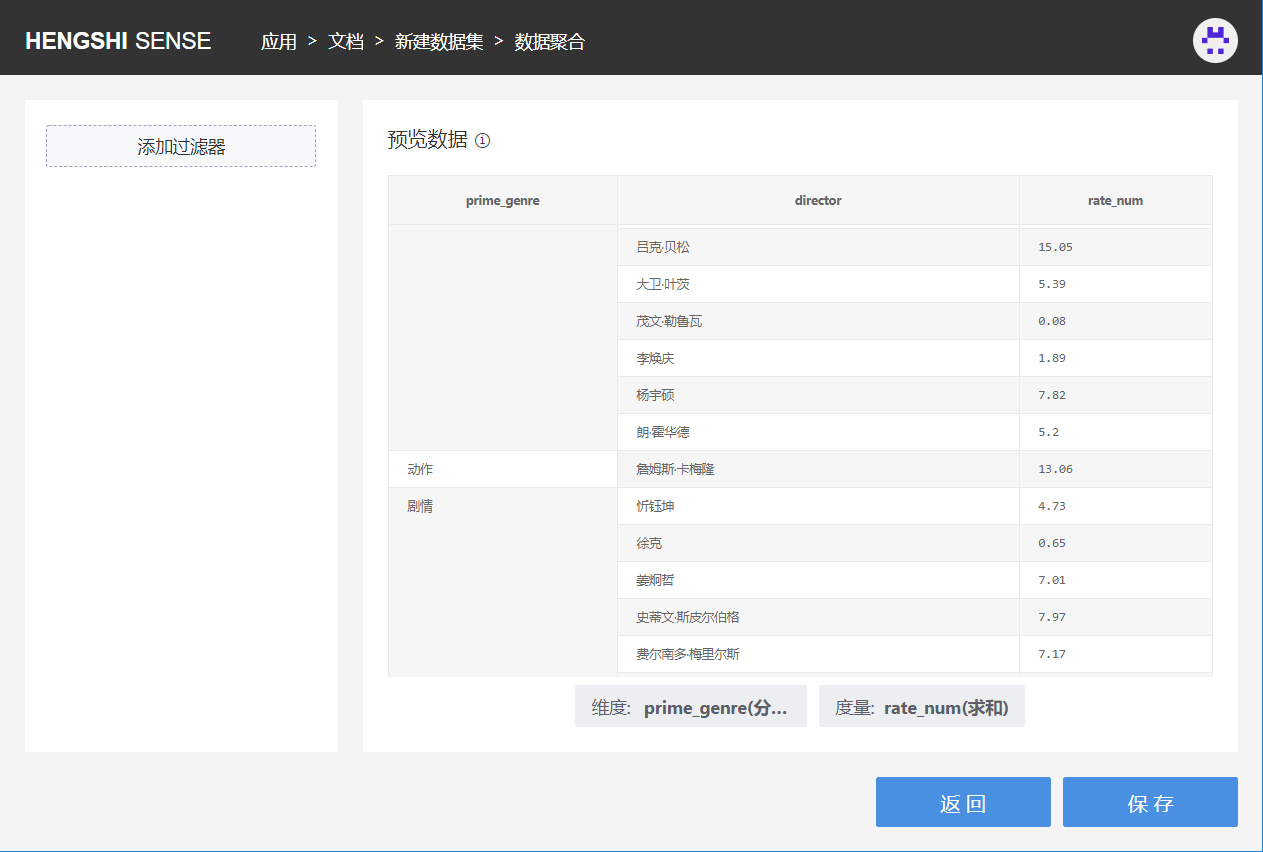
As illustrated, select dimensions and measure fields, and you can preview the aggregation results in the interface.
This supports selecting multiple dimensions and measures.
On the left is the add filter condition window, which can be used to filter the result set
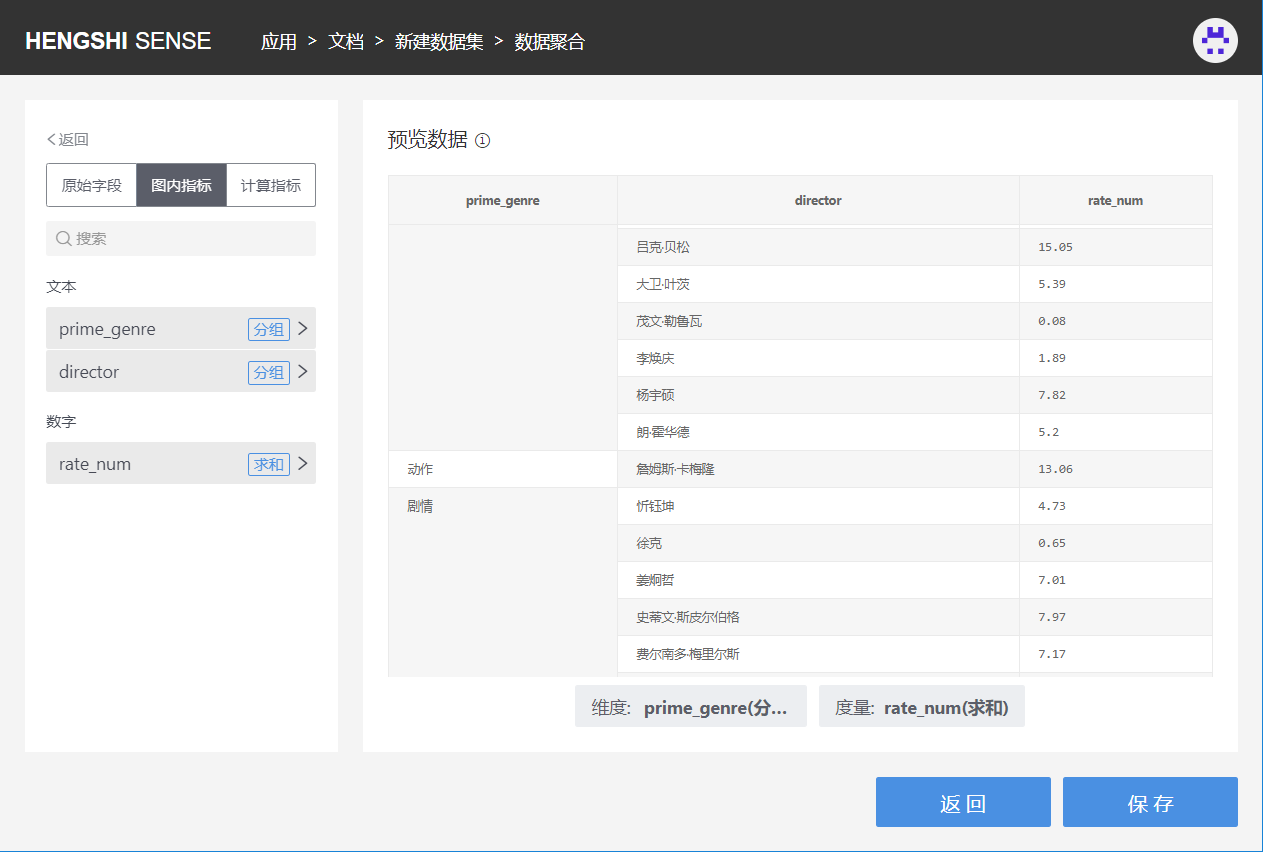
The filterable fields are divided into three types: original fields, chart metrics, and calculated metrics
Original fields are all fields enabled in the dependent dataset;
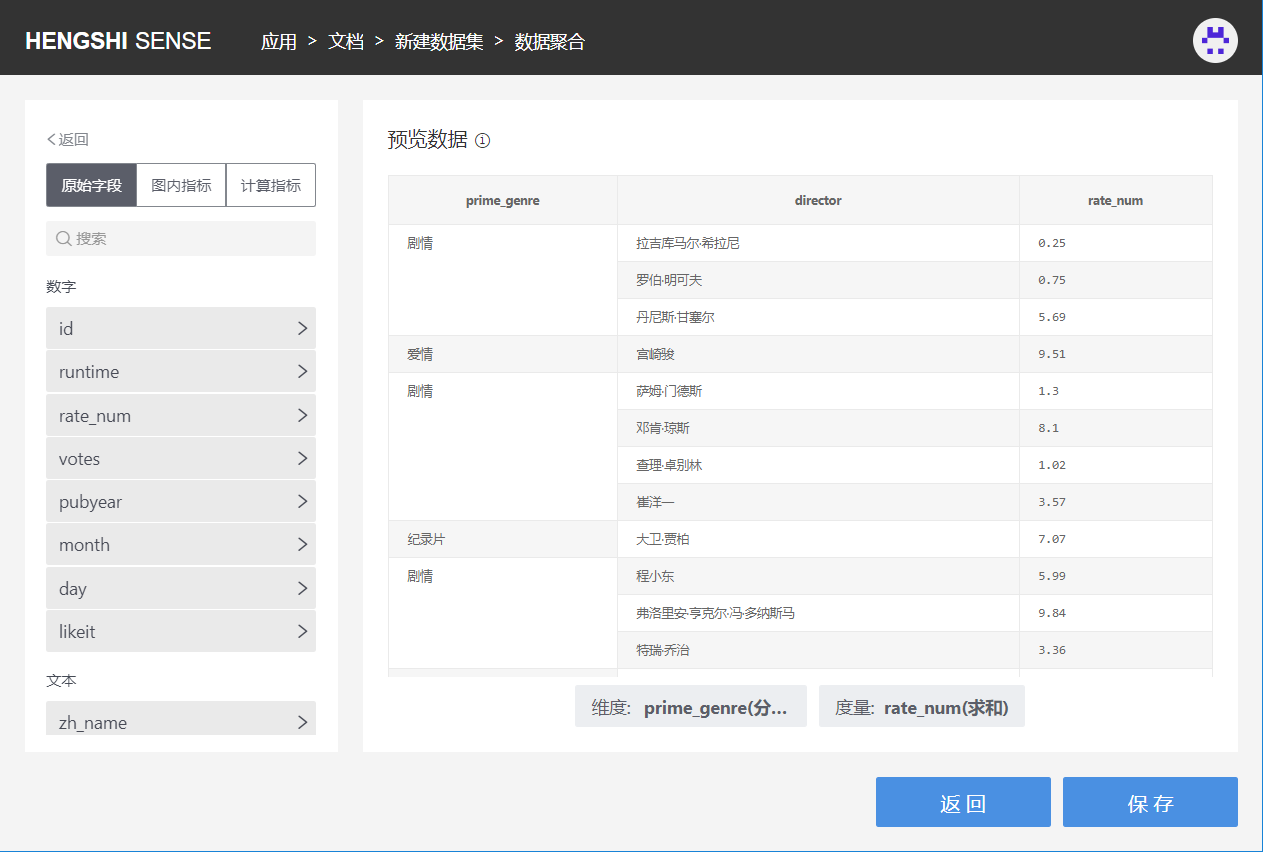
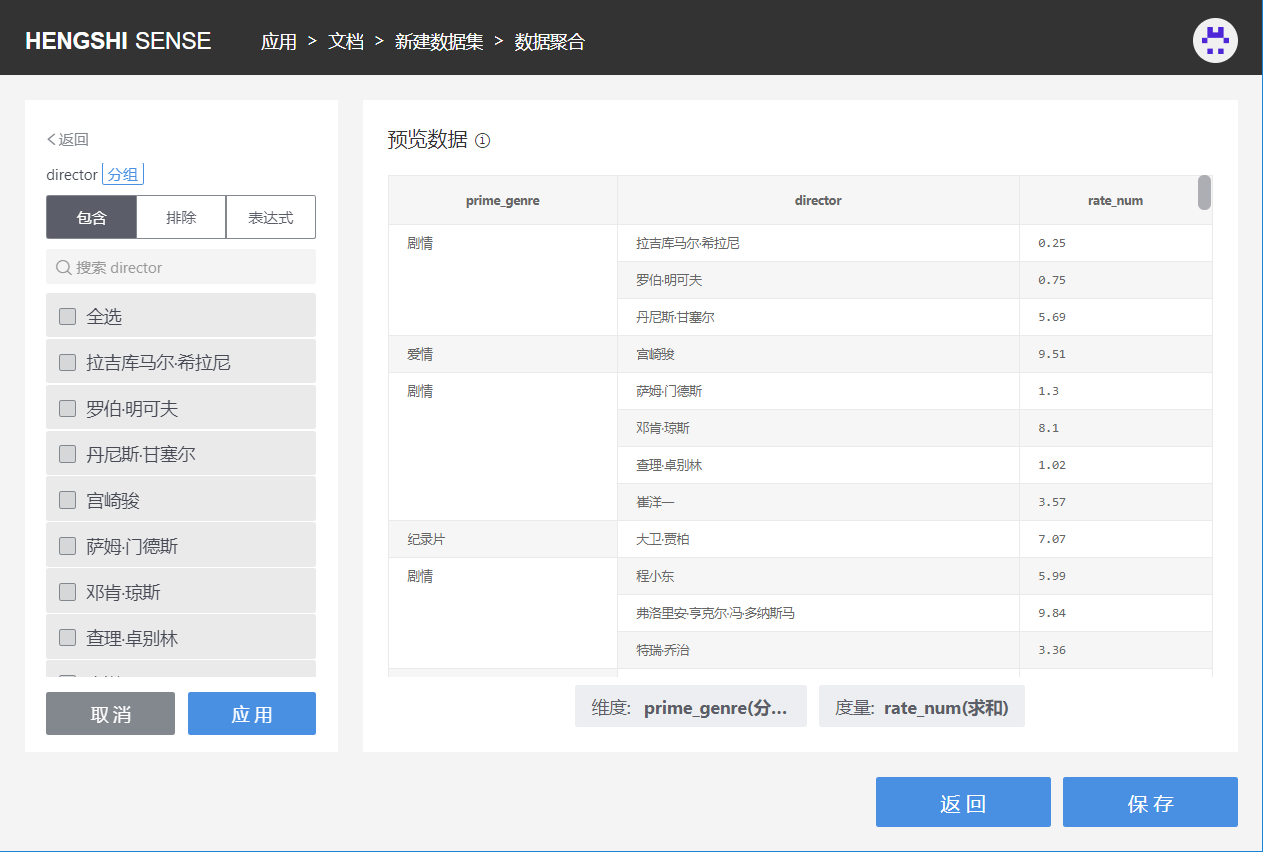
Chart metrics show the dimensions and measure fields added to the table, filter upon the aggregation basis of dimensions and measures, and at the end of the field, the aggregation method when used as a dimension/measure in the table is displayed;
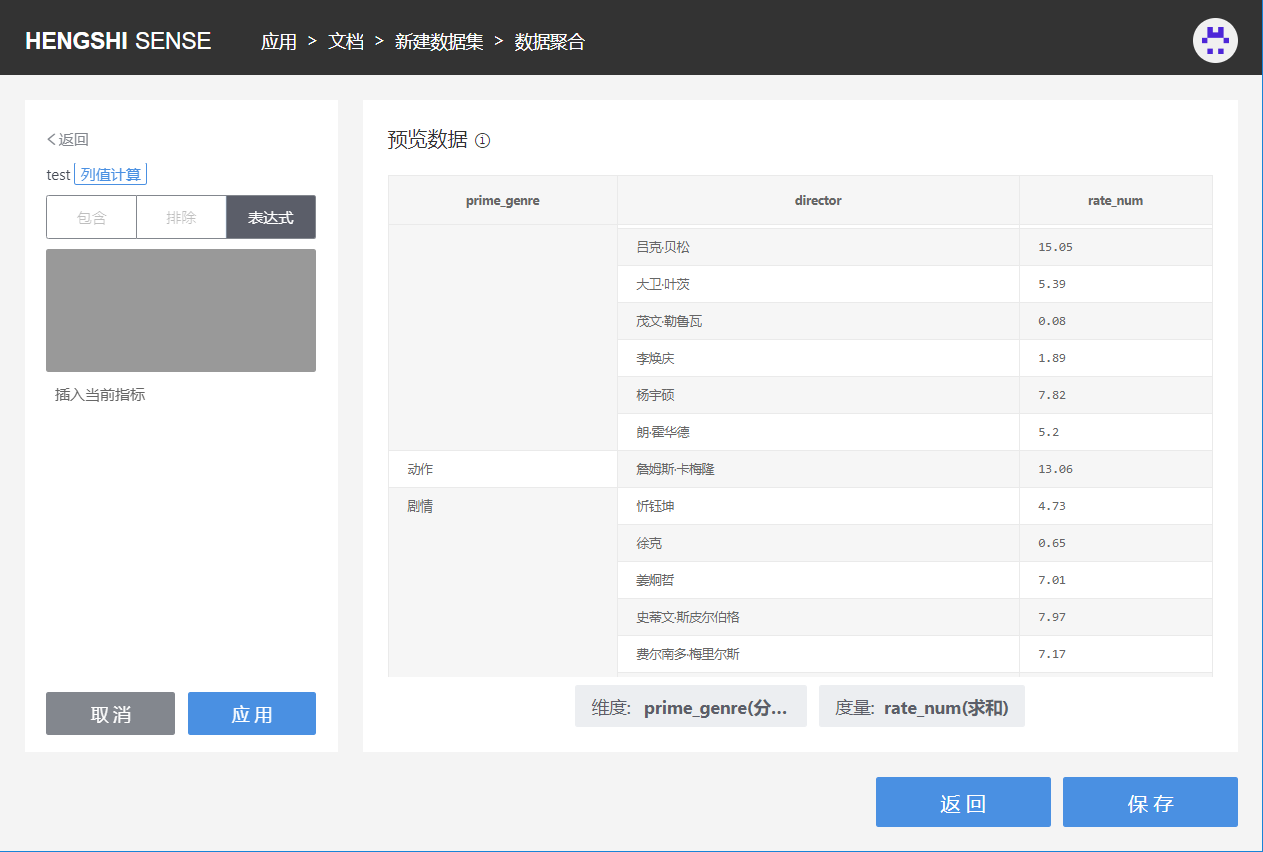
Calculated metrics refer to new metrics added on dimensions or measures when creating the table. Currently, these new metrics only support expression filtering, and the chosen calculation method for the additional metrics will be displayed at the end of the metric;
Select the field for which you want to add a filter condition, enter the filtering criteria for the chosen field, and click Apply to see the filtered results.
Multiple fields can be selected to add filter conditions, and the relationship between each filter condition is AND.
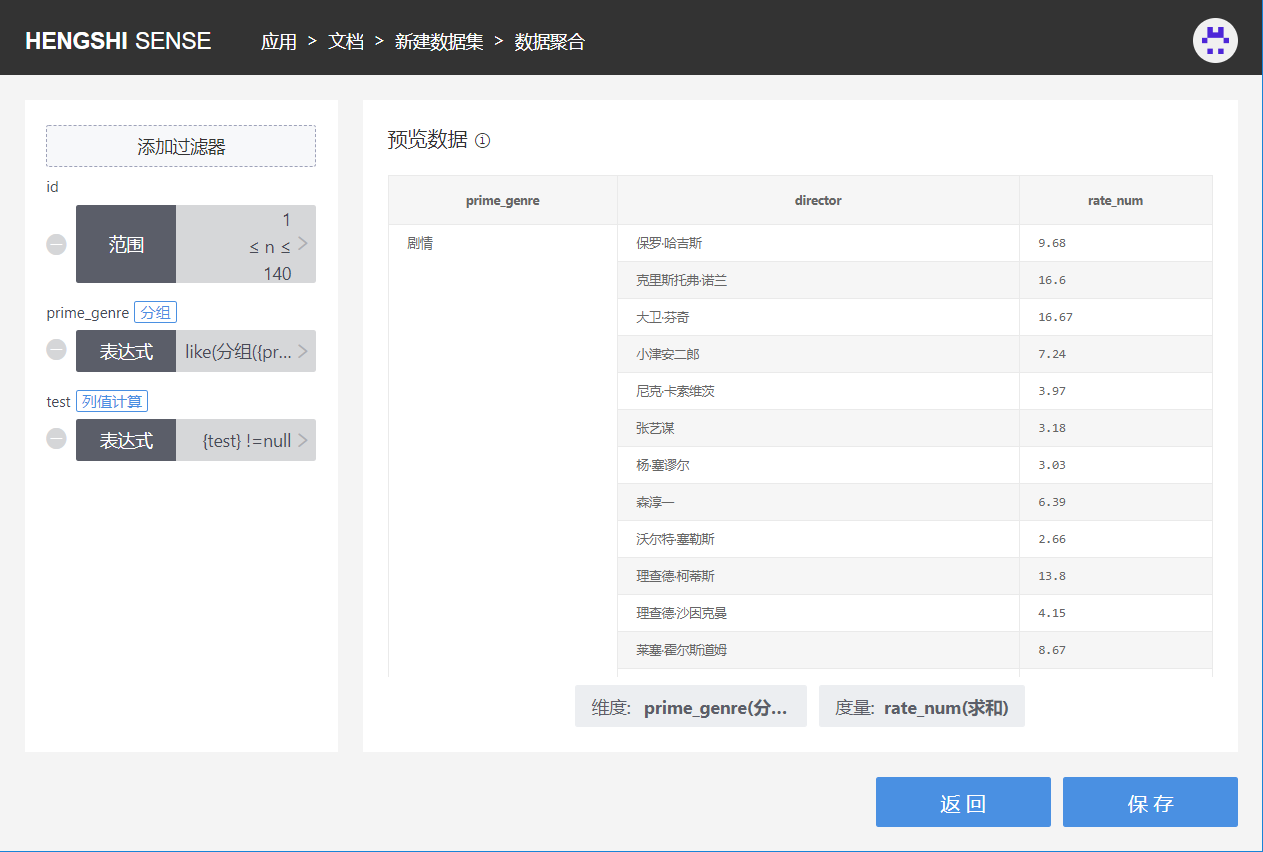
As shown in the above figure, id is an original field, prime_genre is a chart dimension metric, and at the end of the field, the aggregation method "Grouping" used in dimensions is displayed. Test is the added calculated metric.
- Aggregate datasets created from a direct connection dataset with the acceleration engine not enabled can be toggled on or off;
- For datasets that have created an aggregate dataset with the acceleration engine enabled, the engine's status can no longer be changed;
Step Four, save
Complete the creation of the dataset.